
The open rate benchmarks
Per-account medians across the 242 accounts with 1,000 or more sponsored messaging sends in the twelve months to September 2026, USD, all formats:
| Open rate | Poor (bottom quartile) | Median | Good (top quartile) | Exceptional (top decile) |
|---|---|---|---|---|
| All sponsored messaging | 37.2% | 42.6% | 48.8% | 53.9% |
| Message ads (single message), campaign median | 45.4% | |||
| Conversation ads (multi-button), campaign median | 38.1% | |||
| No-form message ads (landing page or calendar) | 37.0% | 41.9% | 48.7% | 54.0% |
Notice how narrow the range is. Poor is 37%, exceptional is 54%, a 1.5× spread on a metric people spend most of their optimisation time on. Almost everyone opens a LinkedIn message, because it arrives as a notification and sits in the inbox until they do. Compare that to cost per lead on the same accounts, which spreads 32× from $32 to $1,005. The full tables are in Kiin Labs 2026.
Why open rate barely moves cost per lead
Cost per lead is cost per send divided by lead rate, and lead rate is open rate × form opens per open × form completion. The study decomposed cost per lead into those four parts across 143 accounts and asked how much of the variance each explains:
| Component | Share of variance in cost per lead |
|---|---|
| Cost per send | 55% |
| Form opens per open (does the message earn the click) | 38% |
| Form completion | 13% |
| Open rate | 2% |
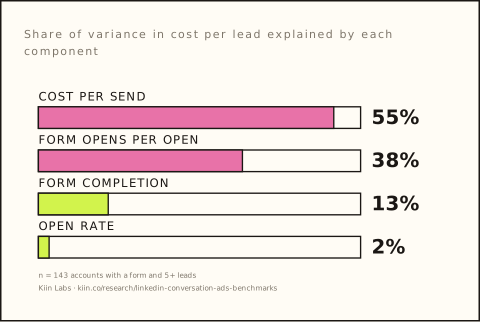
The cheapest quarter of accounts open at 49.9% and the dearest quarter at 39.3%, a real difference, but it is dwarfed by the other two levers: the cheap accounts pay $0.098 per send against $0.660, and get 1.97 form opens per 100 opens against 0.57. Form completion is the same in both groups (40% vs 37%). Rewriting a subject line to lift opens from 41% to 44% is worth about 7% on cost per lead. Halving cost per send is worth 50%.
What actually changes open rate
Every comparison below is the same advertiser running both settings, paired within account, with 95% confidence intervals.
| Setting | Effect on open rate | Base |
|---|---|---|
| Retargeting vs cold audience | +18% [+11%, +26%] | 49 accounts ★★ |
| Retargeting vs uploaded list | +21% [+14%, +35%] | 49 accounts ★★ |
| Uploaded list vs cold | +1% (ns) | 35 accounts |
| Conversation ad vs message ad | −20% [−25%, −14%] | 53 accounts ★★ |
| Senior-only vs no seniority filter | −5% (significant) | 35 accounts |
| Highest bid vs lowest bid in the account | 0% [−3%, +4%] | 119 accounts ★★★ |
| Highest sends-per-member vs lowest | +9% [+3%, +13%] | 148 accounts ★★★ |
Three things stand out. Warm people open more. A message that arrives after someone has visited your site or engaged with your ads gets opened 18-21% more often, in 44 of 49 accounts. An uploaded list of target accounts does not, it opens exactly like cold, because a list is a set of people you would like to be warm, not people who are. The single message opens more than the chat. Conversation ads lost on opens in 43 of the 53 accounts running both; the button UI is a heavier thing to open. (They win it back on form completion, +21%, so cost per lead is a tie, see conversation ads vs message ads.) Bidding more buys no opens at all. The highest-bid campaign in an account pays 80% more per send for the identical open rate, which is why we now bid low.
Open rate by region
| Region | Campaigns | Open rate | Cost per send | Cost per lead |
|---|---|---|---|---|
| US | 686 | 37.4% | $0.52 | $351 |
| UK | 81 | 42.8% | $0.63 | $188 |
| EU | 229 | 46.4% | $0.23 | $111 |
| Mixed or none | 592 | 43.5% | $0.40 | $158 |
Cross-panel campaign medians, so directional. The US inbox is the most contested and opens worst; continental Europe opens best and is the cheapest send on the platform. If your account is US-only, a 38% open rate is normal, not a problem. Split campaigns by region if you sell into more than one.
Open rate does not fatigue
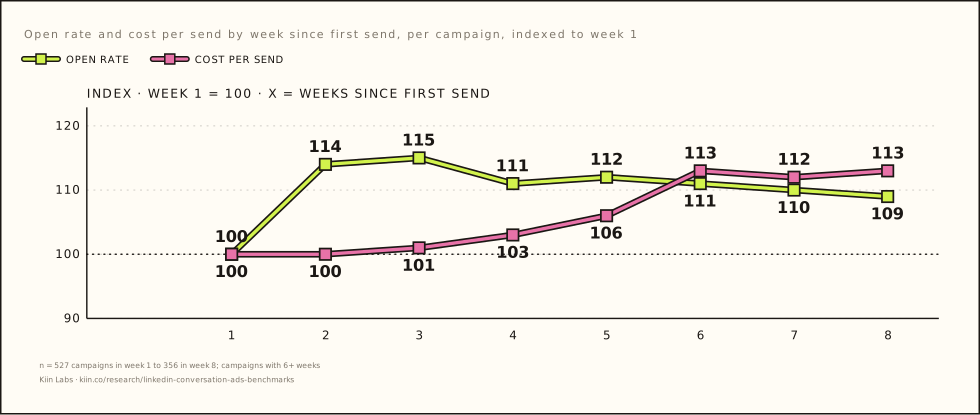
Indexed to each campaign's first week, open rate by week since launch reads 100, 114, 115, 111, 112, 111, 110, 109 through week eight. It holds. Don't read the week-two bump as a rise, opens are dated when they happen, so some week-one sends are opened in week two and week one reads low, but the flat line from week two onward is real. Nobody sees the same sponsored message twice in a month, so the mechanism that fatigues feed ads does not exist here. Pressure does not hurt either: campaigns past two sends per audience member index at 108 on open rate against their first band. What does creep is cost per send, up 13% by week six, that, not open rate, is the refresh trigger.
Weekend open rates read low — and it is partly an artefact
Within campaign, open rate by day reads Monday 109, Tuesday 105, Wednesday 102, Thursday 100, Friday 99, Saturday 88, Sunday 93. That looks like "weekends are bad". It mostly isn't: opens are recorded on the day they happen, not the day the message was sent, so part of the Saturday dip is Friday sends being opened on Monday. The measure that cannot lag is leads per send by day of send, and that is flat at 0.16-0.17% every day of the week, with cost per lead within ±8% of the weekly mean. Don't pause weekends on the strength of the open-rate curve; the day-of-week chapter has both series side by side.
How to read your own open rate
- Under 37%: a targeting or region problem. Check the audience is not a stale uploaded list, check whether it is US-only cold, and check whether weekend sends opening on Monday are dragging the reading before you change anything.
- 37–49%: normal. Stop looking at it. Track cost per send and form opens per open weekly instead — together they are 93% of the price of a lead.
- Over 49%: good, and usually a sign the audience is warm. If cost per lead is still high, the message is not earning the click into the form (the 38% lever) or the form is too long (completion under 30%).
What a good conversation ad cost per lead looks like, and the settings that decide whether you land at $32 or $1,000, is in the full LinkedIn Conversation Ads Benchmarks 2026. The wider set of LinkedIn benchmarks by format is on the benchmarks reference page.