
LinkedIn counts sends and opens of Sponsored Messaging ads as separate metrics (LinkedIn Marketing API reporting schema (Microsoft Learn)); open rate here is opens divided by sends. For context on why most of a market will not respond to any ad this quarter: LinkedIn's B2B Institute estimates 95% of potential buyers are not ready to buy today (The 95-5 Rule, LinkedIn B2B Institute).
The largest independent dataset on LinkedIn sponsored messaging we know of. Every comparison between two settings is the same advertiser running both, paired within account.
Ilic, P. (2026). LinkedIn Conversation Ads Benchmarks 2026. Kiin Labs. kiin.co/research/linkedin-conversation-ads-benchmarks. Figures are per-account medians and paired within-account comparisons, USD, twelve months to September 2026.
This study comes from Kiin Intelligence, the analytics layer behind Kiin, a London LinkedIn Ads agency with three ex-LinkedIn Marketing Solutions staff and 200+ B2B accounts under management.
See where your account sits. We'll benchmark your conversation ads against the 1,000+ accounts connected to Kiin Intelligence, every table in this report, with your numbers in it.Free. Read-only access. Takes us about an hour; we audit accounts every week.
- ▶Why I changed my mind on conversation ads
- ▶The six things to take away
- ▶How Kiin runs conversation ads now
- 00The dataset and how to read the numbers
- 01The 2026 benchmarks
- 02Why the spread is 32×: what makes a cheap lead cheap
- 03Conversation ad vs message ad
- 04Objective
- 05Audience: retargeting vs cold vs uploaded lists
- 06Audience size
- 07Seniority filters
- 08Region: US, UK, Europe
- 09Lead gen form vs landing page vs calendar
- 10Bidding: why we bid low now
- 11Sends per member: pressure is your friend
- 12Fatigue, and why it runs backwards
- 13Day of week and month of year
- 14Conversation ads vs single-image lead gen forms
- 15Conversation ads vs sponsored content for traffic
- 16The no-form version: calendars and cost per booking
- 17The accounts that got nothing
- 18The Kiin playbook
- 19Troubleshooting
- 20Sixteen numbers to quote
- —Glossary
- —Method and what we can't answer
- —Questions this report answers
Why I changed my mind on conversation ads
I have been running LinkedIn ads for seven years, across more than 200 accounts, at budgets from $5,000 a month to $100,000 a month. For most of that time I told clients to leave conversation ads alone. The format had a reputation: expensive sends, a message nobody asked for, leads that never showed up to the call.
Then I started testing them properly, with a retargeting pool behind them and a lead form attached, and they became the most reliable lead source in several accounts I manage. One account produced 33 leads at $154 each on $5,000. A retargeting campaign in another runs at $59 a lead. A third account has been doing 60-plus leads a month at under $400 a lead for the better part of a year, month after month, with no drama. One of them landed a Fortune 500 logo as a lead in the first week the campaign was live, at around $150.
That experience is a handful of accounts, though, and I wanted to know whether it generalised. So we pulled every conversation ad and message ad running through Kiin Intelligence over the last twelve months and asked one question: what separates the accounts paying $32 a lead from the ones paying $1,000 on exactly the same format?
This is the answer. It is long because the answer is not one thing. It is five or six settings, each of which moves the price by 20 to 80%, and they compound.
The six things to take away
Per-account medians and paired within-account comparisons. Each links to the chapter it rests on.
How Kiin runs conversation ads now
The findings are what the data says. These are the decisions we took from it, the operating rules on every account we run. Each links to the chapter it rests on; the full playbook is in chapter 18.
Where it sits
Bottom of a full funnel, aimed at the retargeting pool that thought leader ads and video have built. Cold conversation ads are a separate campaign with a separate target, on a big audience, judged on cost per send and volume rather than lead rate.
The evidence →Format
Message ad or conversation ad: inside the same account they are a tie on cost per lead. Conversation ads open 20% less and complete the form 21% more. We pick by the offer, buttons when the lead needs sorting, a single message when it does not, and do not expect the choice to move the price.
The evidence →Objective and form
Lead generation objective with the native form, three fields, four at most. The no-form calendar version only for a meeting offer with a fast sales team and a retargeting audience.
The evidence →Bid
LinkedIn's minimum, not its recommendation. Raise only if sends have not flowed after 48 hours, by the smallest increment that gets them moving. Review cost per send weekly. This is a reversal of what we said for years.
The evidence →Audience size
No cold conversation ad on fewer than 15,000 people; 50,000 is better. Big audiences cost 24% less per send in the same account. Widen the audience before raising the bid.
The evidence →Schedule
Continuously, seven days. Leads per send are flat across the week; weekend opens read lower mostly because opens lag sends. The 30-day cap paces it. Which weekday is cheapest is an account-level question.
The evidence →Refresh
When cost per send is 15% above launch, not when open rate drops. It will not drop, open rate holds from week one onward.
The evidence →Measurement
Cost per send and form opens per open are the two numbers that explain cost per lead; we track them per campaign, weekly. Open rate is a hygiene check: under 37% means the audience or the region is wrong. Then leads into the CRM with the campaign name attached, and stage two and three, not the lead count.
The evidence →
How to read the numbers in this report
1,588 campaigns, 263 accounts, $7.72M, 37,562 leads. Per-account medians, and every comparison paired within account.
1,588 LinkedIn message and conversation ad campaigns. 263 advertiser accounts. $7.72M of spend. 37,562 leads. Twelve months to September 2026. Every campaign has at least 500 sends and $100 of spend, so test campaigns that never really ran are out.
Benchmarks are per-account medians across the 242 accounts with 1,000 or more sends. Per-account, so one advertiser spending $500,000 counts once, the same as one spending $2,000. Medians, so the outliers do not drag the number.
Then we did the thing benchmark reports skip. Across the panel, message ads look three times cheaper per lead than conversation ads. Inside the same account they are a tie. The difference is who runs which. So every comparison here is the same advertiser running both sides in the same window. That is the part that matters: a benchmark that ignores it is measuring the advertisers, not the setting. Where I give a cross-panel number I say so, and I treat it as directional.
Brackets are 95% bootstrap confidence intervals. "ns" means the interval includes zero: the direction is probably real but we cannot call it. ★★★ means paired within account across 100 or more advertisers; ★★ means 25 to 100; ★ is directional. The panel is mostly B2B technology, mostly US and Europe, mostly lead gen forms attached. If that is you, these numbers are yours.
The 2026 benchmarks: open rate, lead rate, form completion, cost per send, cost per lead
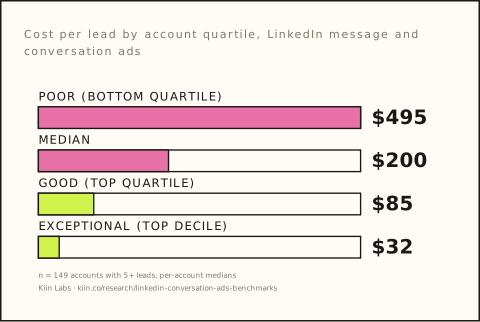
Median cost per lead is $200. Median open rate 42.6%. The open rate range is narrow; the cost per lead range is 32×.
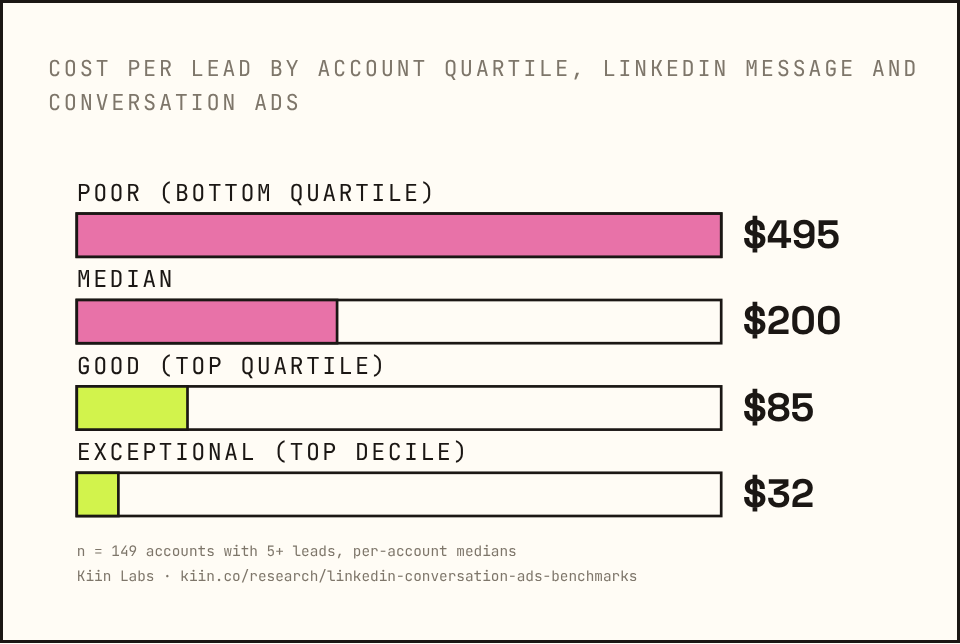
Median cost per lead is $200. The spread is 32×: $32 at the 10th percentile, $1,005 at the 90th.
| Metric | Poor (bottom quartile) | Median | Good (top quartile) | Exceptional (top decile) |
|---|---|---|---|---|
| Open rate | 37.2% | 42.6% | 48.8% | 53.9% |
| Lead rate (leads per send) | 0.00% | 0.09% | 0.22% | 0.52% |
| Form completion (submits per form open) | 29% | 41% | 53% | 69% |
| Cost per send | $0.69 | $0.42 | $0.23 | $0.11 |
| Cost per lead | $495 | $200 | $85 | $32 |
Per-account medians, 242 accounts with 1,000+ sends. Form completion on 145 accounts with a form; cost per lead on the 149 accounts with five or more leads. Report No. 5 lists conversation ads at $338 per lead with a 40.7% open rate and message ads at a 49.3% open rate because it takes each format's own account median, where this table combines both formats in each account and the format table in chapter 03 uses campaign medians ($347, 38.1%, 45.4%).
Three things to take from the table.
The open rate range is narrow. Poor is 37%, exceptional is 54%. That is a 1.5× spread on a metric people obsess over. Almost everyone opens a LinkedIn message, because it arrives as a notification and sits in the inbox. Open rate is a hygiene check, not a lever, the standalone benchmarks are in what is a good open rate for conversation ads.
The lead rate range is enormous. The median account converts 0.09% of sends to a lead: nine leads per 10,000 messages. The top decile converts 0.52%, nearly six times as many. And the bottom quartile converts nobody, which we come back to in chapter 17.
Cost per lead spreads 32 times from the 10th percentile ($32) to the 90th ($1,005). Nothing else in LinkedIn ads spreads that wide. It is why the format has such a split reputation: everyone who tried it landed somewhere in that range and concluded the format is whatever they happened to get.
The funnel per 1,000 sends, pooled: 427 open → 4.1 open the form → 1.6 submit. Once the form is open, 41% complete it. Only about 1% of openers ever get there.
The rest of this report is about where in that range you land, and why.
Why the spread is 32×: cost per send and whether openers click into the form
Two levers explain 93% of cost per lead. Open rate is not one of them.
Open rate explains 2% of cost per lead. Cost per send explains 55%; whether openers click into the form, 38%; form completion, 13%.
Cost per lead is cost per send divided by lead rate. Lead rate is open rate times form opens per open times form completion. So we decomposed cost per lead into its four parts across the 143 accounts with a form and five or more leads, and asked how much of the variance each part explains.
| Component | Share of variance in cost per lead |
|---|---|
| Cost per send | 55% |
| Form opens per open (does the message earn a click) | 38% |
| Form completion | 13% |
| Open rate | 2% |
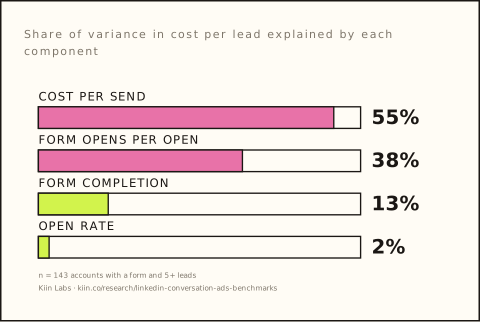
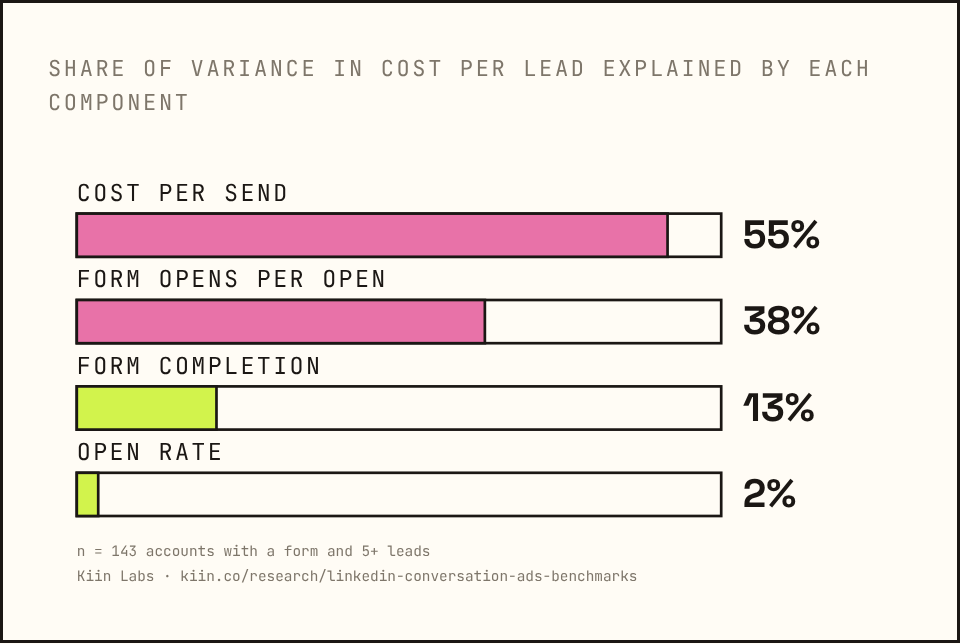
This is the single most useful thing in the data, because it is the opposite of where most optimisation time goes. People rewrite subject lines to lift opens from 41% to 44%. Meanwhile the account next door pays a seventh per send and gets three and a half times the form opens per open, and that is the whole gap.
Here is what that looks like in practice. The cheapest quarter of accounts against the most expensive quarter, per 1,000 sends:
| Per 1,000 sends | Cheapest 25% of accounts | Most expensive 25% |
|---|---|---|
| Cost per send | $0.098 | $0.660 |
| Opens | 499 | 393 |
| Form opens | 9.8 | 2.2 |
| Submits | 3.9 | 0.8 |
| Leads | 4.0 | 0.8 |
| Form opens per 100 opens | 1.97 | 0.57 |
| Form completion | 40% | 37% |
| Cost per lead | $24 | $784 |
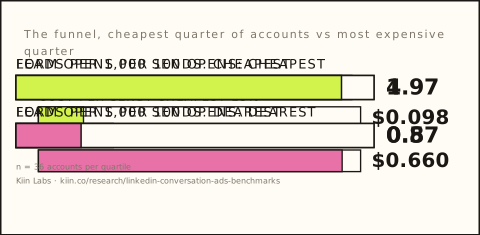
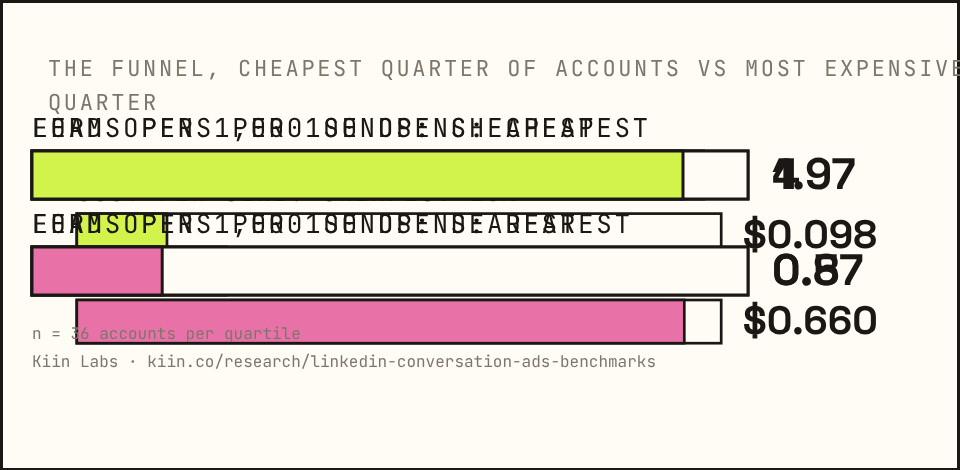
Same format. Same platform. Same year. The cheap accounts pay a seventh of the price for each send and get three and a half times as many form opens out of each open. Form completion is almost identical, 40% against 37%. The difference is entirely what they pay to arrive and whether the message earns the click.
What sets those two things? Correlations with account cost per lead, from most to least:
| Setting | Correlation with cost per lead |
|---|---|
| Cost per send | +0.63 |
| Lead rate | −0.65 |
| Leads per open | −0.60 |
| Bid per send | +0.58 |
| Spend | +0.48 |
| Open rate | −0.41 |
| Share of spend on uploaded lists | +0.37 |
| Share of spend on conversation ads (vs message ads) | +0.36 |
| Share of spend on cold audiences | −0.36 |
| Sends per audience member | +0.24 |
| Audience size | −0.19 |
| Form completion | −0.14 |
| Senior-only targeting | −0.03 |
And the ten cheapest accounts against the ten most expensive:
| Cheapest 10 | Most expensive 10 | |
|---|---|---|
| Cost per lead | $13 | $1,776 |
| Cost per send | $0.107 | $1.192 |
| Bid per send | $0.35 | $1.03 |
| Open rate | 51.5% | 39.6% |
| Lead rate | 0.79% | 0.06% |
| Audience size | 97,000 | 17,000 |
| Cold share of spend | 98% | 26% |
| Uploaded list share | 0% | 31% |
| Conversation ad share (vs message ad) | 0% | 100% |
| Lead form share | 100% | 95% |
The expensive accounts bid three times as much, on audiences a fifth the size, mostly uploaded lists, all in the conversation format. The cheap accounts bid low, on big cold audiences, in the single-message format, with a form. Every chapter below takes one of those settings and checks it inside the same account, because "the cheap accounts do X" is not proof that X makes you cheap, and on format, the paired test says it is not.
Two numbers a week: cost per send and form opens per open. Between them they are 93% of the price of a lead. If either is moving, we know before the cost per lead does. Open rate under 37% is a targeting or region problem; above that we stop looking at it. The cost side on its own, by bid, audience size, region and format, is LinkedIn InMail ads cost.
Conversation ad vs message ad: a tie inside the same account
Cross-panel, message ads look three times cheaper per lead. Paired within 53 accounts, cost per lead is a tie. Conversation ads open 20% less and complete the form 21% more.
Inside the same account, conversation ads and message ads are a tie on cost per lead. Conversation ads open 20% less; the people who reach the form complete it 21% more.
LinkedIn sells two sponsored messaging formats. A message ad is a single message with one call-to-action button. A conversation ad is the multi-step chat: a message, two or more buttons, and a branch for each.
Cross-panel, campaign medians:
| Campaigns | Accounts | Spend | Open rate | Lead rate | Cost per send | Cost per lead | |
|---|---|---|---|---|---|---|---|
| Conversation ad | 888 | 176 | $5.59M | 38.1% | 0.06% | $0.51 | $347 |
| Message ad | 700 | 142 | $2.13M | 45.4% | 0.11% | $0.31 | $111 |
Three times the cost per lead. But 72% of the spend is on conversation ads, and the people spending it are the bigger, list-heavy, higher-bid accounts. So we looked inside the 53 accounts running both.
| Conversation ad vs message ad, same account, n=53 | Ratio | 95% CI | Conversation better in |
|---|---|---|---|
| Cost per lead | +36% | [−16%, +158%] | 8 of 24 |
| Lead rate | −17% | [−51%, +43%] | 11 of 28 |
| Open rate | −20% | [−25%, −14%] | 10 of 53 |
| Cost per send | −15% | [−31%, +2%] | 33 of 53 |
| Cost per open | +4% | [−9%, +33%] | 24 of 53 |
| Form completion | +21% | [+2%, +34%] | 12 of 16 |
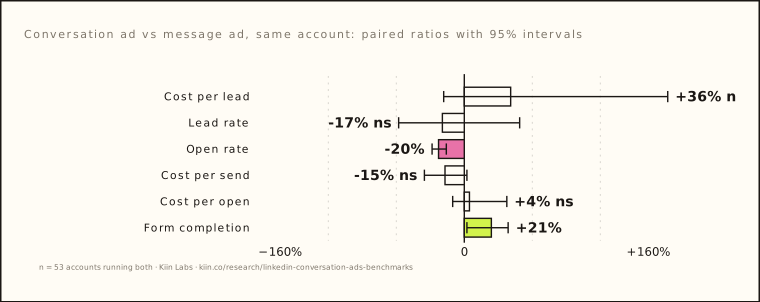
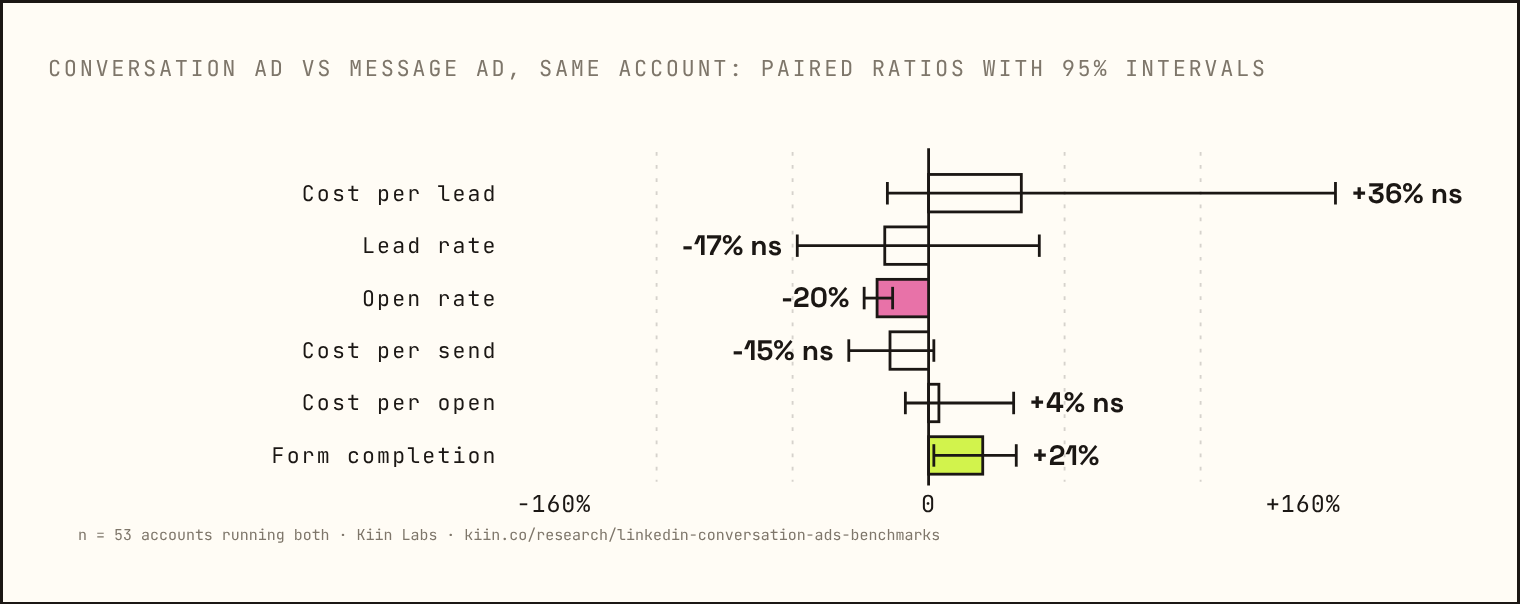
Cost per lead: a tie, with an interval too wide to call. Two things are not a tie. Conversation ads get 20% fewer opens, in 43 of the 53 accounts. And when someone does reach the form, they complete it 21% more often.
Our reading: the conversation format adds friction before the form and removes it after. The chat UI with buttons is a heavier thing to open than a plain message, so fewer people do. But the people who click through a button or two have qualified themselves, so they finish the form. The two effects offset, and the price of a lead comes out the same.
Pick the format by the offer, not the price. Buttons when the lead needs sorting, two or three offers for one audience, or a sales team that wants the lead pre-qualified. A single message when the offer is one thing. We do not expect the choice to move cost per lead, and the data says it will not.
Lead generation, website conversions, website visits
The lead generation objective is 81% of spend and the only one that records a LinkedIn lead.
| Objective | Campaigns | Accounts | Spend | Open rate | Lead rate | Cost per send | Cost per lead |
|---|---|---|---|---|---|---|---|
| Lead generation | 1,204 | 205 | $6.29M | 41.3% | 0.13% | $0.44 | $194 |
| Website conversions | 152 | 48 | $1.02M | 42.6% | 0.00% | $0.39 | none recorded |
| Website visits | 206 | 67 | $0.36M | 39.1% | 0.00% | $0.32 | none recorded |
The lead generation objective is 81% of spend and the only one that records a LinkedIn lead, because it is the only one that attaches the native form. The website objectives send people to a page, and their results live in your analytics, not in Campaign Manager, so their "lead rate" reads zero here. Chapter 16 covers them properly.
Cost per send is lowest on the website visits objective ($0.32) and highest on lead generation ($0.44). Some of that is the bid, some is who runs each. Do not pick the objective on cost per send; pick it on where you want the lead to land.
Retargeting vs cold vs uploaded lists: the strongest result in the data
Retargeting gets 71% more leads per send and 18% more opens than cold inside the same account, and is 36% cheaper per lead than a list. Its cost per lead advantage over cold (−18%) is directional. A list performs like cold and costs 21% more per send.
Retargeting: +71% lead rate and +18% opens vs cold; −36% per lead vs an uploaded list; −18% per lead vs cold, directional; same cost per send. A list is cold that costs more.
Three audience types. Cold is attribute targeting: title, function, industry, company size, no list. Uploaded list is a company or contact list matched to LinkedIn. Retargeting is website visitors, video viewers and people who engaged with your ads.
Cross-panel, campaign medians, lead gen form campaigns:
| Audience | Campaigns | Accounts | Spend | Open rate | Lead rate | Cost per send | Cost per lead |
|---|---|---|---|---|---|---|---|
| Cold | 512 | 108 | $2.30M | 43.7% | 0.15% | $0.33 | $126 |
| Uploaded list | 372 | 93 | $2.86M | 38.1% | 0.11% | $0.61 | $340 |
| Retargeting | 206 | 114 | $0.88M | 47.6% | 0.14% | $0.47 | $213 |
Now paired, the same account running both:
| Same account, running both | Cost per lead | Lead rate | Open rate | Cost per send |
|---|---|---|---|---|
| Retargeting vs cold (n=49; 37 on cost per lead) | −18% [−38%, +9%] · directional† | +71% [+15%, +116%] | +18% [+11%, +26%] | +6% (ns) |
| Retargeting vs uploaded list (n=49; 32 on cost per lead) | −36% [−49%, −11%] | +52% [+19%, +72%] | +21% [+14%, +35%] | −10% (ns) |
| Uploaded list vs cold (n=35; 27 on cost per lead) | +18% (ns) | −9% (ns) | +1% | +21% [+4%, +44%] |
† Re-run on the frozen, deduplicated 15 Sep 2026 snapshot (the one Report No. 3 is built on): retargeting vs cold cost per lead is −18% [−38%, +9%], n = 37, so the interval spans zero and the cost per lead gap vs cold is directional, not starred. On demo-request forms specifically, Report No. 4 finds the same direction (retargeting vs cold in the inbox −11% to −20%, directional); the two are cited each for its own scope and never averaged. Report No. 5 reports −27% [−41%, −11%] on a different account set, 46 accounts paired on the same objective, against the 37 here with $200 and 500 sends on each side. The lead rate and open rate results, and the −36% vs a list, hold on the re-run. Updated 15 Sep 2026.
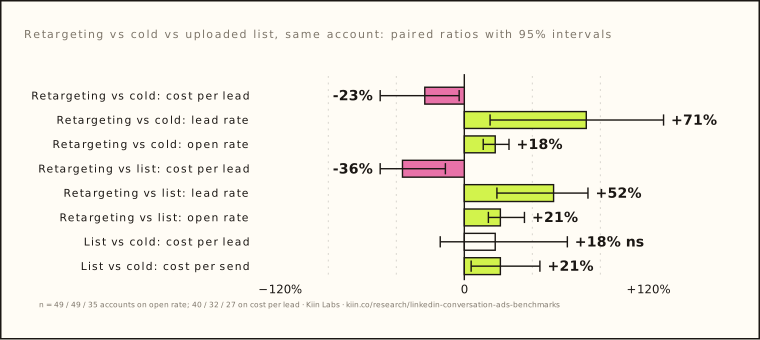
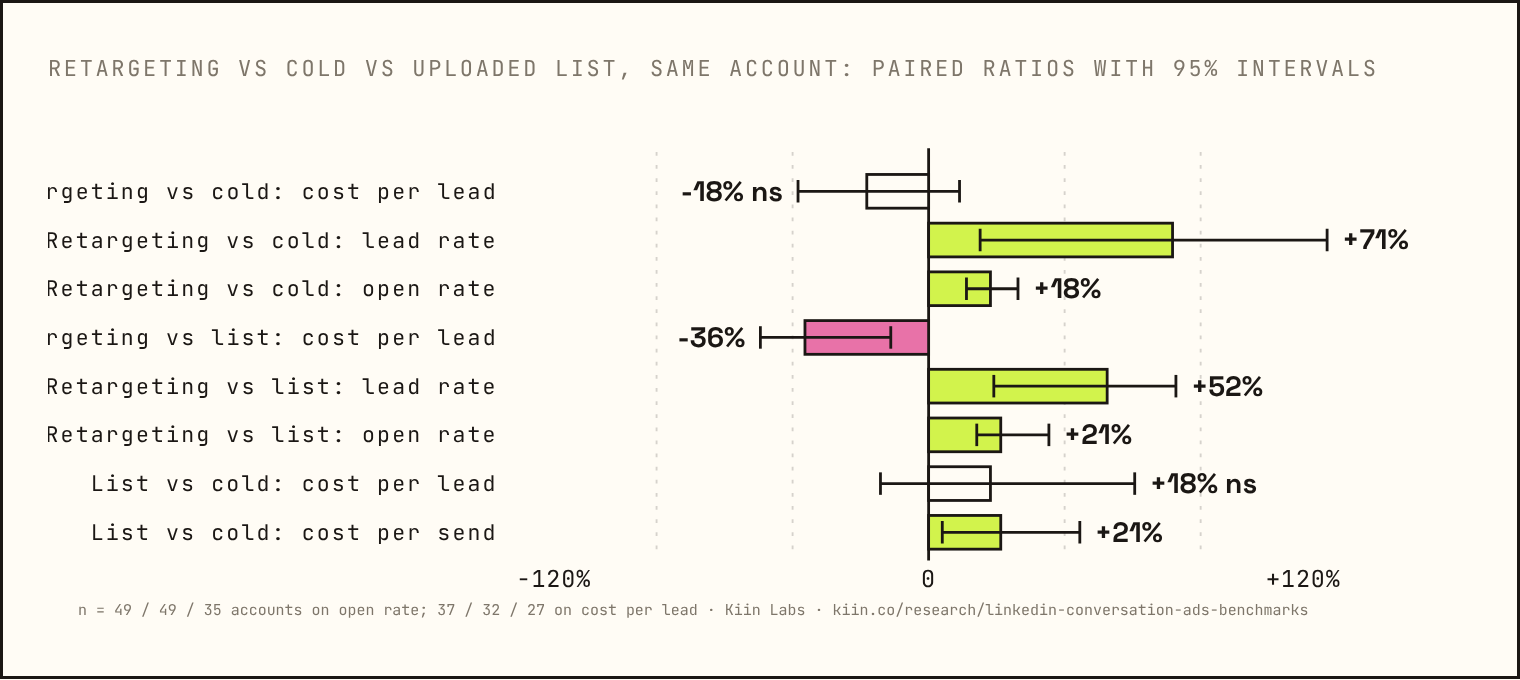
Retargeting wins on every response metric against both alternatives. A message that arrives after someone has already seen you, on your site or in their feed, gets opened 18 to 21% more often, converts 50 to 70% better per send, and costs less per lead: 36% less than a list, and a directional 18% less than cold. Open rate was higher for retargeting in 44 of 49 accounts against cold and 43 of 49 against lists.
The uploaded list result is the one that surprises clients. Most advertisers treat their target account list as the warmest audience they have. In the data it performs like cold traffic, slightly worse on lead rate, with a 21% higher cost per send that is significant. A list is not warm. A list is a set of people you would like to be warm. The message ad does not know the difference and neither do they.
This is why in every full-funnel account we run, the conversation ad sits at the bottom, aimed at the retargeting pool the thought leader ads, video views and single-image campaigns above it have built. The $59 lead in the foreword is a retargeting campaign. When a client comes to us with only a list and a message ad and asks why it costs $340 a lead, this table is the answer.
Cold can work. The ten cheapest accounts in the panel are 98% cold. But look at how they win: on cost per send ($0.107) and audience size (97,000), not on response. Cold conversation ads are a volume play on cheap sends. Retargeting conversation ads are a response play on warm people. They are different campaigns and should have different targets.
Build the pool first. If you do not have a retargeting audience of a few thousand people, thought leader ads and video build it; then the messages go on. That sequence is the whole structure of a Kiin-run LinkedIn Ads account. A target account list goes in as a cold campaign with a cold target, never as "retargeting". How the retargeting layer is built is in LinkedIn retargeting for B2B; this chapter as a standalone page is retargeting vs cold vs uploaded lists.
Cost per send halves from the smallest audiences to the largest
Big audiences (50,000+) cost 24% less per send than small ones (under 15,000) in the same account. Do not run cold conversation ads on fewer than 15,000 people.
| Target audience | Campaigns | Open rate | Lead rate | Cost per send | Cost per lead |
|---|---|---|---|---|---|
| Under 5,000 | 282 | 44.5% | 0.06% | $0.58 | $190 |
| 5,000 to 15,000 | 222 | 41.2% | 0.08% | $0.49 | $224 |
| 15,000 to 50,000 | 324 | 42.6% | 0.10% | $0.43 | $168 |
| 50,000 to 150,000 | 241 | 41.8% | 0.10% | $0.33 | $183 |
| 150,000+ | 297 | 39.8% | 0.03% | $0.26 | $147 |
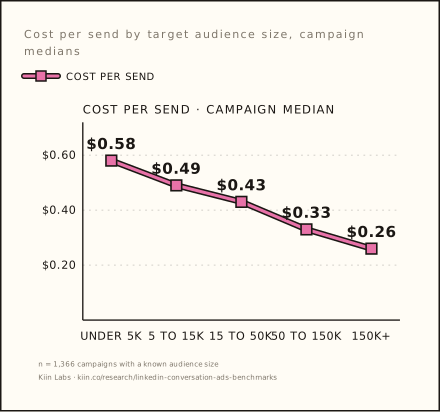
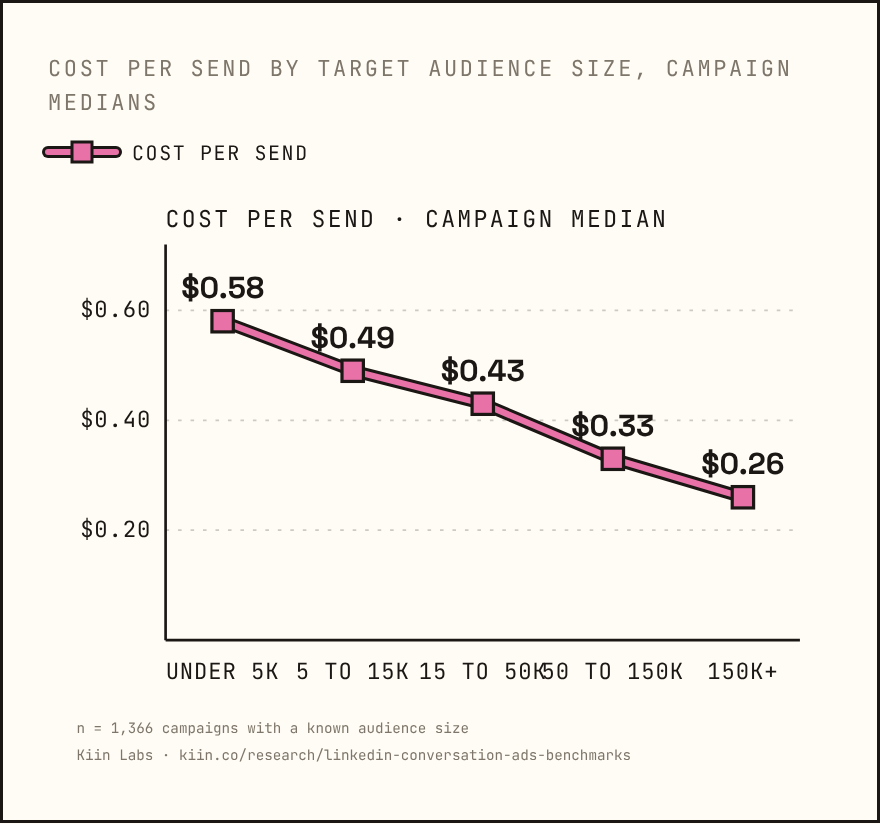
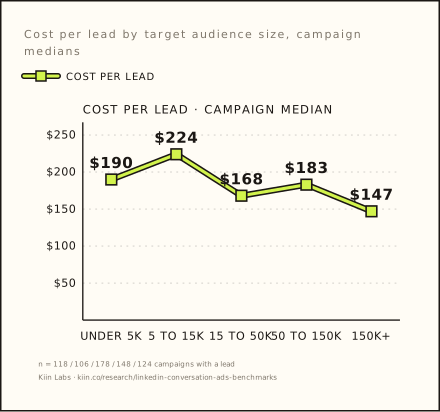
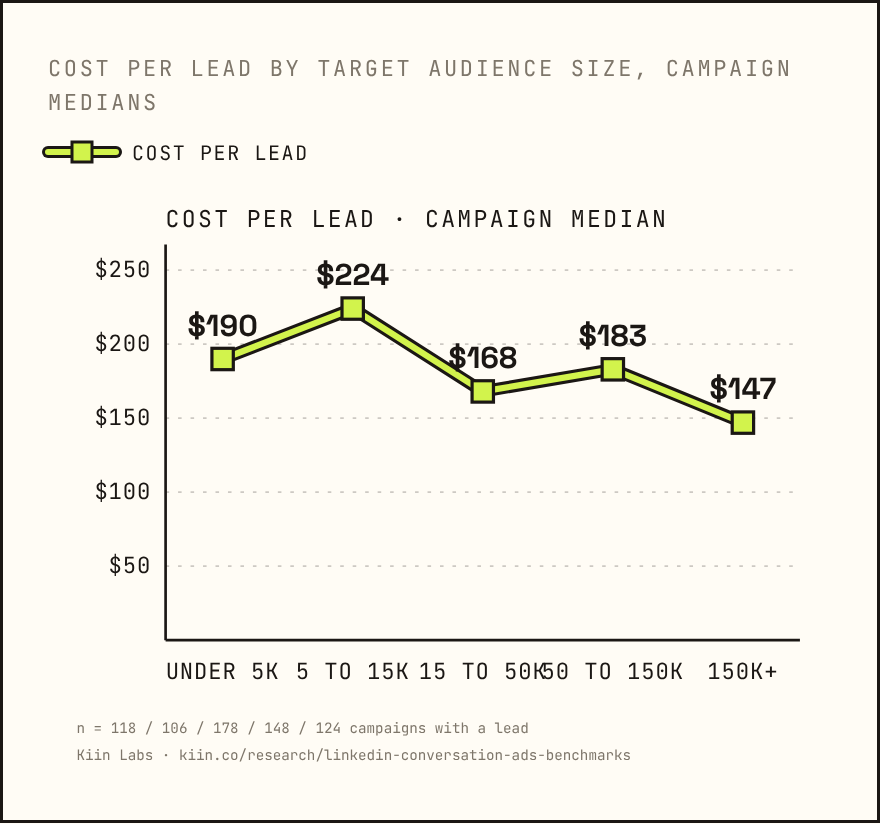
Cost per send halves from the smallest band to the largest, and the paired test confirms it: in the 68 accounts running both a big audience (50,000+) and a small one (under 15,000), the big audience cost 24% less per send [−38%, −14%], cheaper in 56 of 68. Part of that is the bid; those same pairs bid 18% less on the big audience. Part is the auction, which has more inventory to fill on a big audience and charges less to fill it.
Lead rate is flat across the middle bands and drops on the very largest, so cost per lead does not fall as fast as cost per send. The sweet spot in the cross-panel table is 15,000 to 50,000, and the very small audiences under 5,000 (which are mostly retargeting pools) are competitive despite the highest cost per send, because they respond.
No cold conversation ad on fewer than 15,000 people. Below that you are paying small-audience send prices without the retargeting response to justify them. If a campaign needs more spend, we widen the audience before we raise the bid. The CPM equivalent of this for feed ads is in LinkedIn CPM benchmarks.
Seniority filters: no cheaper, no better
Cross-panel, senior-only looks best. Paired, it does not hold: −5% opens, +27% per lead (ns), and no saving on cost per send.
| Seniority | Campaigns | Open rate | Lead rate | Cost per send | Cost per lead |
|---|---|---|---|---|---|
| Senior only (director and above) | 210 | 41.9% | 0.11% | $0.29 | $138 |
| Includes manager or IC | 329 | 39.5% | 0.05% | $0.35 | $258 |
| No seniority filter | 1,049 | 41.6% | 0.08% | $0.49 | $211 |
Cross-panel, senior-only looks best. Paired, it does not hold. In the 35 accounts running both senior-only and no-filter campaigns, senior-only cost 27% more per lead [−17%, +85%], with a 5% lower open rate that is significant and everything else inside the noise. Against campaigns that include managers and individual contributors (n=15), senior-only had a 26% higher cost per send and 51% higher cost per open, both significant, for a lead rate 29% higher that is not.
Senior people open slightly less, and the filter costs no less per send (+6% vs no filter, ns) and converts no better within the noise. Whether senior-only leads are worth enough more to the sales team to justify it depends on the account.
Filter by seniority when the sales team will reject a manager-level lead, and not otherwise. It costs no less and converts no better; it is a qualification choice, not a performance one.
US, UK, Europe: the US is the most contested inbox
Cross-panel: US $351 per lead, UK $188, EU $111. Europe is the cheapest send on the platform at $0.23.
| Region | Campaigns | Accounts | Spend | Open rate | Lead rate | Cost per send | Cost per lead |
|---|---|---|---|---|---|---|---|
| US | 686 | 142 | $4.51M | 37.4% | 0.03% | $0.52 | $351 |
| UK | 81 | 33 | $0.23M | 42.8% | 0.14% | $0.63 | $188 |
| EU | 229 | 56 | $0.45M | 46.4% | 0.14% | $0.23 | $111 |
| Mixed or none | 592 | 114 | $2.53M | 43.5% | 0.10% | $0.40 | $158 |
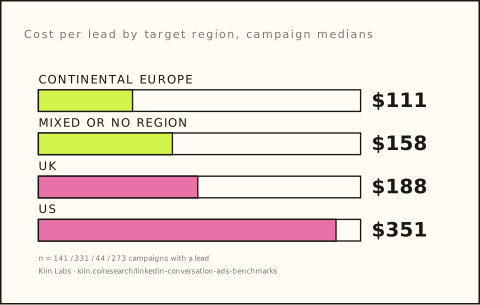
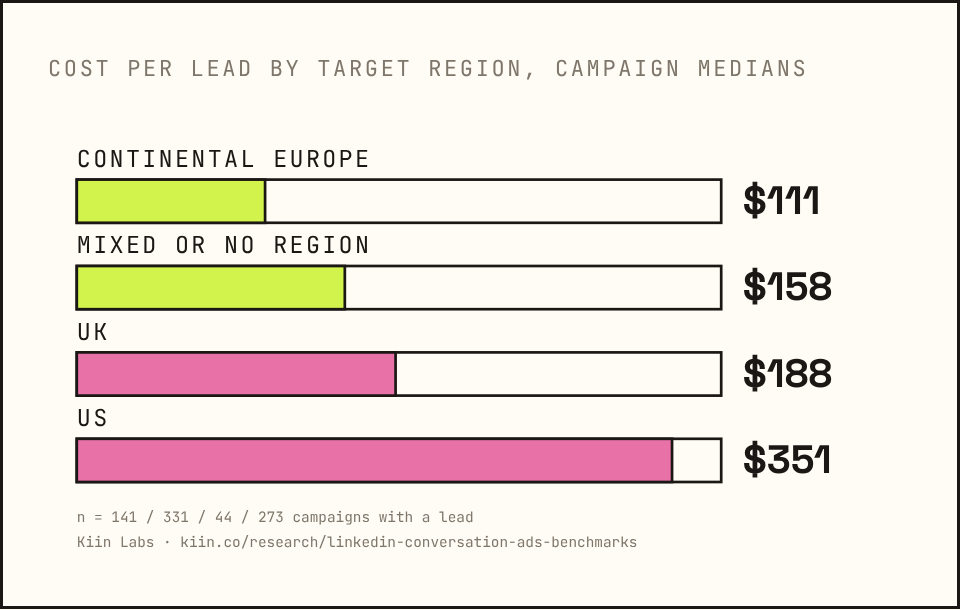
Cross-panel only; there are not enough accounts running the same offer in two regions to pair it (EU vs US within account, n=9: cost per send −23%, interval from −47% to +46%). But the pattern is consistent with everything else we see on LinkedIn: the US is the most contested inbox, with the lowest open rate, the lowest lead rate and three times the cost per lead of continental Europe. Europe is the cheapest send on the platform at $0.23. The UK opens well and pays a lot per send.
Split campaigns by region. If you sell in more than one of these, the US will eat a mixed budget at the worst price. UK figures in pounds are on LinkedIn Ads cost UK.
Lead gen form vs landing page vs calendar
Campaigns with a lead gen form cost 19% less per lead than campaigns sending to a landing page, same account. 41% of form opens submit; a landing page gets 5-9%.
Attach the form. 41% of people who open a LinkedIn lead form submit it; a landing page reached from a message ad converts 5% of clicks.
Attach the form. The mechanism is completion: 41% of people who open a LinkedIn lead form submit it. A landing page reached from a message ad converts 5% of clicks at the median account (chapter 16), and a single-image lead form in the feed completes at 5% (chapter 14). The paired cost-per-lead test points the same way, form campaigns 19% cheaper per lead, cheaper in 7 of 8 accounts, but only eight accounts ran both with leads on each side, so treat that number as directional ★.
Cross-panel, form campaigns run at $183 per lead against $252 without, and the no-form campaigns are 22% of spend for 3% of the leads, though that understates them because their conversions are recorded elsewhere. Chapter 16 covers the no-form version in full, including cost per booked meeting, because there is a real case for it.
Why we bid low now
For years the standard advice, including mine, was bid high. Paired in 119 accounts, the highest bid buys +80% per send, +44% per lead and +0% opens.
Bidding higher buys nothing. Highest-bid vs lowest-bid campaign in the same account: +80% per send, +44% per lead, +0% opens. The median campaign pays 62% of its bid.
For years the standard advice, including mine, was to bid as high as you can on conversation ads. The logic was real: LinkedIn lets each member receive one sponsored message every 30 days, so you bid to be the advertiser who wins that slot, and the auction charges you less than your bid anyway. I said it on video. I was wrong, or at least the platform has moved on, and the data is blunt about it.
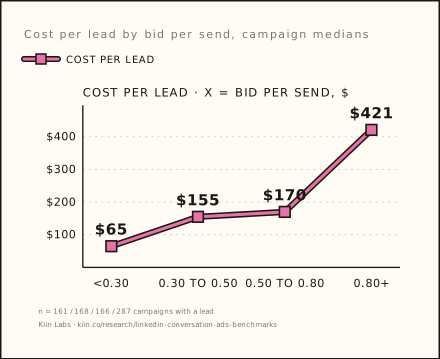
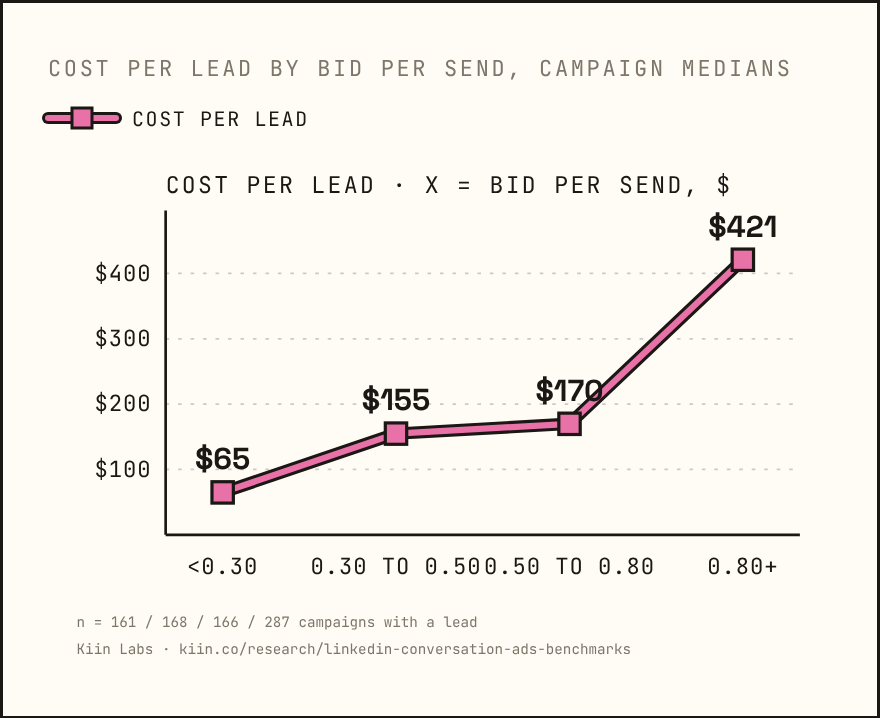
Cross-panel, by bid per send:
| Bid per send | Campaigns | Open rate | Lead rate | Cost per send | Cost per open | Cost per lead |
|---|---|---|---|---|---|---|
| Under $0.30 | 273 | 46.0% | 0.11% | $0.16 | $0.37 | $65 |
| $0.30 to $0.50 | 370 | 40.0% | 0.06% | $0.27 | $0.71 | $155 |
| $0.50 to $0.80 | 361 | 41.7% | 0.05% | $0.38 | $0.90 | $170 |
| $0.80+ | 568 | 39.5% | 0.08% | $0.72 | $1.86 | $421 |
Paired, each account's highest-bid campaign against its lowest, at least 1.5 times apart:
| Highest bid vs lowest bid, same account | Ratio | 95% CI | High bid better in |
|---|---|---|---|
| Bid itself | +192% | [+150%, +233%] | |
| Cost per send | +80% | [+56%, +110%] | 23 of 119 |
| Cost per open | +77% | [+47%, +108%] | 28 of 119 |
| Cost per lead | +44% | [+8%, +64%] | 21 of 64 |
| Open rate | 0% | [−3%, +4%] | 60 of 119 |
| Lead rate | +22% | [−14%, +62%] | 44 of 77 |
| Form completion | +1% | [−8%, +11%] | 23 of 46 |
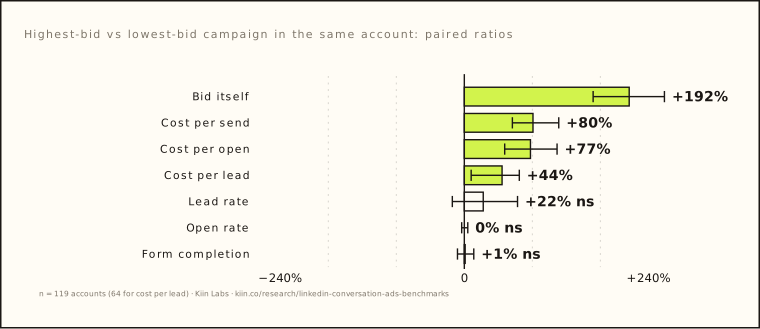
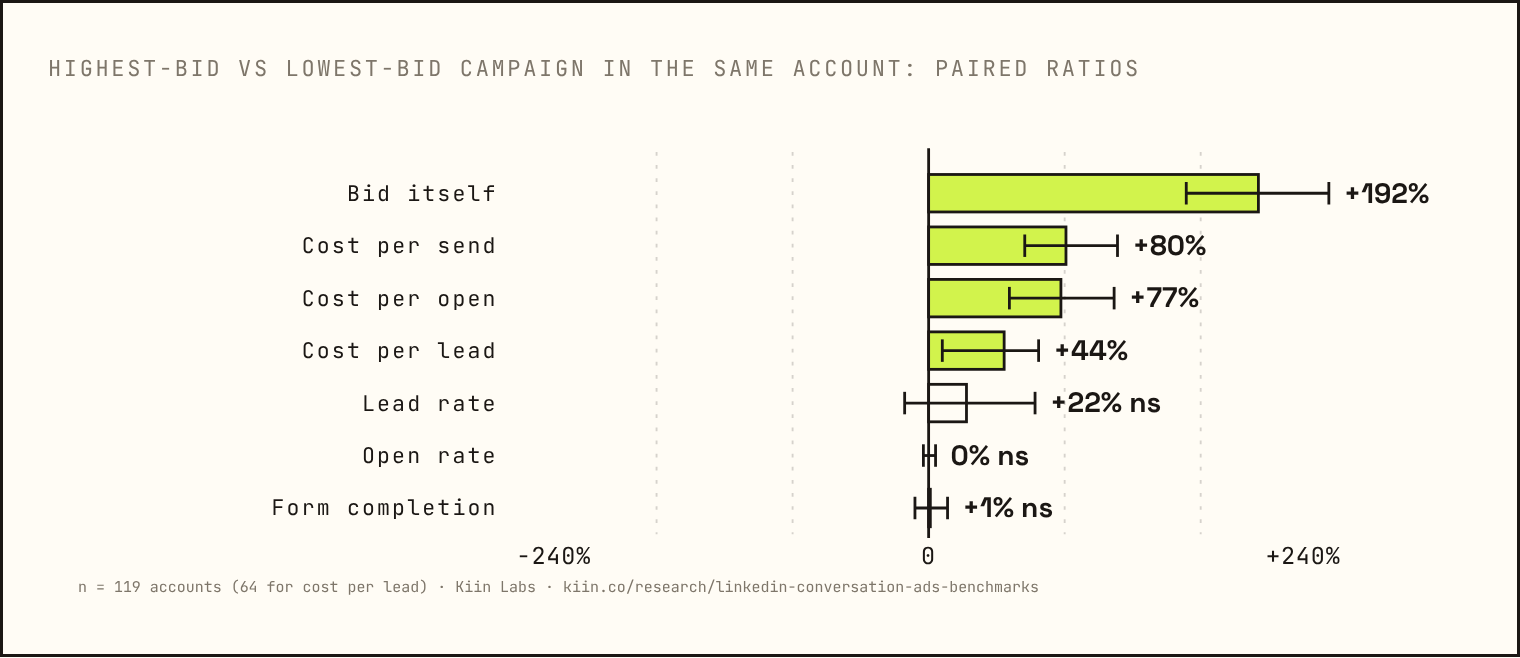
Tripling the bid buys an 80% higher cost per send, exactly the same open rate, and a 44% higher cost per lead. Within account, bid and cost per send correlate at +0.62, positive in 86% of the 86 accounts with enough campaigns to test. Bid alone explains 35% of the variance in cost per send across the panel. And cost per send is 55% of what decides your cost per lead. Every notch on the bid goes onto the lead price and nothing comes back.
The old argument was delivery: bid low and your sends will not go out. The data says the median campaign pays 62% of its bid, and the cheapest ten accounts by cost per lead bid $0.35 per send while the dearest ten bid $1.03. Low bids deliver.
What sets cost per send, for the record: your bid (r = +0.68, elasticity 0.53, bid +10% → cost per send +5.3%), audience size (big vs small, same account, −24%), and not much else. Retargeting vs cold +5% (ns), list vs cold +7% (ns), conversation vs message ad −15% (ns), seniority filter +6% (ns), month of year flat. Cost per send is the bid you type and the size of the audience. Not who is in it.
Start at LinkedIn's minimum bid, not its recommendation, which is always a multiple of the floor. Raise it only if sends are not flowing after 48 hours, and only until they do. Watch cost per send weekly; on a cold audience anything above $0.40 means you are paying a premium for the same inbox. On a retargeting pool the sends are dearer whatever you do (the median is $0.47), so judge it on cost per lead instead. The page that used to say the opposite is rewritten.
Pressure is your friend
Pressing harder on an audience gets a 78% higher lead rate and 9% higher open rate. The 30-day cap does the pacing.
Sends per audience member is total sends divided by audience size. It is the closest thing to a frequency setting on a format that caps itself at one message per member per 30 days.
| Sends per member | Campaigns | Open rate | Lead rate | Cost per send | Cost per lead |
|---|---|---|---|---|---|
| Under 0.25 | 803 | 40.8% | 0.05% | $0.34 | $130 |
| 0.25 to 0.5 | 205 | 42.1% | 0.11% | $0.51 | $216 |
| 0.5 to 1 | 164 | 43.8% | 0.09% | $0.48 | $251 |
| 1 to 2 | 113 | 42.2% | 0.09% | $0.49 | $291 |
| 2+ | 81 | 46.6% | 0.14% | $0.52 | $213 |
Paired, each account's highest-pressure campaign against its lowest, at least twice apart:
| Highest pressure vs lowest, same account | Ratio | 95% CI | High better in |
|---|---|---|---|
| Lead rate | +78% | [+45%, +113%] | 77 of 107 |
| Open rate | +9% | [+3%, +13%] | 98 of 148 |
| Cost per lead | −20% | [−37%, +9%] | 51 of 92 |
| Cost per send | +2% | [−5%, +11%] | 69 of 148 |
| Form completion | −1% | [−13%, +15%] | 34 of 69 |
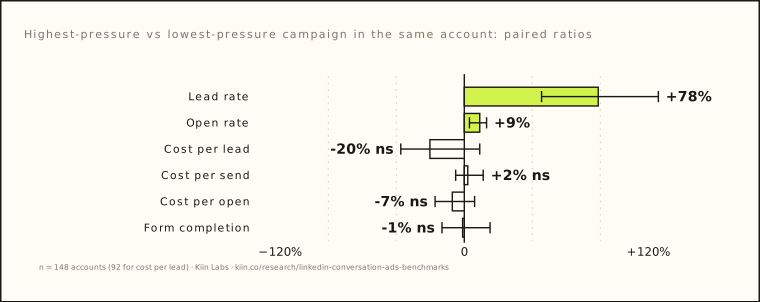
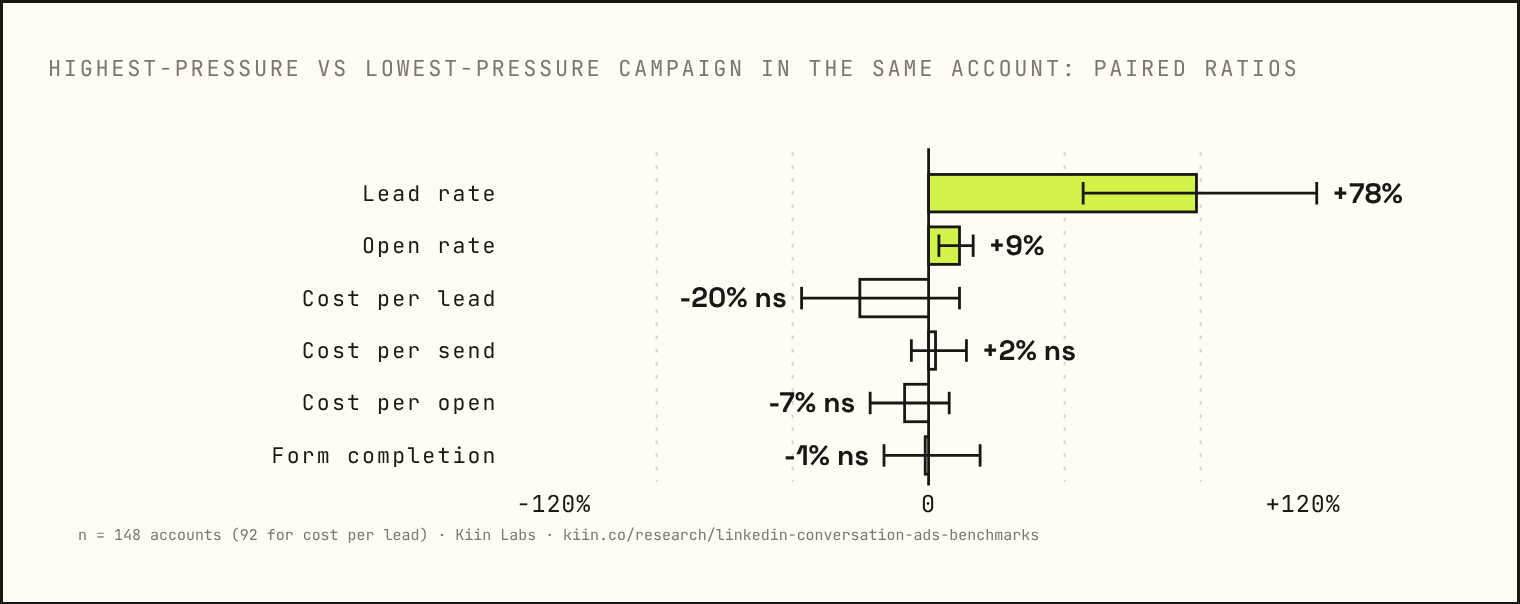
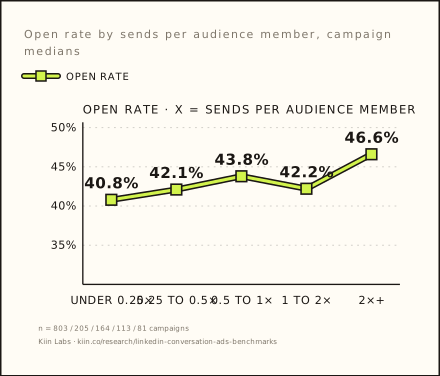
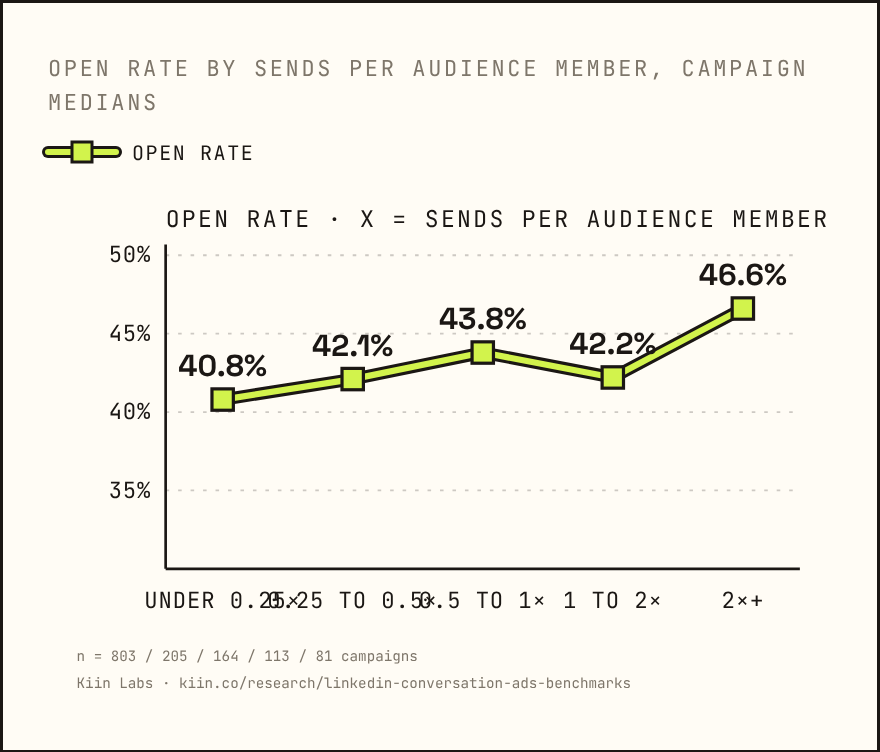
Pressing harder on an audience gets you a 78% higher lead rate and a 9% higher open rate, at no change in cost per send. The cost per lead reduction is 20% but the interval touches zero. Open rate does not fatigue with pressure at all: campaigns past two sends per member index at 108 on open rate against their first band.
One caveat on the lead-rate number. The highest-pressure campaign in an account is usually its retargeting pool, a small audience that gets sent to repeatedly, so pressure and audience type are entangled here, and some of the +78% is chapter 5 wearing a different hat. The open-rate result (no fatigue with pressure) is the clean part.
Set the audience, let the campaign run, and do not pause it because "everyone has seen it". They have not, and the ones who have will open the next one. The 30-day cap does the pacing. This is one of the weekly checks in how Kiin manages LinkedIn Ads accounts.
Fatigue, and why it runs backwards
Open rate holds for as long as we can see. What creeps is cost per send, 13% by week six.
Conversation ads do not fatigue on response. Open rate by week since launch holds at 109 to 115 against week one through week eight. Cost per send drifts up 13% by weeks six to eight.
| Week since first send | Open rate index | Cost per send index |
|---|---|---|
| 1 | 100 | 100 |
| 2 | 114 | 100 |
| 3 | 115 | 101 |
| 4 | 111 | 103 |
| 5 | 112 | 106 |
| 6 | 111 | 113 |
| 7 | 110 | 112 |
| 8 | 109 | 113 |
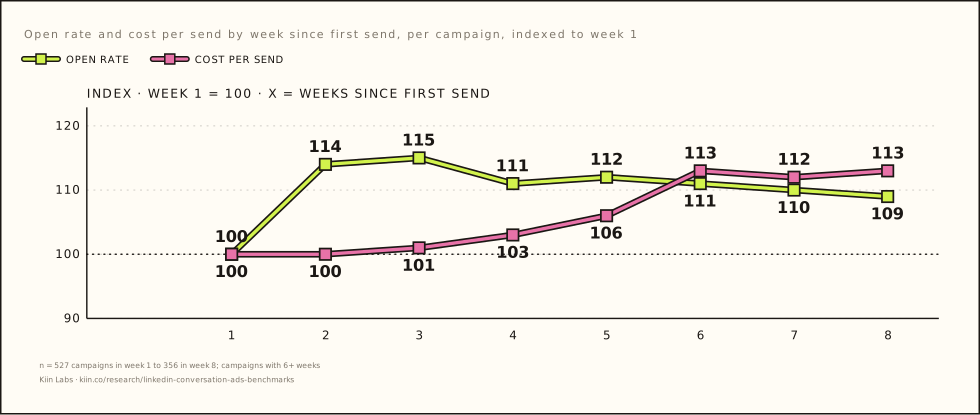
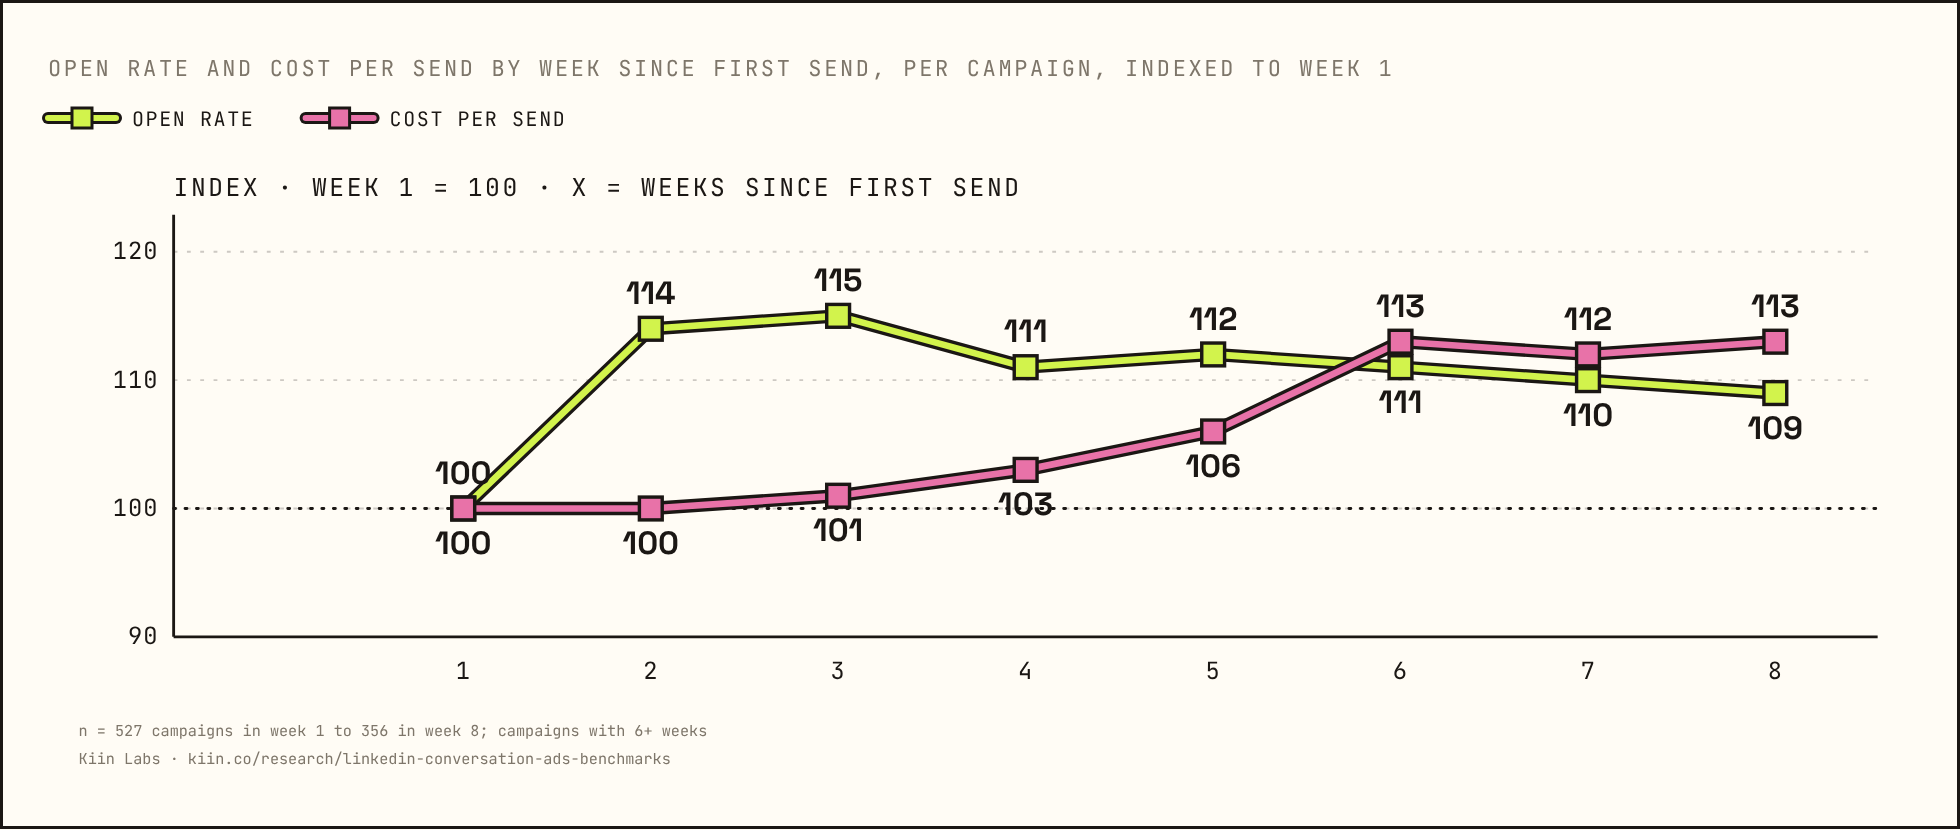
Open rate reads 109 to 115 against week one for every week we can see. Do not read the week-two bump as a rise: opens are dated when they happen, so some of week one's sends are opened in week two and week one reads low. The safe statement is that open rate holds. Conversation ads do not fatigue on response the way sponsored content does, because nobody sees the same one twice in a month. What creeps is cost per send, 13% by week six. That is the auction, not the audience.
The refresh trigger is cost per send, not open rate. If you wait for the open rate to fall you will wait forever. If cost per send is 15% above launch, swap the message or the audience. The feed-ad version of this, where fatigue is real and frequency-driven, is in LinkedIn ad frequency and fatigue.
Day of week and month of year: opens dip at the weekend, leads don't
Leads per send are flat across the week, 0.16-0.17% every day. Weekend opens read lower mostly because opens lag sends. No seasonality worth planning around.
Leads per send are flat across the week: 0.16-0.17% every day. Weekend opens read lower mostly because opens lag sends. Don't pause weekends.
On feed ads, thought leader ads and sponsored content, weekends are the best click days: Saturday and Sunday impressions cost 1-4% less, engage the same, and click through 9-10% better than weekdays. On message ads, weekend opens read lower, Saturday 88, Sunday 93 against a weekday of 100, but opens are dated when they happen, not when the message was sent, so part of that dip is Friday sends being opened on Monday. The measure that can't lag is leads per send by day of send, and that is flat: 0.16-0.17% every day of the week. Cost per lead sits within ±8% of the weekly mean (Tuesday $192, Saturday $223). Cost per send doesn't move by day at all; it's a bid.
| Day | Share of sends | Open rate index (by day recorded) | Leads per send (by day of send) | Cost per send index |
|---|---|---|---|---|
| Monday | 15.5% | 109 | 0.17% | 100 |
| Tuesday | 16.6% | 105 | 0.17% | 100 |
| Wednesday | 16.2% | 102 | 0.17% | 100 |
| Thursday | 15.7% | 100 | 0.17% | 100 |
| Friday | 14.4% | 99 | 0.16% | 100 |
| Saturday | 11.2% | 88 | 0.16% | 100 |
| Sunday | 10.4% | 93 | 0.17% | 100 |
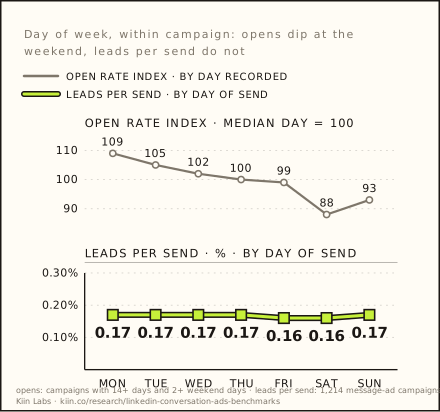
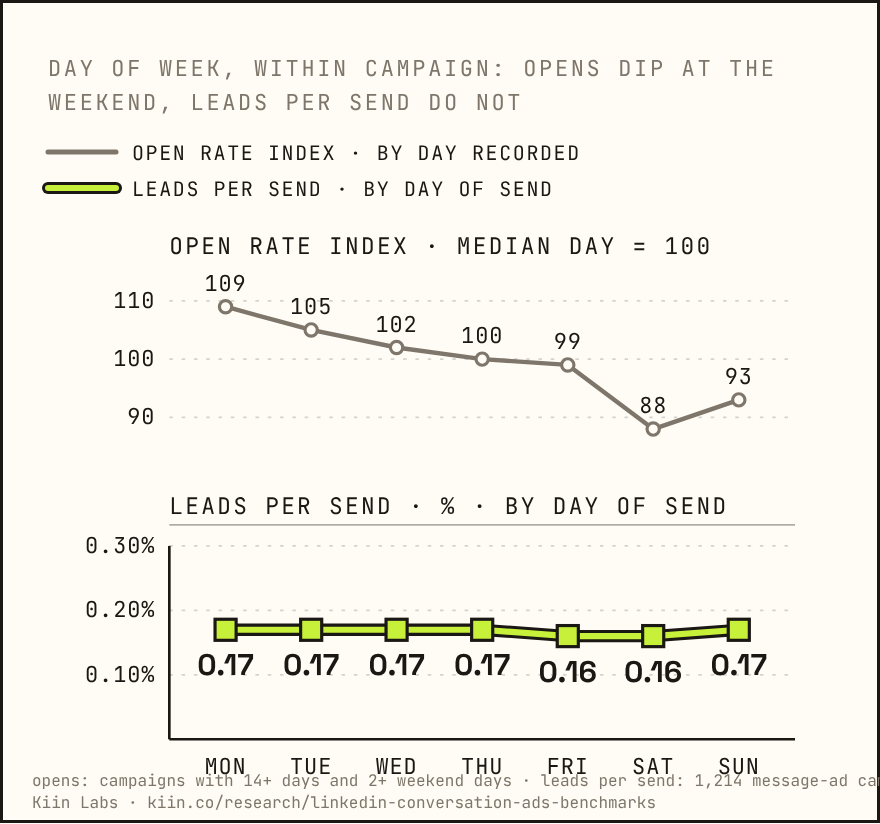
Don't daypart weekends on either format. Which weekday is cheapest is an account-level question: our own case studies found Sunday cheapest in one account (a North American, UK and UAE audience, Sunday is a working day in the UAE) and Saturday dearest in another (US SaaS). Test it in your own account by day of send, not day of lead.
Month of year, account-month against the account's own median month:
| Month | Accounts | Open rate index | Cost per send index | Cost per lead index |
|---|---|---|---|---|
| December | 63 | 99 | 100 | 96 |
| January | 89 | 100 | 100 | 92 |
| February | 112 | 100 | 99 | 100 |
| March | 133 | 98 | 100 | 102 |
| April | 122 | 95 | 101 | 100 |
| May | 136 | 96 | 99 | 103 |
| June | 136 | 106 | 98 | 97 |
| July | 120 | 102 | 100 | 100 |
| August | 118 | 102 | 101 | 108 |
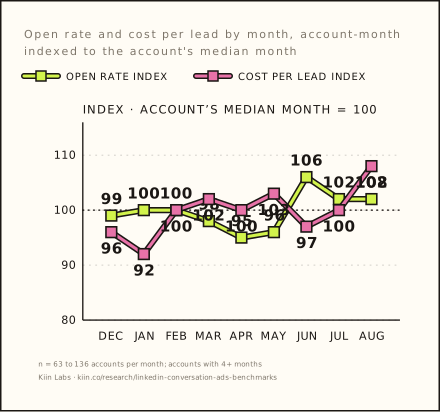
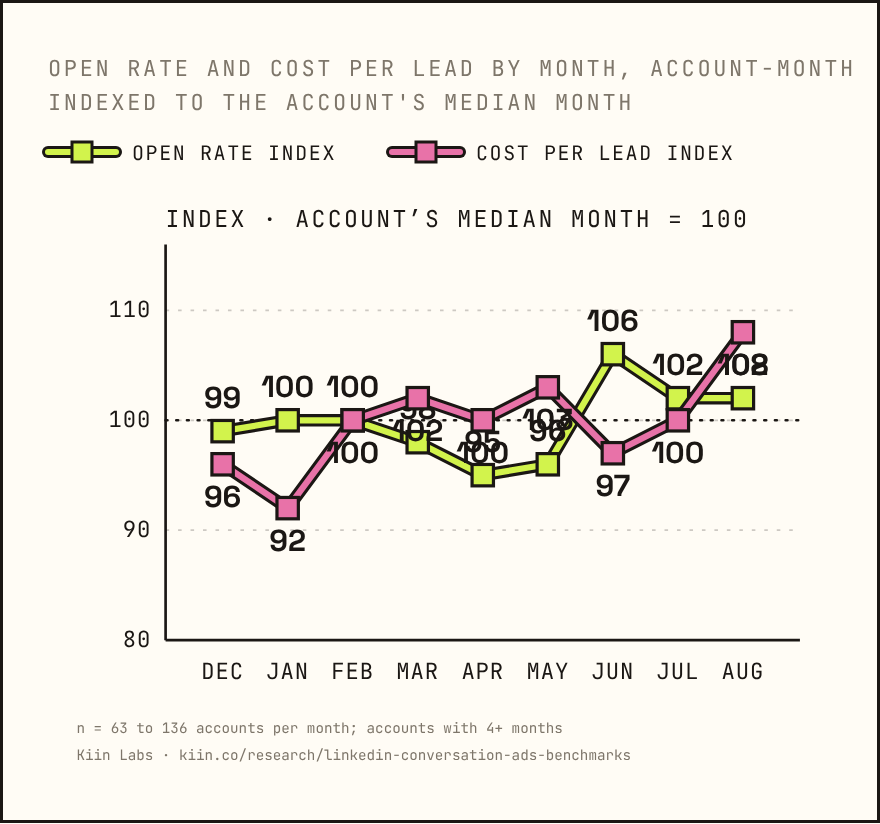
Flat. June opens best, April and May worst, and no month moves cost per lead by more than 8% from the account's normal. There is no January premium and no summer collapse. Seasonality is not a reason to pause a conversation ad campaign.
Conversation ads vs single-image lead gen forms, same account
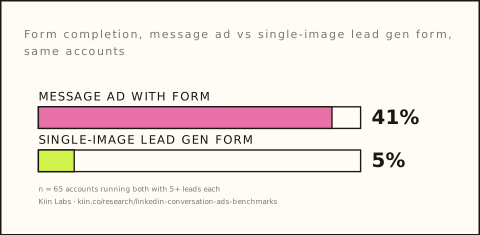
Message-ad leads are 33% cheaper than single-image lead-form leads in the same account: $232 vs $302, cheaper in 46 of 65 accounts.
Message-ad leads are 33% cheaper than single-image lead-form leads in the same account, $232 vs $302, because 41% of message-ad form opens submit, against 5%.
This is the comparison most people actually want: the message ad against the standard sponsored content post with a lead gen form, in the same account, same year. 65 accounts ran both with at least five leads on each side.
| Message ad with form vs single-image lead gen form | |
|---|---|
| Cost per lead, paired | −33% [−48%, −17%] |
| Message ad cheaper in | 46 of 65 accounts |
| Per-account median cost per lead | $232 vs $302 |
| Median leads per account | 79 vs 71 |
| Median spend | $9,544 vs $18,832 |
| Form completion (submits per form open) | 41% vs 5% |
| Form opens per $1,000 | 12.2 vs 59.4 |
| Leads per $1,000 | 4.31 vs 3.31 |
Report No. 5 puts message ads at −48% per lead vs single image on 45 accounts over 8 Sep 2025 to 7 Sep 2026, with content and demo leads combined; this comparison takes the 65 accounts with 5+ leads on both sides.
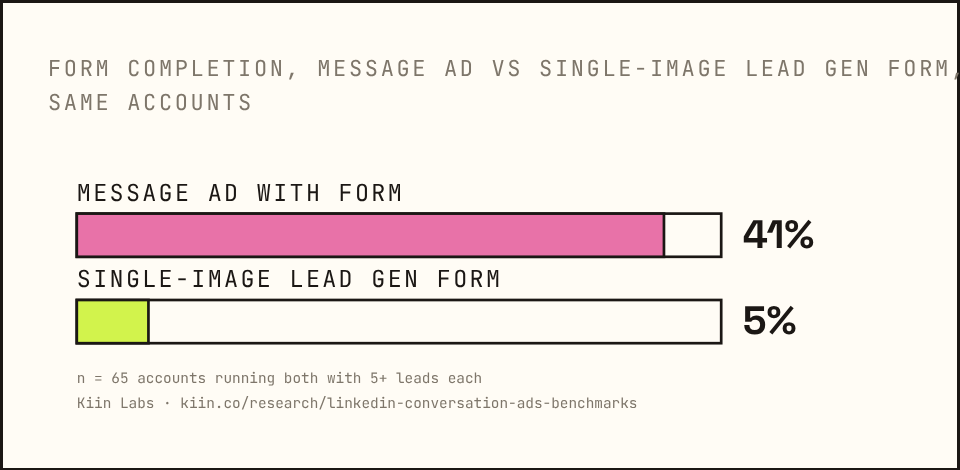
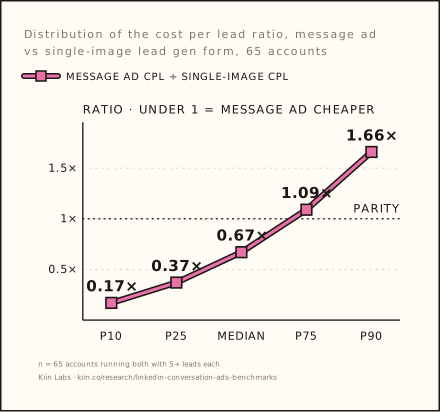
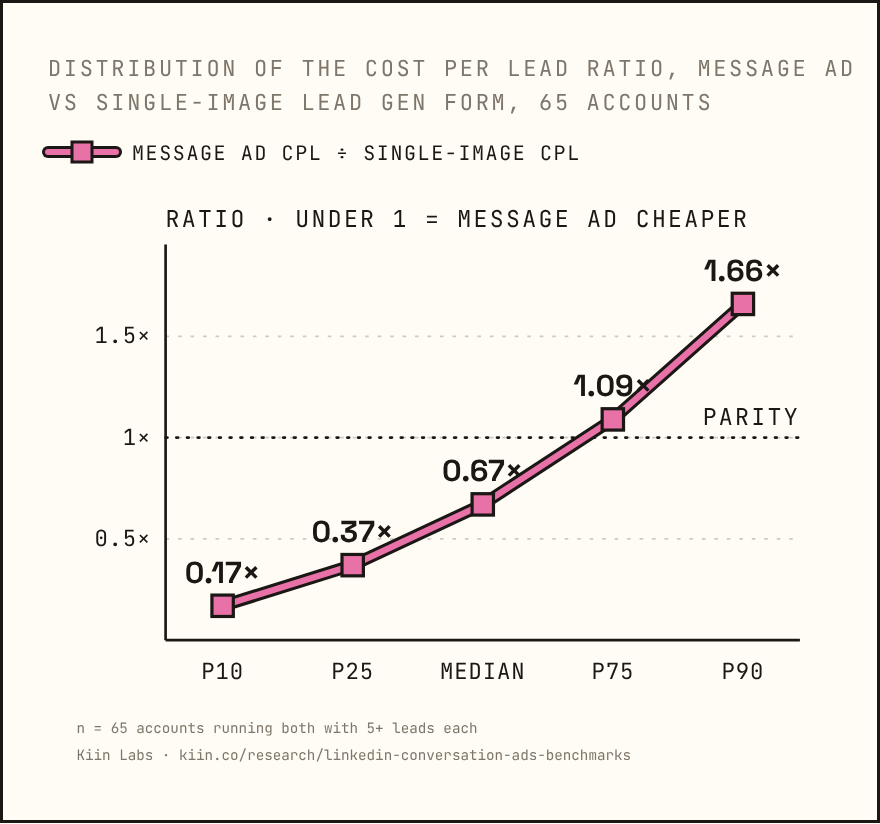
Report No. 3 splits the same comparison by what the form asks for: on demo requests, message ads are 40% and conversation ads 49% cheaper per lead than single image in the same account (6 of 6, 10 of 13); on content offers, message ad vs single image is a tie (+1%, 11 accounts) and the document ad is the cheaper feed format. The message ad is a third cheaper per lead and wins in seven accounts out of ten. It holds whether the account spends under $10,000 on message ads (−37%, cheaper in 24 of 33) or over (−26%, cheaper in 22 of 32). The distribution: a quarter of accounts saw the message ad at under half the cost per lead of the image ad; one in thirteen saw it at more than double. Nothing measured predicts which (|r| ≤ 0.13).
Look at the mechanism, because it tells you what each format is for. The image ad gets five times the form opens per dollar (59 against 12). The message ad converts eight times as many of them (41% against 5%). Feed posts generate curiosity clicks; messages generate intent clicks. If you want cheap top-of-form volume to nurture, the image ad. If you want leads that submit, the message ad. And in the accounts running both, the message ad produced slightly more leads on half the spend.
Conversation ads vs sponsored content for landing page traffic
A message-ad landing page click costs 3.8× a sponsored content one and converts 10× as often. As a traffic buy it is the worst on LinkedIn; as a conversion buy it leans cheaper (ns).
For sending people to a page, it goes the other way. In the 57 accounts running both a no-form message ad and sponsored content on the traffic objective, the message ad's landing page click cost 277% more [+168%, +428%], $40.34 against $13.83, and was cheaper in only 6 of 57 accounts. If the job is clicks to a page, the message ad is the wrong tool, nearly four times over.
But in the 20 accounts where both sides tracked a post-click conversion: 30.6% of message ad clicks converted against 3.0% of content clicks, and cost per conversion leaned 62% lower for the message ad [−75%, +50%], cheaper in 13 of 20, directional, not significant. The message ad sends a tenth of the people and ten times the intent.
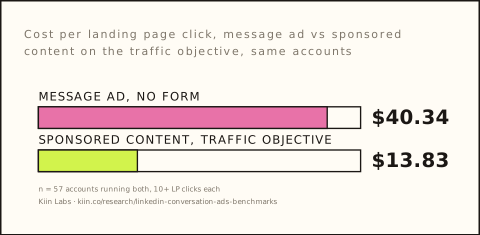
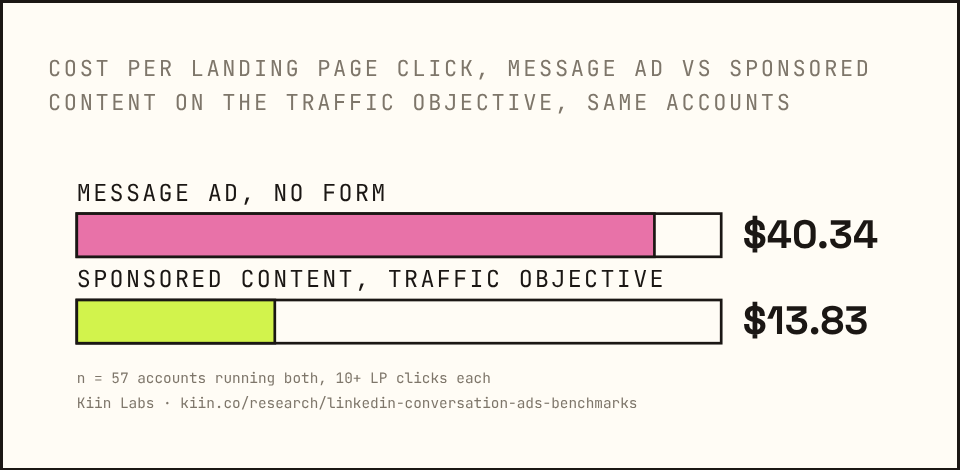
Never judge a message ad on cost per click. Cheap clicks, sponsored content on the website visits objective. Conversions from those clicks, message ads, if you can afford to buy fewer of them. The feed-ad cost per click benchmarks are in what is a good cost per click on LinkedIn.
The no-form version: landing pages, calendars and cost per booking
22% of spend runs without a lead form. Two thirds of its tracked conversions are booked meetings. Cost per booking is withheld: fewer than 10 accounts record bookings as their own conversion.
Two thirds of no-form message-ad conversions are booked meetings. Booking campaigns run almost entirely on lists and retargeting pools.
498 campaigns, 120 accounts and $1.69M ran message ads with no lead form, sending to a landing page or a calendar. Their results do not appear as LinkedIn leads, so here is what they did instead.
| No-form message ads, per-account medians (104 accounts) | Poor | Median | Good | Exceptional |
|---|---|---|---|---|
| Open rate | 37.0% | 41.9% | 48.7% | 54.0% |
| Landing page clicks per open | 0.5% | 1.1% | 2.7% | 4.5% |
| Landing page clicks per send | 0.17% | 0.47% | 1.18% | 2.19% |
| Cost per landing page click | $108 | $41 | $18 | $8 |
| Conversions per landing page click | 0% | 5% | 23% | 65% |
| Cost per conversion | $329 | $146 | $77 | $27 |
Pooled across the whole no-form set: 31,567 landing page clicks and 7,840 post-click conversions, a 24.8% conversion rate on the click, at $53 per click and $215 per conversion.
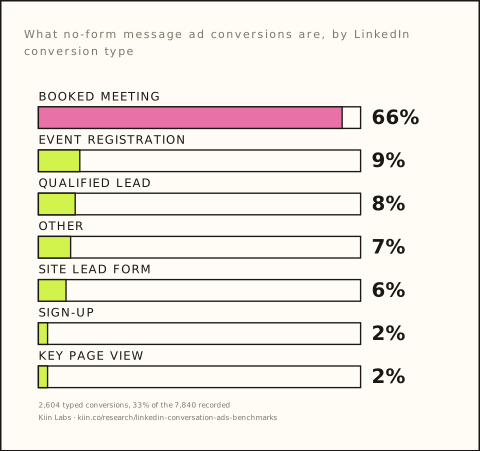
What those conversions are, where the account recorded a type: 66% booked meetings, 9% event registrations, 8% qualified leads, 6% site lead forms, 2% sign-ups. Two thirds of no-form message ad conversions are someone putting time in a calendar.
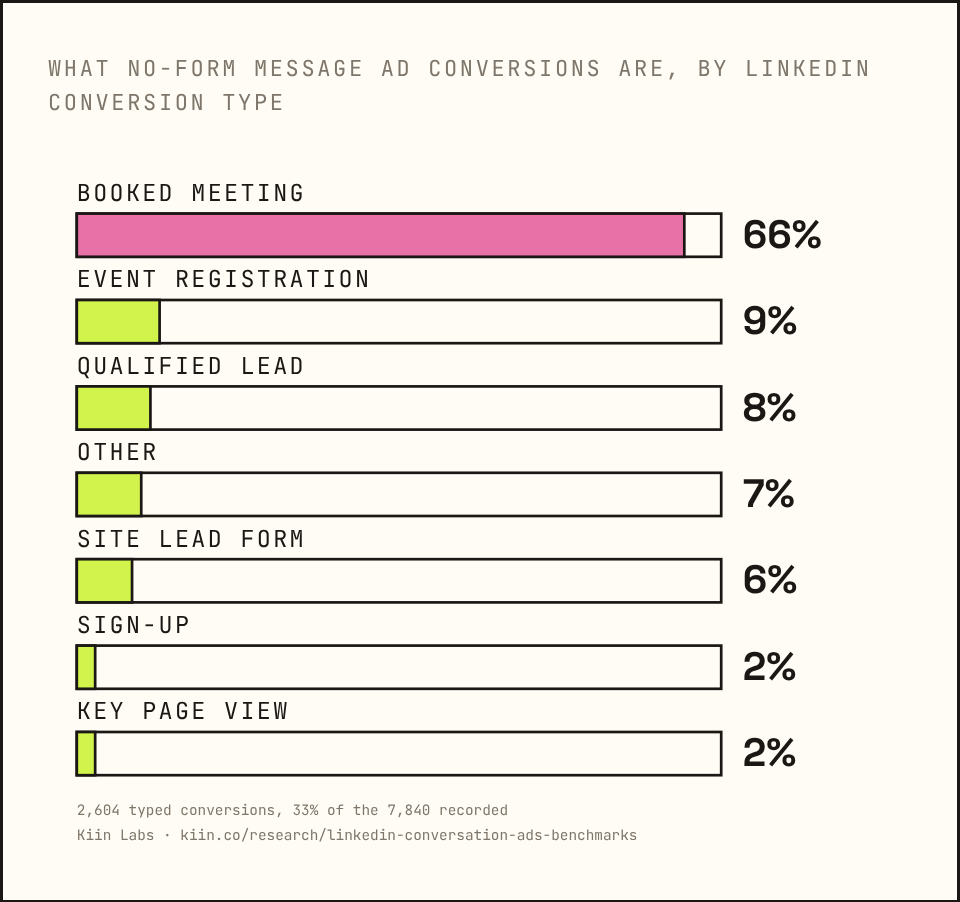
Cost per booked meeting is not published. Only a handful of accounts record a booking as its own conversion, fewer than the 10 advertisers we require before publishing any figure, so cost per booking, booking rates and the split by audience are withheld until the base grows. What the wider data shows: booking campaigns run almost entirely on uploaded lists and retargeting pools; we have no cold booking campaign with enough data to count.
Skip the form when the offer is a meeting, the sales team responds inside an hour, and you have a retargeting pool to send it to. The lead form gets you a name at $200; the calendar link gets you a meeting with the qualification already done. When the offer is anything softer than a meeting, or the audience is cold, the form wins because 41% completion beats a landing page every time. The booking numbers on their own are in what a booked meeting costs from LinkedIn Ads.
The accounts that got nothing
Median account: 10 leads a year. 30% got zero, and spent $1.16M doing it.
30% of accounts got zero leads from conversation ads in twelve months, and spent $1.16M, 15% of the panel, doing it.
Across 263 accounts: median 10 leads a year. The 75th percentile got 74. The 90th got 255. Fifty-six accounts got 100 or more.
Eighty accounts got zero. A hundred and eleven, 42% of the panel, got fewer than five. Between them the zero-lead accounts spent $1.16M, 15% of all the money in the study.
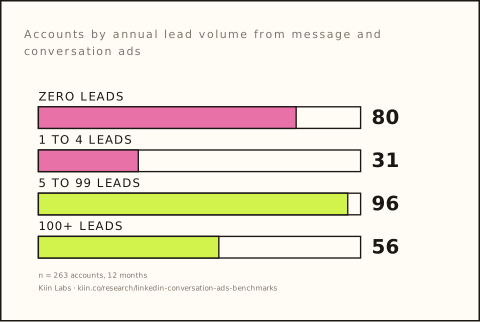
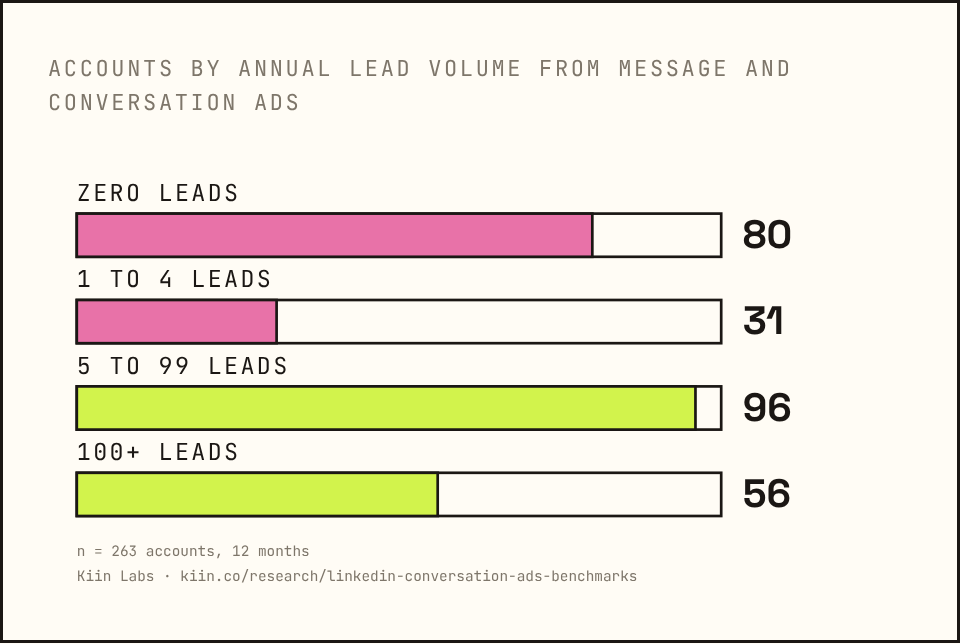
Some of that is the no-form campaigns whose results live elsewhere. But most of it is the combination this whole report has been describing from the other side: a cold uploaded list, a high bid, a landing page instead of a form, and a small audience. That is the $784-a-lead quartile, and at small budgets it rounds to no leads at all.
If you do not yet have a retargeting audience of a few thousand people, do not start with conversation ads. Build the pool first with thought leader ads and video, then switch the messages on. The format is a bottom-of-funnel tool wearing a top-of-funnel price tag, and it punishes people who use it as outreach.
How we run conversation ads in the accounts we manage
Consistent with the data above; where it goes beyond the data, it says so.
Where it sits. Bottom of a full funnel. Thought leader ads and video build the retargeting pool; the conversation ad harvests it. In accounts with budget for cold, the cold conversation ad is a separate campaign with a separate target, on a big audience (15,000 minimum, 50,000 better), judged on cost per send and volume rather than lead rate.
Format. Message ad or conversation ad, a tie on cost per lead inside the same account. We pick by the offer: buttons when there are two or three distinct offers for one audience or the sales team wants the lead pre-sorted; a single message when the offer is one thing.
Objective and form. Lead generation objective with the native form, three fields, four at most. No-form calendar version only for a meeting offer with a fast sales team and a retargeting audience.
Bid. LinkedIn's minimum. Not the recommendation. Raise only if sends have not flowed after 48 hours, and then by the smallest increment that gets them moving. Review cost per send weekly.
Schedule. Continuously, seven days. Leads per send are flat across the week; the 30-day cap paces it. If a day is cheaper in your account, it will show up in cost per lead by day of send, test that, not day of lead.
Message. One paragraph. Social proof first: two or three companies you have done the thing for, and one number. Then what you do in one sentence. Then the ask: fifteen minutes, this week, here is the button. Subject lines: in one client account, removing the subject line entirely added 12 points of open rate across two accounts; in our own tests, subject line changes have not moved results outside the noise. Test removing it; the form and the audience do the converting.
The incentive. This is from our accounts, not the panel; the data does not record what was offered. Add one line: book a demo this week and get a $100 gift card, spots limited. Clients hate the idea and assume it attracts freeloaders. I ran the CRM analysis across several accounts, stage by stage, because I wanted to check the same thing. The incentive leads move through pipeline at rates as good as the un-incentivised ones, and the incentive roughly doubles response. Test it with $500 to $1,000 of spend, pay out the cards, and check what reaches stage two before you decide. The mechanics are in LinkedIn incentive ads.
Refresh. When cost per send is 15% above launch, not when open rate drops. It will not drop.
Measurement. Cost per send and form opens per open are the two numbers that explain your cost per lead. Track them per campaign, weekly. Open rate is a hygiene check: under 37% means the audience or the region is wrong. Then get the leads into the CRM with the campaign name attached and look at stage two and stage three, not just the lead count, because that is the only place the incentive question and the list-vs-retargeting question actually get settled. What a good cost per SQL looks like is in how much does a LinkedIn SQL cost. Every format's benchmarks on one page: LinkedIn Ads benchmarks 2026. The agencies that run conversation ads this way, Kiin included, are compared in the best B2B SaaS marketing agencies; if Google Ads is the other half of your paid budget, the same approach is on SaaS PPC agency.
The six ways a conversation ad campaign goes wrong
Each maps to one of the levers above.
Sends are not delivering. Bid is at the floor and the audience is small or heavily contested. Raise the bid by one increment and wait 48 hours. If it is a retargeting pool under 2,000 people, the pool is the constraint, not the bid.
Open rate under 37%. Audience or region. Check the audience is not a stale uploaded list. Check region: a US-only cold audience opens at 37% on a good day. Check whether the low reading is weekend sends being opened on Monday before you change anything.
Opens are fine, form opens are not. This is the 38% lever. The message is not earning the click. Social proof missing, ask buried, offer vague. Rewrite the first two lines and the button label before anything else.
Form opens are fine, submits are not. Completion under 30%. Too many fields, or a custom question that makes people think. Cut to three fields.
Cost per send is creeping. The auction, not the audience. Refresh the message or widen the audience. Check the bid was not raised and forgotten.
Leads are cheap and the sales team says they are junk. The lead form is doing its job and the offer is too easy. Add a qualifying question, use the conversation format with a sorting button, or switch to the calendar version so the lead has to commit time.
Sixteen numbers to quote, with what they rest on
Each one is a complete sentence you can copy. Per-account medians and paired within-account comparisons, USD, twelve months to September 2026. Free to cite and reproduce with a link to this page.
★★★ = same advertisers compared within their own accounts, 100 or more of them · ★★ = same, 25 to 100 · ★ = directional.
$200 median cost per lead across 242 accounts; $32 at the 10th percentile, $1,005 at the 90th, a 32× spread.
So: the format is whatever your settings make it. Most of the spread is two of them.
Median open rate 42.6%, lead rate 0.09%, form completion 41%, cost per send $0.42.
So: open rate is a hygiene check; lead rate is where the accounts differ six-fold.
30% of accounts got zero leads, spending $1.16M.
So: a cold list, a high bid, a landing page and a small audience rounds to nothing at small budgets.
22% of spend runs without a lead form, a landing-page ad, mostly to a calendar.
So: its results live in your analytics, not Campaign Manager. Chapter 16 has them.
Open rate explains 2% of cost per lead; cost per send 55%; form opens per open 38%; form completion 13%.
So: track cost per send and form opens per open weekly. Leave the subject line alone.
Retargeting: +71% lead rate and +18% opens vs cold, −36% per lead vs a list, same cost per send. Cost per lead vs cold −18%, directional.
So: build the retargeting pool first, then switch the messages on.
An uploaded list costs +21% per send vs cold and delivers nothing extra.
So: a list is a set of people you would like to be warm. Run it as cold.
Bidding higher: +80% per send, +44% per lead, +0% opens. You pay 62% of your bid.
So: start at the minimum bid and raise only if sends stall.
Cost per send is the bid and the audience size (big −24%), not the audience type (+5%, ns).
So: widen the audience before you raise the bid.
Inside the same account, conversation ads and message ads are a tie on cost per lead. Cross-panel they look 3× apart because different advertisers run each.
So: pick the format by the offer. Conversation ads open 20% less and complete the form 21% more; it nets out.
Message-ad leads are 33% cheaper than single-image lead-form leads in the same account, 41% form completion vs 5%.
So: feed posts open forms; messages complete them.
A message-ad landing page click costs 3.8× a sponsored-content one ($40 vs $14) and converts 10× as often (30.6% vs 3.0%).
So: never judge a message ad on cost per click.
Two thirds of no-form conversions are booked meetings.
So: skip the form only when the offer is a meeting and the audience is warm.
Booking meetings is a warm-audience play: booking campaigns run almost entirely on lists or retargeting pools.
So: nobody books a demo cold.
Leads per send are flat across the week (0.16-0.17% every day); weekend opens read lower mostly because opens lag sends. Don't pause weekends.
So: no fatigue by week or by sends per member, and no seasonality either. Run it continuously.
Cheapest 10 accounts: $13 a lead. Dearest 10: $1,776. Same form completion, a seventh the cost per send, four times the openers into the form.
So: the 32× gap is what you pay to arrive and whether the message earns the click.
Terms used in this report
| Message ad | A single sponsored message with one call-to-action button, delivered to the LinkedIn inbox. Formerly Sponsored InMail. |
| Conversation ad | A multi-step sponsored message with two or more buttons, each leading to a further message or a call to action. |
| Send | One message delivered to one member's inbox. The unit LinkedIn charges for. |
| Open rate | Opens divided by sends. |
| Lead rate | LinkedIn lead form submissions divided by sends. |
| Form opens per open | Of the people who open the message, the share who click through to the lead form. The second largest lever on cost per lead. |
| Form completion | Submits divided by form opens. |
| Cost per send | Spend divided by sends. The largest lever on cost per lead. |
| Sends per member | Sends divided by target audience size. LinkedIn caps sponsored messages at one per member per 30 days, so this is the closest thing to a frequency setting. |
| Retargeting | Audiences built from website visitors, video viewers and ad engagers. Not uploaded lists. |
| Uploaded list | A company or contact list matched to LinkedIn members. |
| Cold | Attribute targeting with no list: title, function, industry, seniority, company size. |
| Paired within account | A comparison where the same advertiser ran both settings in the same window, so the difference is the setting and not the advertiser. |
| ns | Not statistically significant: the confidence interval includes no change. |
How we did it, and what we can't answer
Method
Data. Kiin Intelligence, LinkedIn Marketing API, all sponsored messaging campaigns (SPONSORED_MESSAGE and SPONSORED_INMAIL) across connected accounts in the twelve months to September 2026, campaign-daily grain, 14 currencies normalised to USD. 1,588 campaigns with at least 500 sends and $100 of spend, 263 accounts, $7,720,997 of spend, 37,562 LinkedIn lead form leads. Before that floor the full pull is $7.85M, 315 accounts and 37,979 leads; the floor removes test campaigns that never really ran, and every number in this report is on the qualifying set.
Benchmarks are per-account medians across the 242 accounts with 1,000 or more sends; cost per lead benchmarks across the 149 accounts with five or more leads.
Paired comparisons take the same account running both settings in the same window, with at least $200 of spend and 500 sends on each side, compute the ratio per account, and report the median ratio with a 95% bootstrap confidence interval (2,000 samples) and the share of accounts in which each side won. Cross-panel tables are campaign medians and are directional only.
Fatigue is per campaign indexed to its own first week; day of week is within campaign against the campaign's median day, with leads counted by day of send; seasonality is account-month against the account's own median month.
No-form conversions are LinkedIn post-click conversions as recorded by each account's own conversion tracking, so conversion definitions vary by account and are compared within account only. Booking conversions are LinkedIn's BOOK_APPOINTMENT type or a booking-named conversion. The per-conversion type breakdown covers 33% of recorded conversions; the rest have no type recorded.
No account, sender or message is identified; the smallest published cell is 7 accounts.
What we can't answer yet
What to write. Message body, subject line and sender are not synced to the database (0 of 8,673 creatives). Length, hook, CTA wording and the sender effect are unmeasurable until they are. The thought-leader-ads finding, author over copy, is the obvious hypothesis.
Click-to-open. Message-ad button clicks are not in the stats; only form opens and landing page clicks are visible after the open.
Booking economics at scale. Eight accounts track bookings; the per-conversion breakdown covers a third of conversions.
Lead quality. Leads are LinkedIn form submits; whether a $13 lead and a $1,776 lead are worth the same is a CRM question.
Region, paired. Too few accounts run the same offer in two regions to pair it; the region chapter is cross-panel.
Weekends, paired. Only 15 campaigns ever run weekday-only, so there is no paired weekend test; the day-of-week result is within campaign and not paired.
Ilic, P. (2026). LinkedIn Conversation Ads Benchmarks 2026. Kiin Labs. kiin.co/research/linkedin-conversation-ads-benchmarks. Figures are per-account medians and paired within-account comparisons, USD, twelve months to September 2026.
Frequently asked questions
Fifteen questions people ask about conversation ads, message ads and InMail, each answered with a number from this study.
What is a good open rate for LinkedIn conversation ads?
The median account gets 42.6%. Above 48.8% is top quartile, above 53.9% top decile. Below 37% is a targeting or region problem, not a copy problem, and check whether weekend sends opened on Monday are dragging the reading before changing anything. Open rate explains only 2% of the variance in cost per lead.
What is the average cost per lead for LinkedIn conversation ads?
$200 at the median account, with a 32× spread from $32 (top 10%) to $1,005 (bottom 10%). Retargeting audiences with a lead form attached and a low bid land in the lower half.
Are conversation ads or message ads better?
Per lead, a tie inside the same account: +36% for the conversation format with an interval that spans zero, across 53 accounts running both. Message ads get 20% more opens; conversation ads get 21% higher form completion. Cross-panel they look three times apart because different advertisers run each. Pick the format by whether the offer needs a qualification step.
How much should I bid on LinkedIn conversation ads?
Low. Start at LinkedIn's minimum and raise only if sends stall after 48 hours. The highest-bid campaign in an account pays 80% more per send and 44% more per lead than the lowest, for the same open rate. Campaigns pay a median 62% of their bid; the cheapest accounts bid around $0.35 a send.
Do LinkedIn conversation ads work on cold audiences?
Yes, as a volume play on cheap sends: cold campaigns run at $126 per lead cross-panel on audiences over 15,000. But inside the same account retargeting gets 71% more leads per send and 18% more opens than cold, and its cost per lead is lower (−18%, directional: the interval spans zero). Build the pool first.
Are uploaded lists a good audience for conversation ads?
No better than cold, and 21% more expensive per send. Retargeting beats an uploaded list by 36% per lead. A list is not a warm audience.
Should I use the lead gen form or send to a landing page?
The form, unless the offer is a meeting. The native form completes at 41% of opens; a landing page reached from a message ad converts 5% of clicks at the median account. The paired cost-per-lead test leans 19% in the form's favour but rests on eight accounts. Calendar campaigns are where booked meetings come from; their cost is withheld until 10 or more accounts record bookings.
Do conversation ads fatigue?
Not on open rate. Opens hold at 109 to 115 against week one for eight weeks (the week-two bump is partly week-one sends opened late); cumulative sends per member do not lower them either. Cost per send drifts up about 13% by week six, which is the signal to refresh.
What day should conversation ads send?
Any day. Leads per send are flat across the week at 0.16-0.17%, and cost per lead sits within ±8% of the weekly mean. Weekend open rates read lower (Saturday 88, Sunday 93 against 100) mostly because opens are dated when they happen and Friday sends get opened on Monday. Don't pause weekends; test day of send in your own account.
Is there a best month for conversation ads?
No. June opens 6% better, April and May 4 to 5% worse, and no month moves cost per lead more than 8%. Seasonality is not a reason to pause.
Are conversation ads cheaper than lead gen form image ads?
Yes, by 33% per lead in the same account, cheaper in 46 of 65 accounts. The image ad gets five times the form opens per dollar; the message ad converts eight times as many of them, 41% against 5%. Split by offer in Report No. 3: the inbox wins by 40 to 49% on demo requests and is a tie with single image on content offers, where document ads are the cheaper feed format.
What does a booked meeting cost from a LinkedIn message ad?
Kiin Labs does not publish it yet: fewer than 10 accounts record bookings as their own conversion, below the 10-advertiser floor. Two thirds of no-form message ad conversions are booked meetings; the closest published cost is a demo request lead at $350 at the median account.
Do incentive conversation ads (gift cards) produce real pipeline?
In Kiin's accounts, yes: incentive leads move through sales stages at rates as good as un-incentivised leads, and the incentive roughly doubles response. The panel data does not record offers, so test it yourself with $500 to $1,000 and check stage two.
Are LinkedIn InMail ads the same as message ads?
Yes. Sponsored InMail was renamed Message Ads in 2020; it is the same product, a single sponsored message with one call-to-action button, delivered to the inbox, and LinkedIn's API still labels it SPONSORED_INMAIL. Conversation ads are the multi-step version with two or more buttons, added the same year. Every InMail benchmark in this report is the message ad row: median open rate 45.4% (cross-panel campaign median), lead rate 0.11%, cost per send $0.31, cost per lead $111, and within the same account a tie with conversation ads on cost per lead.
Where does this data come from?
Kiin Intelligence, via the LinkedIn Marketing API: every sponsored messaging campaign with at least 500 sends and $100 of spend across connected accounts in the twelve months to September 2026, 1,588 campaigns, 263 accounts, $7.72M, 37,562 leads. Benchmarks are per-account medians; every setting comparison is the same advertiser running both sides, paired within account, with bootstrap confidence intervals. The full method is at the end of the report.
The Kiin Labs LinkedIn Ads reports
Six more studies built on the same panel of advertiser accounts. Every figure is a median across accounts, USD, LinkedIn Audience Network excluded, and free to cite with a link.
Want your account in these tables? Kiin runs LinkedIn Ads for sales-led B2B SaaS companies and benchmarks every account against the 1,000+ connected to Kiin Intelligence. The conversation ad layer, the retargeting pool it needs, and the report on landing page clicks, the scope is on LinkedIn Ads management.