
Putting creators or your founder into B2B paid media? I’ll benchmark your LinkedIn thought leader and creator ads against our $65M+ panel in a free 30-minute call. Book my free benchmark with Phil →
Ilic, P. (2026). Influencer Marketing Statistics 2026: Spend, Platforms, ROI and B2B. Kiin Labs (incorporating The B2B House). https://kiin.co/research/influencer-marketing-statistics
- The key influencer marketing statistics for 2026
- How big is the influencer marketing industry?
- How much do US brands spend on influencer marketing?
- Are brands increasing influencer budgets?
- Which platforms get the most influencer spend?
- How big is the creator economy, and how do creators earn?
- Does influencer marketing work? ROI and measurement
- Do people trust influencers? Disclosure and the FTC
- How is AI changing influencer marketing?
- B2B influencer marketing and creator-led ads on LinkedIn
- Figures previously published by The B2B House
Also: stats we no longer use · FAQ · every source
What are the key influencer marketing statistics for 2026?
If you only need one table, this is it. Every figure here was checked on the page it comes from in November 2026. The sections below give the detail, the trend and the caveats, and the B2B figures are in section 10.
| Statistic | Figure | As of | Source |
|---|---|---|---|
| US creator advertising spend | $37 billion (+26%) | 2025 | IAB, Apr 2026 |
| US creator advertising spend, forecast | $44 billion | 2026 | IAB Creator Economy Ad Spend report |
| Global influencer marketing industry (estimate) | $32.55 billion | 2025 | Influencer Marketing Hub |
| Creator economy total addressable market | $250B (2023) to $480B (2027) | Apr 2023 forecast | Goldman Sachs Research |
| US influencer marketing spend (paid posts on social) | $10.52 billion | 2025 | eMarketer, Mar 2025 |
| US influencer spend by platform: YouTube / Instagram / TikTok | $3.45B / $3.17B / $1.19B | 2025 | eMarketer, Mar 2025 |
| Ad buyers who call creators a "must buy" | 48% | Nov 2025 | IAB |
| Marketers who expect influencer budgets to rise | 87.49% | 2026 survey | Influencer Marketing Hub Benchmark Report 2026 |
| Average annual influencer budget growth | +171% | Oct 2025 | CreatorIQ, 1,723 respondents |
| Enterprise marketers who struggle to measure influencer ROI | 79% | 2026 | Linqia, 200+ enterprise marketers |
| Paid to creators, artists and media by YouTube | $100 billion+ | 2022 to 2025 | YouTube |
| Consumers who completely trust influencer content | 5% (74% at least somewhat) | 2025 | BBB National Programs |
| LinkedIn creator-led ads growth | +63% year on year | Jul to Sep 2026 | LinkedIn Q1 FY27 |
| LinkedIn advertisers running thought leader ads | 50% (from 39% in January) | Sep 2026 | Kiin panel |
Cite: "US creator ad spend reached $37 billion in 2025, up 26%, and is forecast at $44 billion for 2026 (IAB)." Kiin Labs, kiin.co/research/influencer-marketing-statistics#key-statistics
How big is the influencer marketing industry?
The best current measure is IAB's: brands spent $37 billion on US creator advertising in 2025, up 26% from $29.5 billion in 2024, and it is forecast to reach $44 billion in 2026. IAB first published the $37 billion as a projection in November 2025 (IAB, 20 November 2025) and repeated it as the 2025 figure in its full-year internet advertising report in April 2026 (IAB, 16 April 2026). Creator ad spend has grown from $13.9 billion in 2021, so it has more than doubled in four years.
IAB says the 26% growth is about four times the media industry's overall growth that year (5.7%). It is a narrow definition: only money brands deliberately invest in creators through sponsored content, paid amplification of that content and planned ads next to creator content. It leaves out affiliate commissions, subscriptions and tips.
| US creator advertising spend (IAB) | Figure | Growth |
|---|---|---|
| 2021 | $13.9 billion | |
| 2024 | $29.5 billion | |
| 2025 | $37 billion | +26% |
| 2026 (forecast) | $44 billion | about +19% |
Source: IAB, 2025 Creator Economy Ad Spend & Strategy Report (20 Nov 2025) and IAB/PwC Internet Advertising Revenue Report, full year 2025 (16 Apr 2026). 2026 growth is our calculation from IAB's two figures.
For scale: total US internet advertising was $294.6 billion in 2025, up 13.9%, with social media at $117.7 billion (+32.6%) and search at $114.2 billion (+11%) (IAB/PwC, April 2026). Creator advertising is now worth about one eighth of all US digital ad spend. When The B2B House wrote its guide, it compared $7 billion of influencer spend with a $293 billion digital ad market; the denominator has barely moved since, but the creator number has grown roughly fivefold under IAB's wider definition.
The global influencer marketing industry
Influencer Marketing Hub estimates the global influencer marketing industry at $32.55 billion in 2025, close to twice its $16.4 billion estimate for 2022 (Influencer Marketing Hub). It is the most quoted global number, but it is a modelled estimate from a company that sells influencer tools and runs an annual survey, not a measured total. Use it as an order of magnitude, and prefer IAB for US dollars.
| Market measure | Figure | Scope | Source, date |
|---|---|---|---|
| US creator advertising | $37B (2025), $44B (2026F) | US, brand ad dollars to creators | IAB, Nov 2025 |
| US influencer marketing | $10.52B (2025) | US, paid influencer posts on social only | eMarketer, Mar 2025 |
| Global influencer marketing industry | $32.55B (2025) | Global, modelled | Influencer Marketing Hub |
| Global influencer marketing industry, earlier | $16.4B (2022) | Global, modelled | Influencer Marketing Hub |
| Creator economy | $250B (2023) to $480B (2027F) | Global, all creator income incl. platform payouts | Goldman Sachs, 19 Apr 2023 |
The gap between $10.52 billion and $37 billion is definitional, not a disagreement. eMarketer counts only the fee for a paid influencer post on a social platform. IAB adds the paid media brands put behind creator content and ads placed beside it, which is where most of the growth now is. As section 03 shows, money that used to sit in paid social budgets is moving into creators, and IAB's number captures that.
Cite: "US creator ad spend has grown from $13.9 billion in 2021 to $37 billion in 2025 (IAB). Influencer Marketing Hub estimates the global influencer industry at $32.55 billion in 2025." Kiin Labs, kiin.co/research/influencer-marketing-statistics#market-size
How much do US brands spend on influencer marketing?
eMarketer forecast US influencer marketing spend at $10.52 billion for 2025, $1.37 billion more than in 2024, and expects another 15.7% growth in 2026. That makes it the first year US spend on paid influencer posts passed $10 billion (eMarketer press release, March 2025, figures confirmed via Tubefilter, 19 March 2025). eMarketer also raised its estimate of 2024 growth to 23.7%, from 16.0%.
This is the same series The B2B House quoted in 2022, and it is the most linked-to part of the old guide: "influencer marketing spend is projected to grow 23.4% and 15.9% YoY in 2023 and 2024", reaching $7.14 billion in 2024. The forecast was too low. On eMarketer's 2025 figures, US spend in 2024 was about $9.15 billion ($10.52 billion less $1.37 billion), roughly $2 billion above the $7.14 billion forecast in 2022.
| US influencer marketing spend (eMarketer) | Figure | Growth | When published |
|---|---|---|---|
| 2022, as published by The B2B House | $4.99 billion | +27.8% | 2022 forecast |
| 2023, as published by The B2B House | $6.16 billion | +23.4% | 2022 forecast |
| 2024, as published by The B2B House | $7.14 billion | +15.9% | 2022 forecast |
| 2024, eMarketer's later estimate | about $9.15 billion | +23.7% | Mar 2025 (our calculation of the dollar figure) |
| 2025 | $10.52 billion | +$1.37B | Mar 2025 |
| 2026 | not given as a dollar figure in the release | +15.7% | Mar 2025 |
Source: eMarketer, as reported by Tubefilter, 19 Mar 2025. eMarketer's influencer forecast excludes paid media, affiliate marketing and channels outside social media. Earlier rows: The B2B House, from eMarketer's 2022 forecast.
Where the money comes from
Nearly two-thirds of organisations that increased creator spending took the money from paid media budgets, according to CreatorIQ's sixth annual State of Creator Marketing report, a Sapio Research survey of 1,723 marketers, agencies and creators in 17 industries and nine regions (CreatorIQ, 1 October 2025). In the same survey, enterprises reported spending $5.6 million to $8.1 million a year on creators, and the "leaders" (at least $1 million a year and at least double the return) put 54% of their total marketing budget into creators.
| Who spends what | Figure | Source, date |
|---|---|---|
| Average enterprise annual creator spend | $5.6M to $8.1M | CreatorIQ, Oct 2025 |
| "Leaders": share of total marketing budget on creators | 54% | CreatorIQ, Oct 2025 |
| Increased creator spend funded from paid media | nearly two-thirds | CreatorIQ, Oct 2025 |
| Enterprise marketers planning to spend more than $5M on influencers | 33% | Linqia 2026 |
| Top tactics: boosted creator posts / sponsored content / affiliate / UGC | 39% / 38% / 33% / 31% | CreatorIQ, Oct 2025 |
| Brands citing gifting or seeding as a top ROI driver | 20% in 2025, down from 71% in 2020 | CreatorIQ, Oct 2025 |
The shift from gifting to paid amplification is the biggest change since The B2B House's guide, which described influencer pay as cash or free product. Boosting a creator's post with ad money is now the single most used tactic. That is the same mechanic as a LinkedIn thought leader ad, which we cover in section 10.
Cite: "eMarketer forecast US influencer marketing spend at $10.52 billion in 2025, with 15.7% growth in 2026." Kiin Labs, kiin.co/research/influencer-marketing-statistics#us-spend
Are brands increasing their influencer marketing budgets?
Yes. In Influencer Marketing Hub's 2026 Benchmark Report, 87.49% of respondents expected their influencer budget to increase and only 5.55% expected a cut; 72.22% expected an increase of 50% or more. The report is a survey of 600+ marketing professionals, published 4 May 2026 (Influencer Marketing Hub Benchmark Report 2026). It is a self-selected survey of the publisher's audience, so read it as intent among people already working in influencer marketing, not as a market-wide rate. The page itself also gives 70.20% for the same "50% or more" group in another section.
The enterprise surveys are more cautious. Linqia found 62% of enterprise marketers increasing influencer budgets in 2026 (Linqia, 2026 State of Influencer Marketing, 200+ enterprise marketers), and CreatorIQ found 71% of organisations had raised budgets, with average budgets up 171% year on year (CreatorIQ, October 2025).
| Budget statistic | Figure | Source, sample, date |
|---|---|---|
| Expect influencer budget to increase | 87.49% | IMH Benchmark Report 2026, survey, 600+ |
| Expect a decrease | 5.55% | IMH 2026 |
| Expect an increase of 50% or more | 72.22% | IMH 2026 |
| Enterprise marketers increasing influencer budgets in 2026 | 62% | Linqia 2026, 200+ enterprise marketers |
| Organisations that increased creator budgets | 71% | CreatorIQ, 1,723, Oct 2025 |
| Average annual influencer budget growth | +171% | CreatorIQ, Oct 2025 |
| Ad buyers who call creators a "must buy" | 48%, behind only paid search and social | IAB, Nov 2025 |
| Marketers planning to use more nano / micro creators (or start) | 51.43% / 52.83% | IMH 2026 |
| Enterprise marketers working with a specialist influencer agency | 49% | Linqia 2026 |
What brands want from creator campaigns
IAB asked creator ad buyers for their goals. Building brand awareness (43%) and reaching new audiences (41%) lead, ahead of brand reputation and trust (35%) and online sales or conversions (32%). 40% rank overall ROI as their top KPI. A third say finding the right creators is the biggest hurdle, and creator reputation (58%) and audience alignment (56%) are the top selection criteria (IAB, November 2025).
| Creator campaign goal (IAB) | Share of buyers |
|---|---|
| Build brand awareness | 43% |
| Reach new audiences | 41% |
| Enhance brand reputation or trust | 35% |
| Drive online sales or conversions | 32% |
| Rank overall ROI as top KPI | 40% |
Source: IAB, Creator Economy Ad Spend & Strategy Report, 20 Nov 2025.
Cite: "48% of ad buyers now call creators a 'must buy', behind only paid search and social (IAB, 2025)." Kiin Labs, kiin.co/research/influencer-marketing-statistics#budgets
Which platforms get the most influencer marketing spend?
YouTube is now the biggest US influencer platform by spend: eMarketer forecast $3.45 billion on YouTube in 2025, against $3.17 billion on Instagram and $1.19 billion on TikTok. It also expected more than half of US marketers to pay for influencer content on YouTube in 2025, the first time that has happened (eMarketer via Tubefilter, March 2025). In The B2B House's 2022 data, Instagram led with $2.23 billion of $4.99 billion and YouTube was second at $0.95 billion.
| US influencer spend by platform | 2022 (as published by The B2B House) | 2025 (eMarketer) |
|---|---|---|
| YouTube | $0.95 billion | $3.45 billion |
| $2.23 billion | $3.17 billion | |
| TikTok | $0.77 billion | $1.19 billion |
| $0.74 billion | not given | |
| Total | $4.99 billion | $10.52 billion |
Source: eMarketer, reported by Tubefilter, 19 Mar 2025; each of the three was expected to grow about 17% in 2025. 2022 column: The B2B House, from eMarketer's 2022 forecast.
Usage and spend are different things. Instagram is still the platform most brands use: 85% of brand respondents name it their most commonly used creator platform, and it narrowly leads on perceived ROI, 29% to TikTok's 27% (CreatorIQ, October 2025). TikTok leads on plans: 31% of Influencer Marketing Hub's respondents include it in their 2026 investment plans, the most selected platform (IMH 2026). YouTube spend is higher because a YouTube integration costs more per placement than an Instagram or TikTok post.
| Platform statistic | Figure | Source, date |
|---|---|---|
| Brands whose most-used creator platform is Instagram | 85% | CreatorIQ, Oct 2025 |
| Brands saying Instagram / TikTok drives the most ROI | 29% / 27% | CreatorIQ, Oct 2025 |
| Brands naming YouTube their top platform for experimentation | 23% | CreatorIQ, Oct 2025 |
| Social platforms used by the average organisation | 5 | CreatorIQ, Oct 2025 |
| Marketers including TikTok in 2026 influencer plans | 31%, the most selected | IMH 2026 |
| US marketers paying for YouTube influencer content | more than half, for the first time | eMarketer, 2025 |
| Most common tracking: promo codes / affiliate links / native shop features | 45.9% / 26.0% / 25.0% | IMH 2026 |
LinkedIn is the one platform where the consumer surveys say little. In Influencer Marketing Hub's 2026 survey it appears mainly among brands with no plans to invest, which reflects who answers that survey (mostly consumer brands) rather than what B2B companies do. LinkedIn's own figures, and our panel, are in section 10.
Cite: "YouTube overtook Instagram as the biggest US influencer platform by spend: $3.45 billion vs $3.17 billion in 2025, with TikTok at $1.19 billion (eMarketer)." Kiin Labs, kiin.co/research/influencer-marketing-statistics#platforms
How big is the creator economy, and how do creators earn?
Goldman Sachs Research estimates the creator economy at $250 billion and expects it to roughly double to $480 billion by 2027. It counts about 50 million creators worldwide, growing at 10% to 20% a year, of whom only about 4% are professionals earning more than $100,000 a year. Brand deals are the main source of creator income, at about 70% according to the survey data Goldman uses (Goldman Sachs, 19 April 2023). This is a 2023 forecast and has not been updated by Goldman since; we keep it because it is the source most other figures quote.
| Creator economy statistic | Figure | Source, date |
|---|---|---|
| Creator economy total addressable market | $250B, rising to $480B by 2027 | Goldman Sachs, Apr 2023 |
| Creators worldwide | 50 million, growing 10% to 20% a year | Goldman Sachs, Apr 2023 |
| Creators who are professionals (more than $100,000 a year) | about 4% | Goldman Sachs, Apr 2023 |
| Share of creator income from brand deals | about 70% | Goldman Sachs, Apr 2023 |
| Paid by YouTube to creators, artists and media companies | $100 billion+ | YouTube, 2022 to 2025 |
| Share of ad and subscription revenue YouTube pays partners | 55% | YouTube |
| YouTube creative ecosystem's contribution to US GDP | $60 billion+, 540,000+ full-time jobs | YouTube, Oxford Economics, 2025 |
| UGC creator cost ranges under $500 | about 80% (nano 55%, micro 45.5%) | IMH 2026 survey |
Platform payouts are the other income stream, and they have grown far beyond the "creator funds" The B2B House described in 2022, when 81.4% of creators surveyed had received less than $2,500 from platform funds. YouTube alone says it paid more than $100 billion to creators, artists and media companies over the four years 2022 to 2025, and pays 55% of ad and subscription revenue to partners (YouTube). On LinkedIn, creator and publisher payouts from its BrandLink video programme more than tripled year on year in mid-2025 (section 10). Brand deals are still the main source of income for most creators, which is what Goldman's 70% says.
The money is concentrated. Goldman's 4% professional share has not been replaced by a newer primary figure, but every survey since points the same way: a small group of creators earns most of the money, and most creators earn modest sums from occasional brand work. For brands this is useful: the creator you can afford is often more relevant to your audience than the one you have heard of, which is why more than half of marketers plan to use more nano and micro creators (section 04).
Cite: "Goldman Sachs expects the creator economy to grow from $250 billion to $480 billion by 2027; about 4% of 50 million creators earn more than $100,000 a year." Kiin Labs, kiin.co/research/influencer-marketing-statistics#creator-economy
Does influencer marketing work? ROI and measurement statistics
Most marketers believe it works, but most cannot prove it: 79% of enterprise marketers say they struggle to measure influencer marketing ROI, and 48% name attribution as their biggest measurement gap. Those are from Linqia's 2026 State of Influencer Marketing, a survey of more than 200 enterprise marketers (Linqia). In the same survey 81% said creator content outperforms brand-created assets, and every respondent repurposes creator content beyond the creator's own channels.
| ROI and measurement statistic | Figure | Source, sample, date |
|---|---|---|
| Struggle to measure influencer marketing ROI | 79% | Linqia 2026, 200+ enterprise marketers |
| Name attribution as their biggest measurement gap | 48% | Linqia 2026 |
| Say creator content outperforms brand-created assets | 81% | Linqia 2026 |
| Repurpose creator content beyond the creator's channels | 100% | Linqia 2026 |
| Measurement is the top challenge | 26%, the most cited | CreatorIQ, Oct 2025 |
| Creator ad buyers ranking overall ROI as top KPI | 40% | IAB, Nov 2025 |
| Track with promo codes / affiliate links / native shop features | 45.9% / 26.0% / 25.0% | IMH 2026 |
| Marketers who found influencer marketing effective | 80% | Mediakix, 2019 (as published by The B2B House) |
Notice what the most common tracking methods are: discount codes and affiliate links. Both work for a product someone can buy today. Neither works for a B2B purchase that takes months and involves a buying committee, which is why B2B teams need a different measure (section 10).
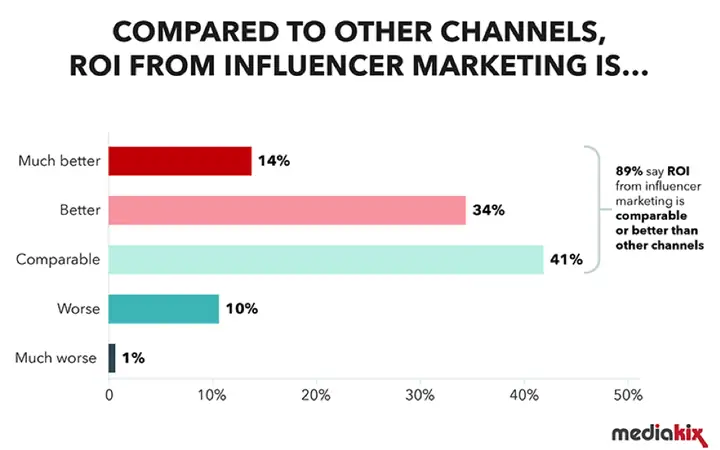
The figure you will see most often for influencer ROI is "$5.78 earned for every $1 spent". We have not found a primary study behind it; it circulates on statistics pages without a method or a date, so we do not use it. The older survey figures The B2B House quoted from Mediakix (80% found it effective, 89% said ROI was as good as or better than other channels, 71% said traffic quality was better) are from a 2019 survey and are kept in section 11.
How to measure influencer marketing properly
The honest answer from every report on this page is that codes and clicks undercount. A creator video can lead someone to search, visit your site or ask a colleague, and none of that is credited to the creator. The fix is the same one we use for LinkedIn: measure the audience you reached against a comparable audience you did not reach, and look at pipeline and revenue over a realistic window, not clicks in the first week. Conversion lift tests, matched-market tests and, in B2B, company-level engagement matched to CRM deals all do this. IAB's buyers list "advanced attribution" and "consistent reporting" as the top things they want improved (IAB, 2025).
Cite: "79% of enterprise marketers struggle to measure influencer marketing ROI, and 81% say creator content outperforms brand-created assets (Linqia, 2026)." Kiin Labs, kiin.co/research/influencer-marketing-statistics#roi
Do people trust influencers? Disclosure, the FTC and trust statistics
Only 5% of US consumers completely trust influencer content, and 74% trust it at least somewhat, against 87% who trust advertising in general. Yet 58% have bought something because of an influencer's endorsement. That is from BBB National Programs' 2025 Influencer Trust Index, a survey of more than 3,700 US consumers with The Benchmarking Company (BBB National Programs, 26 June 2025).
| Trust statistic | Figure | Source, date |
|---|---|---|
| Trust influencer content completely | 5% | BBB National Programs, 2025 |
| Trust influencer content at least somewhat / trust advertising in general | 74% / 87% | BBB National Programs, 2025 |
| Have bought because of an influencer endorsement | 58% | BBB National Programs, 2025 |
| Have made four to six purchases based on influencer content | 35% | BBB National Programs, 2025 |
| Feel deceived when they find an undisclosed partnership | 70% | BBB National Programs, 2025 |
| Say authentic reviews, even negative ones, build trust | 79% | BBB National Programs, 2025 |
| Say both brand and influencer should be accountable for transparency | 72% | BBB National Programs, 2025 |
| US adults who regularly get news from news influencers | 21% (37% of under 30s) | Pew Research Center, Nov 2024 |
| Enterprise marketers who avoid virtual (AI) influencers | 89% | Linqia 2026 |
The trust finding most relevant to marketers is that disclosure is not the problem; hiding it is. 70% feel deceived by an undisclosed partnership, while basic "#ad" labels alone do little to raise trust, according to the same index. Audiences accept sponsorship; they react against concealment and scripted praise.
Influence now reaches beyond shopping. 21% of US adults regularly get news from news influencers, rising to 37% of 18 to 29 year olds, according to Pew's study of 500 news influencers and a survey of 10,658 adults (Pew Research Center, 18 November 2024). 85% of those news influencers have an account on X, and 63% are men.
FTC rules on influencer disclosure
In the US, the rules come from the Federal Trade Commission. Two changes since The B2B House's guide matter:
| FTC rule | What it says | Date |
|---|---|---|
| Updated Endorsement Guides | First revision since 2009. "Endorsements" now explicitly include virtual influencers and social media tags; a platform's built-in disclosure tool may not be enough on its own; disclosures must be "clear and conspicuous"; advertisers, endorsers and intermediaries can all be liable. The FAQ added 40 new questions, many on influencers. Vote 3 to 0. | 29 Jun 2023 |
| Rule on Consumer Reviews and Testimonials | Bans fake reviews and testimonials (including AI-generated ones), buying reviews, undisclosed insider reviews, and buying or selling fake indicators of social media influence, such as bot followers or views, to misrepresent influence for a commercial purpose. Allows civil penalties for knowing violations. Vote 5 to 0. | 14 Aug 2024, in force 21 Oct 2024 |
Sources: FTC press releases and the FTC's Consumer Reviews and Testimonials Rule Q&A. The FTC notes that a hired influencer's post is treated as an endorsement, not a review, and a brand is not liable under the fake-indicators provision just because an influencer it hired happens to have fake followers. This is a summary, not legal advice.
For B2B, the practical rule is simple: if a creator, partner or employee is paid or otherwise connected to you, the post says so. On LinkedIn, a thought leader ad from someone outside your company only runs after that member approves the sponsorship, and it is labelled as promoted.
Cite: "Only 5% of US consumers completely trust influencer content, yet 58% have bought because of an influencer endorsement (BBB National Programs, 2025)." Kiin Labs, kiin.co/research/influencer-marketing-statistics#trust
How is AI changing influencer marketing?
Almost every brand now uses AI somewhere in creator marketing, mostly for production and discovery, and almost none wants to replace the creator. CreatorIQ found 95% of brand respondents use AI, most often for captions (45%), research (44%) and video or graphic editing (41%) (CreatorIQ, October 2025). Linqia found 74% use AI for ideas, briefs and workflow, while 89% still avoid virtual influencers (Linqia 2026).
| AI statistic | Figure | Source, date |
|---|---|---|
| Brands using AI in creator marketing | 95% | CreatorIQ, Oct 2025 |
| Brands that want to fully automate influencer workflows | 69% | CreatorIQ, Oct 2025 |
| Creators who say their voice or likeness should never be replaced by AI | 41% | CreatorIQ, Oct 2025 |
| Creator ad buyers using or planning to use AI within a year | nearly 3 in 4 | IAB, Nov 2025 |
| AI users applying it to content editing / creator briefs / personalisation | 49% / 46% / 45% | IAB, Nov 2025 |
| Advertisers with concerns about AI in creator marketing | 95% | IAB, Nov 2025 |
| Marketers using AI for creator discovery, the top use | 36.67% | IMH 2026 |
| Enterprise marketers avoiding virtual influencers | 89% | Linqia 2026 |
The pattern is consistent across four surveys: AI behind the scenes, a real person on screen. 95% of advertisers have concerns about AI in creator marketing, and the FTC's 2023 guides already treat virtual influencers as endorsers who must disclose. For B2B buyers, who are judging whether a person knows what they are talking about, a real expert matters even more.
Cite: "95% of brands use AI in creator marketing, but 89% of enterprise marketers avoid virtual influencers (CreatorIQ 2025; Linqia 2026)." Kiin Labs, kiin.co/research/influencer-marketing-statistics#ai
B2B influencer marketing: how big are creator-led ads on LinkedIn?
On LinkedIn, creator-led ads grew 63% year on year and paid video 25% in the July to September 2026 quarter, and the number of established creators posting daily grew 13%, about six times faster than LinkedIn's broader creator base (LinkedIn Q1 FY27 business highlights, 28 October 2026). Paid video had grown nearly 30% in the January to March quarter (LinkedIn, 30 April 2026). B2B influencer marketing is now mostly LinkedIn influencer marketing, and it is bought through three products: Thought Leader Ads, BrandLink and creator sponsorships.
| LinkedIn creator and video statistic | Figure | Source, date |
|---|---|---|
| Creator-led ads growth | +63% year on year | LinkedIn, Jul to Sep 2026 |
| Paid video growth | +25% year on year | LinkedIn, Jul to Sep 2026 |
| Paid video growth, earlier in 2026 | nearly +30% | LinkedIn, Jan to Mar 2026 |
| Established creators posting daily | +13%, about 6x the wider creator base | LinkedIn, Jul to Sep 2026 |
| BrandLink video completion rate vs standard video ads | 130% higher | LinkedIn, 30 Apr 2025 |
| BrandLink view rate vs standard video ads | 23% higher | LinkedIn, 30 Apr 2025 |
| Members who view BrandLink ads: likelihood to become a lead | up to 18% higher | LinkedIn, Jul 2024 to Jan 2025 data |
| BrandLink revenue growth | nearly 200%, quarter to June 2025 | LinkedIn via Reuters, Aug 2025 |
| Creator and publisher payouts from BrandLink | more than tripled year on year | LinkedIn via Reuters, Aug 2025 |
| Publishers and creators added to BrandLink since May 2025 | 70+ | LinkedIn via Reuters, Aug 2025 |
| Revenue from Top Voices 360 (brands paired with creators) | $20 million+, May 2025 to May 2026 | Reuters, 10 Jun 2026 |
| CEO video posts on LinkedIn | +68% over two years | LinkedIn via Reuters, Jun 2026 |
LinkedIn figures are LinkedIn's own, from its pressroom or as reported by Reuters. BrandLink (formerly the Wire Program) places pre-roll video ads on creator and publisher videos; creators named at the 2025 relaunch include Steven Bartlett, Guy Raz and Allie K. Miller. Top Voices 360 clients reported by Reuters include SAP, IBM and ServiceNow.
Thought leader ads: what the panel shows
Half of LinkedIn advertisers ran thought leader ads in September 2026, up from 39% in January, and they took 21% of spend, which makes them the most adopted new format on the platform this year (Kiin Labs, stat 121). A thought leader ad is a post from a person, your founder, an employee or an outside creator, that you pay to promote; it is the B2B version of a boosted creator post. Our panel covers more than 1,000 B2B advertiser accounts and $65M+ of LinkedIn spend.
| Thought leader ads (Kiin panel) | Figure | Source |
|---|---|---|
| LinkedIn advertisers running thought leader ads | 50% in Sep 2026 (39% in Jan); 21% of spend | Stat 121 |
| Thought leader video share of LinkedIn video spend | 15% to 34%, Jan to Sep 2026 | Stat 124 |
| Median engagement rate: thought leader ads vs company-page single image | 4.7% vs 1.2% | Stat 64 |
| Landing page CTR: thought leader vs company-page ads (same account) | 0.449% vs 0.441% | Stat 56 |
| CPM: thought leader vs company-page ads (same account) | $74.71 vs $48.80 | Stat 56 |
| Thought leader ad clicks that never reach a landing page | 91% | Stat 53 |
| Engagement of the top 10% of authors vs the bottom 10% | 8.6x (10.55% vs 1.22%) | Stat 47 |
| Median LinkedIn CPM, all feed formats | $36.23 | Kiin benchmarks |
Source: Kiin Labs panel, 1,000+ B2B advertiser accounts, $65M+ of LinkedIn spend, medians across accounts, USD, panel pulls to October 2026. Full method and n for each stat: LinkedIn Ads statistics.
Three things follow for B2B creator programmes. First, a person's face earns about four times the engagement of a logo, which is the whole case for B2B influencer marketing in one number. Second, you pay for that in CPM, not clicks: thought leader ads and company-page ads get the same landing page click rate in the same account, but thought leader impressions cost about 53% more. Third, the author matters more than the post: the best authors engage at 8.6 times the rate of the worst, and the author explains about two-thirds of the difference. Choosing the right creator or executive is the biggest decision you make.
That is also why judging a B2B creator campaign on cost per lead undersells it. 91% of thought leader ad clicks stay on LinkedIn (a profile view, a comment, "see more"), so the value shows up as reach and engagement inside your buying committees, and later as pipeline. We measure it the way we measure all LinkedIn Ads: on the accounts reached and the deals they turn into, with the median demo request lead at $350 (good: $161) and content leads at $164 as the comparison points (Kiin Labs).
Building a B2B creator programme
There are three ways to put people into B2B paid media, and most programmes use more than one:
- Your own experts. Founder and executive posts, promoted as thought leader ads to your target accounts. This is what our founder content service is built for: content written for your ICP and designed to be paid behind, not just posted.
- Outside B2B creators. Sponsoring posts from creators your buyers already follow, through LinkedIn's creator sponsorships or directly, and amplifying them as thought leader ads with the creator's approval. If you want an agency for this, our list of the best B2B influencer marketing agencies compares 13, including how they handle paid distribution.
- Publisher and creator video. BrandLink places your video ad before creator and publisher content, which LinkedIn says lifts completion rates by 130% against standard video ads.
Whichever you choose, the consumer playbook (codes, affiliate links, cost per post) will not tell you whether it worked. Read every thought leader and creator ad against the benchmarks in our 150 LinkedIn Ads statistics, and for cost per impression and click see the LinkedIn Ads benchmarks.
Cite: "LinkedIn creator-led ads grew 63% year on year in Q3 2026 (LinkedIn), and half of LinkedIn advertisers now run thought leader ads, which engage at 4.7% against 1.2% for company-page ads (Kiin Labs panel)." Kiin Labs, kiin.co/research/influencer-marketing-statistics#b2b
Figures previously published by The B2B House
The B2B House's "Influencer Marketing: Key Statistics, Trends, Data" was cited by more than 70 sites, from trade press to university theses. The B2B House is now part of Kiin, so the figures it published stay here, exactly as published, so every link to them still makes sense. Next to each one is what we know in 2026.
Two things to know before you use them:
- Many were forecasts. The most cited numbers were eMarketer's 2022 projections for 2023 and 2024. Those years have passed, and the actual figures came in higher.
- Some had thin sources. Several came from Statista charts, vendor samples or surveys from 2019 to 2021. Where there is no newer primary figure, we say so rather than invent one.
"Influencer marketing spend is projected to grow 23.4% and 15.9% in 2023 and 2024"
As published: influencer marketing spend is projected to grow 23.4% and 15.9% year on year in 2023 and 2024, reaching $6.16 billion in 2023 and $7.14 billion in 2024 (vs $4.99 billion in 2022). US figures, from eMarketer's 2022 forecast.
2026: The 2024 growth came in higher. eMarketer now estimates 2024 growth at 23.7% (it had forecast 16.0%) and puts 2025 US spend at $10.52 billion, with 15.7% growth expected in 2026 (eMarketer via Tubefilter, March 2025). On IAB's wider measure, US creator ad spend was $37 billion in 2025, up 26%, and is forecast at $44 billion in 2026 (IAB). Full tables in section 03.
"US marketers will spend $5 billion on influencer marketing in 2022" and "$7.14 billion by 2024"
As published: US marketers projected to spend $5 billion on influencer marketing in 2022 ($4.99 billion), rising to $6.16 billion in 2023 and $7.14 billion in 2024. An earlier version of the guide also gave $4.62 billion for 2023. 74.5% of marketers at companies with 100+ employees would work with influencers in 2022.
2026: US spend passed $10 billion in 2025 ($10.52 billion, eMarketer), so 2024 was about $9.15 billion, roughly $2 billion above the $7.14 billion forecast. eMarketer now says more than half of US marketers pay for influencer content on YouTube alone. BBB National Programs cites 82.7% of US marketers using influencers in 2024 (BBB National Programs, 2025). See section 03.
"TikTok influencer spend: almost $800 million in 2022, $1.32 billion in 2024" and "marketers will double TikTok spend in two years"
As published: TikTok influencer marketing spending was $0.78 billion in 2022 (15.5% of the total), projected to reach $1.32 billion in 2024 (18.5%), nearly double 2022 and almost ten times 2020. TikTok spend would pass Facebook in 2022 and YouTube in 2024. Source: eMarketer forecast, 2022.
2026: TikTok grew, but did not pass YouTube. eMarketer forecast $1.19 billion on TikTok in 2025, against $3.45 billion on YouTube and $3.17 billion on Instagram (eMarketer, March 2025). TikTok's share of US influencer spend is about 11%, not the 18.5% projected. It does lead on intent: 31% of marketers include it in 2026 plans, the most of any platform (IMH 2026). See section 05.
"Instagram is the most used platform for influencer marketing"
As published: Instagram is the most used platform for influencer marketing, with $2.23 billion of 2022 US spend (44.7%), followed by YouTube ($0.95B), TikTok ($0.77B) and Facebook ($0.74B); TikTok was the fastest growing.
2026: Still the most used, no longer the biggest by spend. 85% of brands say Instagram is their most commonly used creator platform (CreatorIQ, October 2025), but YouTube now takes the most US influencer spend: $3.45 billion vs Instagram's $3.17 billion in 2025 (eMarketer).
"Brand sponsorships are still the main source of influencer marketing spend" and creator funds
As published: brand sponsorships remain the main revenue source; only 27% of creators had received funding from platforms, and 81.4% of those received less than $2,500 from creator funds such as TikTok's Creator Fund and the YouTube Shorts Fund.
2026: Still true. Goldman Sachs puts brand deals at about 70% of creator income (Goldman Sachs, 2023). Platform payouts have grown a lot, though: YouTube says it paid more than $100 billion to creators, artists and media companies from 2022 to 2025 (YouTube), and LinkedIn's BrandLink payouts more than tripled in 2025. The creator-fund survey itself has not been repeated. See section 06.
Instagram engagement rates by follower count: "3.86% under 15,000, 2.39% for 15,000 to 50,000"
As published: Instagram influencer engagement rate 3.86% (under 15,000 followers), 2.39% (15,000 to 50,000), 1.87% (50,000 to 100,000), 1.62% (100,000 to 500,000), 1.36% (500,000 to 1M), 1.21% (over 1M); 2.05% average. Similar tables for YouTube (0.61% average) and TikTok (12.43% to 13.70%).
2026: No like-for-like primary update. These were third-party tool estimates from around 2021, and engagement-rate methods have changed since, so newer vendor figures (generally much lower for TikTok) are not comparable. The direction still holds: engagement falls as follower count rises, which is one reason 51% to 53% of marketers plan to use more nano and micro creators (IMH 2026). For B2B, measured engagement on LinkedIn thought leader ads is a median 4.7% (Kiin panel).
"13.8% of Instagram influencers focus on lifestyle"
As published: 13.80% of Instagram influencers focus on lifestyle, the largest category, followed by beauty (8.56%), music (8.27%), photography (6.64%) and family (6.20%). Source: Statista, 2021. Fastest follower growth by topic in 2020: music +632%, humour +579%.
2026: No update from a primary source. The figures came from a 2021 Statista chart based on a third-party influencer database, and no newer edition with the same method exists. Treat them as a 2021 snapshot.
"Almost 11% of adults worldwide follow travel influencers"
As published: travel influencers were the 4th most popular type; almost 11% of adults worldwide follow them, behind food creators (16%), celebrities (12%) and health creators (12%). Source: YouGov. Travel bookers would rise to 120 million in 2022.
2026: No update. YouGov has not republished this global cut. Pew's 2024 finding that 21% of US adults regularly get news from influencers is the most robust recent measure of how many people follow creators for something other than entertainment (Pew).
"Brands use creators for ad creatives" and Apple's privacy changes
As published: with weaker targeting after Apple's App Tracking Transparency (which Facebook said could cost it $10 billion in 2022), brands turn to creators for ad creative, because it is less disruptive and cheaper to produce; brands should explore creator licensing to boost creators' posts.
2026: This prediction came true. Boosted creator posts are now the most used creator tactic (39%), and nearly two-thirds of the extra creator money came from paid media budgets (CreatorIQ, 2025); 81% of enterprise marketers say creator content outperforms brand assets (Linqia 2026). In B2B the same idea is the thought leader ad, now run by half of LinkedIn advertisers (section 10).
"80% of marketers find influencer marketing effective" and "89% see ROI"
As published: 80% of marketers found influencer marketing effective (5% ineffective, 15% neutral); 71% said the quality of customers and traffic was better than other sources; 89% said ROI was comparable to or better than other channels. Source: Mediakix survey, 2019.
2026: Mediakix has not repeated the survey. Current surveys measure confidence differently: 81% of enterprise marketers say creator content outperforms brand assets, but 79% struggle to measure ROI (Linqia 2026), and 48% of ad buyers call creators a "must buy" (IAB 2025). See section 07.
Influencer rates: "$1,118 per Instagram post", "$7,332 per YouTube video", Glewee earnings
As published: Instagram price per post from $10 to $41 (nano) to a $1,118 minimum (mega); YouTube from $60 to $793 (nano) to a $7,332 minimum (mega). Glewee's analysis of 850 influencers: YouTube $425 per video, Instagram $225 per feed post, TikTok $175 per post. Earned media value per Instagram post from $9 to $5,133.
2026: No primary rate card has replaced these. The best recent signal is Influencer Marketing Hub's 2026 survey: about 80% of UGC creator cost ranges were under $500, against about 55% for nano and 45.5% for micro creators (IMH). Rising creator costs are the top challenge for 35.4% of marketers in the same survey. Rates now depend heavily on usage rights for paid amplification, which most brands include in the contract.
Other figures from the original guide
As published: 39,000+ TikTok accounts with more than 1 million followers vs 33,000+ on YouTube and 23,000+ on Instagram (Socialblade); influencer marketing platform market $202 million in 2022, $338 million by 2027 (Statista); 39% of agencies allocate 10% to 20% of budget to influencers; 54% of brands work with 0 to 10 influencers; 28% of Gen Z follow influencers or experts; 44.13% of Instagram influencers have 5,000 to 20,000 followers; 50.51% of TikTok influencers have 1,000 to 5,000; Elon Musk's 109.6 million Twitter followers vs Tesla's 17.6 million (Oct 2022); budget $3,000 to $5,000 a month to test TikTok.
2026: None of these has a current primary update; they were Statista or tool snapshots from 2020 to 2022. The closest current figures: 49% of enterprise marketers now work with a specialist influencer agency (Linqia); 66.33% of programmes are run entirely in-house (IMH 2026); organisations use 5 social platforms on average (CreatorIQ). We keep the rest here only as the original guide published them.
Influencer marketing stats we no longer recommend using
A good statistics page should also say what not to quote. These figures are still widely repeated, including in AI answers, but are out of date or have no traceable primary source:
- "Influencer spend will grow 23.4% in 2023 and 15.9% in 2024." A 2022 forecast for years that have passed; actual 2024 growth was 23.7%. Details.
- "$7.14 billion by 2024" or "$1.32 billion on TikTok in 2024." Superseded: $10.52 billion US spend in 2025, $1.19 billion on TikTok. Details.
- "Influencer marketing returns $5.78 for every $1 spent." No primary study, method or date found.
- "80% of marketers say influencer marketing is effective." A 2019 Mediakix survey, never repeated. Details.
- "TikTok influencers get 13% engagement." A 2021 tool estimate; methods have changed and current estimates are far lower.
- "There are 50 million creators" quoted as a 2026 fact. It is Goldman Sachs' 2023 estimate; keep the date.
- "Influencer marketing is a $24 billion industry." Influencer Marketing Hub's figure for 2024; its 2025 estimate is $32.55 billion, and IAB's US creator ad spend is $37 billion.
The original B2B House guide, archived in full
The B2B House is now part of Kiin. So that every link to its guide still makes sense, the complete original is kept below, section by section, exactly as it was last published (only typos fixed). Figures in it are from the dates its authors gave; the sections above give the current numbers and sources. Open any section to read it.
What is Influencer Marketing
Influencer marketing is a marketing strategy where a influencer, representation or a influential group of people promotes a promote or service through channels like social media. This content is typically seen as “user-generated content” (UGC). Influencers may be paid through cash or noncash payment, such as free products or trips. Influencers are sometimes known as creators. In this article, we will use these two terms interchangeably but they mean the same thing.
How much is being spent on Influencer Marketing?
US marketers is projected to spend $5 billion USD on influencer marketing in 2022. Growth is driven by increased spending from existing brands that already use influencer marketing, and new brands trying influencer marketing. In 2022, 74.5% of marketers from companies with over 100 employees will work with influencers. Even though there are plans to reduce marketing budgets overall, influencer marketing’s spends seem to still increase.
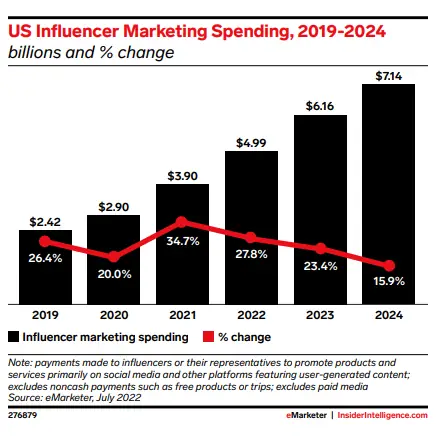
US Influencer marketing spend 2019, 2024
Influencer marketing spend is projected to grow 23.4% and 15.9% YoY in 2023 and 2024. The total projected revenue by 2024 for influencer marketing spend would be $7.14 billion (vs $4.99 billion in 2022). You may find the detailed breakdown of the projections below.
| Year | Influencer marketing spending | % change |
| 2019 | $2.42 | 26.40% |
| 2020 | $2.90 | 20.00% |
| 2021 | $3.90 | 34.70% |
| 2022 | $4.99 | 27.80% |
| 2023 | $6.16 | 23.40% |
| 2024 | $7.14 | 15.90% |
Influencer Marketing Spending, 2019-2024 (billions and % change)
What platform is most used by Influencers and marketers?
Instagram is still the most used platform for influencer marketing following by TikTok, Leading other social platforms by a more than 1.46 billion in 2022. However, the fastest growing channel for Influencer marketing is TikTok in 2022. Instagram is the home to a large number of creators. It offers a wide selection of content formats, most of which allows shoppable moments. Features such as Instagram shopping further ensures that marketers continue to spend their budget on Instagram, especially for lower-funnel activities.
Influencer marketing is traditionally used to generate awareness for a product/service (top of funnel). However, they are now being utilized for mid and lower funnel campaigns as well. Instagram’s lower funnel shopping capabilities ties in nicely to this trend, giving them the largest influencer marketing spends.
According to eMarketer, Influencer marketing spends on TikTok will exceed Facebook in 2022 and YouTube in 2024. There were more marketers who use TikTok for influencer marketing than YouTube in 2021, but it’ll take three more years for spending to catch up. This is due to the high cost of working with a YouTube influencer.
| Platform | Average Spending (Billions) |
| $2.23 | |
| YouTube | $0.95 |
| TikTok | $0.77 |
| $0.74 | |
| Total | $4.99 |
Influencer Marketing Spending, by Platform, 2022 (billions )
Many marketers still consider TikTok as an experimental platform. Social media is moving at a pace where marketers are struggling to keep up. Brands are still not committing to a consistent TikTok strategy even though it’s clear that users are growing faster on that platform.
| Year | YouTube | TikTok | ||
| 2019 | 43.10% | 25.20% | 20.80% | 2.30% |
| 2020 | 43.60% | 23.70% | 19.30% | 5.40% |
| 2021 | 45.00% | 21.00% | 16.50% | 10.20% |
| 2022 | 44.70% | 19.00% | 14.80% | 15.50% |
| 2023 | 44.60% | 13.60% | 17.70% | 17.10% |
| 2024 | 44.50% | 13.30% | 17.20% | 18.50% |
Influencer Marketing Spending Share, by Social Platforms (% of total influencer marketing spending)
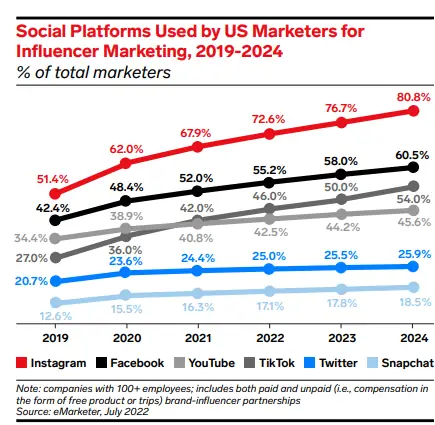
Social platforms used by marketers for influencer marketing 2019-2024
How is TikTok driving influencer marketing spends
Creators are at the core of TikTok’s advertising strategies. Marketers will spend nearly two times more on TikTok influencer marketing by 2024, compared to 2022. A projected amount of $1.32 billion will be spent on TikTok influencer marketing. That is almost ten times higher than 2020 spends. TikTok is building on this growth by focusing on capabilities such as Creator Marketplace and the TikTok Creative Exchange to help brands connect with TikTok influencers.
| Year | TikTok influencer marketing spending | % change | % of total influencer marketing spending |
| 2019 | $0.06 | 2.30% | |
| 2020 | $0.16 | 179.70% | 5.40% |
| 2021 | $0.40 | 156.50% | 10.20% |
| 2022 | $0.78 | 94.60% | 15.50% |
| 2023 | $1.05 | 35.50% | 17.10% |
| 2024 | $1.32 | 25.80% | 18.50% |
More TikTok creators have large followings compared to other platforms
TikTok was traditionally known for micro small influencers in niche categories. They were not taken seriously as a place for commerce until now. TikTok creators have now gathered followings that could exceed other social platforms like Instagram and YouTube. Marketers are starting to realize the potential of leveraging these creators’ following instead of building viral content on their own, which is a huge challenge.
According to Socialblade, lmost 39,000+ account on TikTok have more than 1 million followers (vs 33,000+ on YouTube and 23,000+ on Instagram).
Influencer marketing on TikTok is cheaper than other platforms
Rates on TikTok tend to be cheaper than other platforms as the demand is still lagging behind the supply. TikTok will grow by 26% in 2026, from 2022. This shows a continued strong supply of users. As more marketers start to jump on to TikTok, it will boost the total influencer marketing spends and also increase the rates on TikTok.
What brands pay influencers the most?
How much are creators making on average from brand partnerships on social platforms? Based on an analysis of over 850 influencers by Glewee, here’s a breakdown of influencer earnings on each brand channel:
• Youtube: Influencers earn $425 per video, $250 per product shoutout, and $200 per link in description on average.
• Instagram: Creators earn $225 per feed post, $175 per Instagram reel, and $100 per story.
• Facebook: Creators earn an average of $175 per feed post, and $100 per story.
• TikTok: Influencers earn an average of $175 per feed post.
• Twitter: Creators earn an average of $175 per quote tweet, $100 per tweet, and $100 per retweet.
How do Influencers get paid
There are two typical ways influencers get paid:
• Cash based agreement
• Non-cash agreement
Cash based agreements is the most common way where an influencer gets paid by a company or brand for promoting their brand/service. This could come in the form of a fixed, pre-agreed rate or by commissions or through a mix of both.
Non-cash agreements could be gifts, products, exclusive discounts, and swags. These are less common and many influencers no longer entertain such offers. Some influencers might prefer this route to avoid taxes from cash-based compensation.
The recovery of Travel industry and influencer marketing
While the ongoing virus and inflation is causing some headwinds for the travel industry, it is now back to at least the pre-pandemic levels. The number of travel bookers will rise to 120.0 million in 2022 (vs 90.3 million in 2020).
Travel marketing has rebounded and influencer marketing is a core part of this industry.
According to YouGov, Travel influencers were the 4th most popular type of creators. Almost 11% of adults worldwide say they follow Travel influencers. They were only behind food creators (16%), Celebrities (12%), and health creators (12%). Travel influencers are just as widely followed as fashion, beauty, music, and lifestyle creators.
The above trends are major contributors to the resilience of spending on influencers.
Brand Sponsorships are still the main source of Influencer marketing spends
Monetization tools from platforms like tipping and subscriptions are a smaller portion compared to brand sponsorships. Only 18.6% of creators have reported to receive more than $2,500 from funding pools like TikTok’s creator fund, YouTube shorts fund, and Monetization tools on Facebook/Instagram. In fact, 81.4% of creators received less than $2,500 from these creator funds. The funding from platforms are underwhelming to say the least.
| Received funding | % of creators |
| Yes | 27% |
| No | 73% |
Percentage of Creators who received funding from platforms
| Amount of funds received | % of creators |
| $0-$250 | 18.60% |
| $250-500 | 29.70% |
| $500-1,000 | 17.80% |
| $1,000-2,500 | 15.30% |
| $2,500-5,000 | 9.30% |
| $5,000+ | 9.30% |
Amount of funds received by Creators
Brand sponsorships and partnerships remain the main revenue source due to the low revenue contribution from the creator funds. These funds are meant to be incentives and not as a revenue replacement from brands. Moreover, platforms tend to focus on niches and subsets of creators when it comes to these incentive programs. There will criteria attached to each of the funds, Like the Instagram NFT program, where only a subset of creators can benefit from it.
How Apple’s privacy policy is boosting influencer marketing trends
Apple’s new privacy policy requires all apps to ask for explicit permission from users to track and use their data. Essentially, it gives a user the option to opt-out from the start (Which many users will). It’s no longer an automated opt-in, where users are unaware they are sharing their data.
This greatly impacts targeting and measurements on platforms like Facebook which relies heavy on this tracking. Facebook has attributed up to 10 billion in revenue losses due to this changes.
However, this AppTrackingTransparency (ATT) does not apply to organic content. This means some marketers will shift their budget from directly spending on platform for ads, to creators’ who provide will promote the brand through their organic content/outreach.
Influencer marketing is not a replacement for the lack of tracking in advertising though. But it will help certain marketers while the advertising industry decides on a new standard of privacy.
Brands use creators for ad creatives
With a weaken targeting capability and tracking, it’s more important to stand-out and be more relevant through creatives. Brand continue to turn to creators for ad creatives because it tends to be less disruptive. They don’t interrupt the experience like how a well-polished ad might.
Brands are also moving towards creator-led creatives because most are shot simply with a smartphone, It’s quicker, cheaper and easier to produce.
Challenges with influencer marketing
While the power of influencer marketing is strong, they don’t come without their own challenges. Here are some old, long-term challenges and new struggles in influencer marketing.
Measurement issues in Influencer marketing
What can’t be measured can’t be justified and improved. This would appear like a cost center in front of a CFO. This is one of the biggest pain points in influencer marketing. There’s a lack of standardized metrics for measuring influencer marketing impact. And marketers struggle to show ROI. Measurements also differ between platforms, industries and content formats. This makes is hard to use a benchmark to justify spends as well. In a tough economic conditions, programs that don’t contribute to revenue, and underperforming, or can’t be measured usually gets cut.
However, there is no denying the reach, engagement, and influence that these creators command. Users also prefer following other users/personalities rather than a brand. Case in point, Elon Musk’s twitter has 109.6 million followers (10/23/22) while Tesla’s twitter page only has 17.6 million followers. Common sense would show that businesses should continue to invest in influencer marketing. Common sense isn’t common in many C-suite board meetings though (Which is how big companies fall, but that requires another article on it’s own).
How effective is Influencer Marketing?
According to Mediakix, previously a leading influencer marketing agency, they found that 80% of marketers found influencer marketing effective.
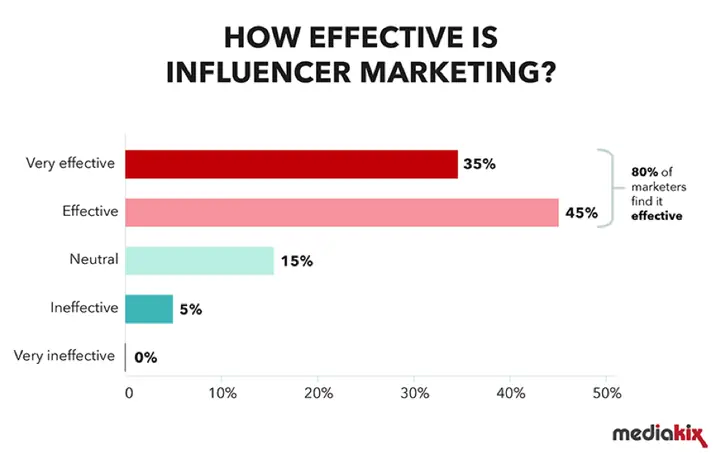
Marketers found influencer marketing effective
Only 5% of marketer said influencer marketing was ineffective and 15% was neutral. No marketer mention that it was ineffective.
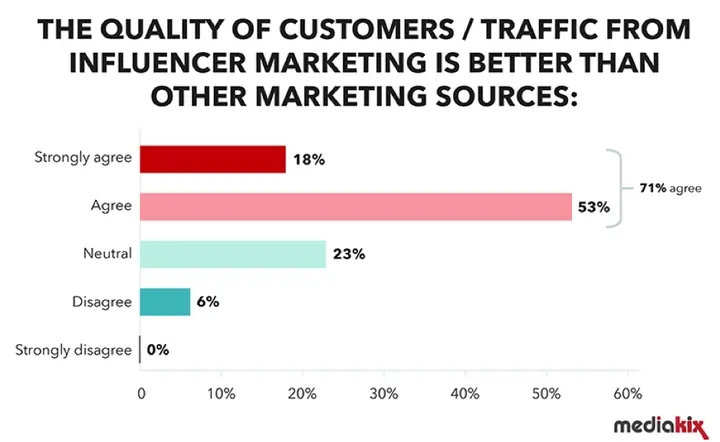
Quality of traffic from Influencer marketing campaigns
71% of marketers also mentioned that the quality of customers and traffic from influencer marketing is better than other marketing sources. Only 6% of marketers disagree that influencer marketing drives good quality prospects.
ROI from Influencer Marketing
Additionally, 89% of marketers mention that they’re seeing ROI from their influencer marketing programs. Only 11% of marketers say that influencer marketing is performing worse than other channels. In our opinion, ROI is subjective. Every marketer measures their success differently. And with measurement issues due to new privacy updates like Apple’s ATT, it will be even harder to attribute success to any marketing campaigns.
Best practices in influencer marketing
With the rapid changes in the influencer marketing space, what exactly should you focus on today and beyond? Here’s a list of best practices you should adopt to maximize returns from your influencer marketing efforts.
• Commit to budget at least $3,000 to $5,000 per month on TikTok to experiment. Prices are still low and it’s a great time to test it if you are new. Existing marketers should review their current investments and double down if results are positive.
• Focus on Instagram reels, Instagram is prioritizing reels now as they try to catch-up with TikTok. Marketers should gear their content to this format to ensure maximum reach.
• When dealing with YouTube creators, ensure that you get them to transform their long-form videos into YouTube shorts as well. You can easily do this with YouTube’s new convertor tool.
• Add shoppable branded content, Creators and marketers should add shopping tags or clear call to actions in their social media posts (Organic and Paid).
• Ensure creators are disclosing the paid partnerships on their posts.
• Explore creator licensing This gives brands access to boost the creator’s posts. Brands will be able to leverage on the creator’s audience data, and use creatives from the creator’s account. Brands will benefit from more organic-looking content, higher engagement, and more targeted audiences.
• Measure the results of your influencer marketing. Set respective goals for awareness, consideration and conversion phases.
Influencer Marketing Platform Market Size (2017 to 2027)
In 2022, it is expected for the influencer marketing platform market size to be valued at 202 million. By 2027, the projected market size will exceed 338 million dollars. Influencer market platform refers to platform and tools that helps clients connect with influencers, manage influencer campaigns, search and discovery of influencer/clients, relationship management, analytics and reporting.
| Influencer marketing platform market size worldwide from 2017 to 2027 | US Dollars |
| 2019 | 148.04 |
| 2020* | 164.12 |
| 2021* | 181.94 |
| 2022* | 201.70 |
| 2023* | 223.70 |
| 2024* | 247.89 |
| 2025* | 274.81 |
| 2026* | 304.65 |
| 2027* | 337.74 |
influencer marketing platform marketing size
How much marketing is spent on Influencer marketing by agencies
Based on Statista, 39 percent of digital and PR agencies allocated 10 to 20 percent of marketing budget to influencer marketing. It’s interesting to see that 5% of PR/Digital agencies spent more than half of their marketing budget on influencer marketing.
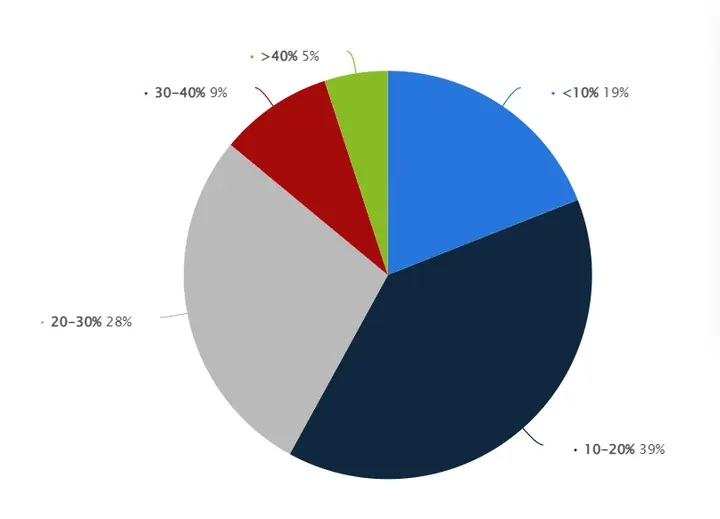
Share of marketing budget spent on influencer marketing by agencies
How many influencers do brands work with?
Statista reported that the majority of brands (54%) work with 0 to 10 influencers. 24% of brands work with 10-50 influencers, while 22% of brands work with more than 50 influencers.
| Number of influencers brands worked with worldwide | % of brands |
| 0-10 | 54% |
| 10-50 | 24% |
| 50-100 | 14% |
| 100-1000 | 5% |
| 1000+ | 3% |
How many influencers do brands work with
Gen Z follows influencers and other experts more than other age groups
Gen Z represents the future buyers of the world. It is important to understand what influences their buying decision and how they do they discover new products and services. 28% of Gen Z respondents reported following influencers and experts, which is the highest compared to Millennials, Gen X and Boomers.
| Age Group | Brands you purchase from/are considering purchasing from | Influencers or other experts |
| Gen Z (16-23) | 33% | 28% |
| Millennials (24-37) | 36% | 23% |
| Gen X (38-56) | 31% | 16% |
| Boomers (57-64) | 22% | 9% |
Share of internet users who follow social media accounts of brands and influencers
Categories Influencers are in on Instagram
According to Statista, 13.80% of influencers focus on Lifestyle topic/category, which is the largest category on Instagram. Beauty (8.56%), Music (8.27%), Photography (6.64%), Family (6.20%), Humor & fun (4.91%), Shows (4.24%, Modeling (3.93%), Cinema (3.81%), Fitness & gym (3.27%) make up the top 10 categories Instagram influencers are in.
| Distribution of Instagram influencers worldwide in 2021, by category and topics | Percentage of Influencers |
| Lifestyle | 13.80% |
| Beauty | 8.56% |
| Music | 8.27% |
| Photography | 6.64% |
| Family | 6.20% |
| Humor & fun & happiness | 4.91% |
| Shows | 4.24% |
| Modeling | 3.93% |
| Cinema & actors/actresses | 3.81% |
| Fitness & gym | 3.27% |
Categories Influencers are in on Instagram
Topics and categories on Instagram with the most follower growth
The most popular topic on Instagram with the fastest follower growth for Influencers is Music (+632% year over year). Humor and happiness (579%), Literature & Journalism (340%), Cinema (200%), and Travel (137%) make up the top 5 topics in the world.
| Most popular Instagram influencer topics worldwide in 2020, based on average annual growth of followers | Follower Growth in Percentage |
| Music | 632% |
| Humor & fun & happiness | 579% |
| Literature & journalism | 340% |
| Cinema & actros/actresses | 200% |
| Travel | 137% |
Topics on Instagram with the most follower growth
Average Price Per Post for Instagram Influencers
Mega-influencers (with more than 1M) charge an average minimum price of $1,118 per post. Macro-influencers with followers from 100k, 1M charge a minimum price of $165 to a maximum price of $1,804 per post. Nano-influencers, with followers of 1k -5k, charge from $10 to $41 per post.
| Average price per post of Instagram influencers worldwide, by number of followers | Average Minimum Price | Average Maximum Price |
| Nano-influencers (1K-5K) | $10 | $41 |
| Micro-influencers (5K-20K) | $15 | $85 |
| Mid-influencers (20K-100K) | $33 | $296 |
| Macro-influencers (100K-1M) | $165 | $1,804 |
| Mega-influencers (over 1M) | $1,118 |
Average Price Per Post for Instagram Influencers
Earned media value from Instagram Influencer Posts
Earned media value refers to the monetary amount a brand gains from an influencer’s post/content. It assigns a calculatable value from the engagement of the influencer’s partnership content with brands.
| Average earned media value (EMV) of Instagram influencer posts worldwide in 2020, by number of followers (in U.S. dollars) | Average minimum EMV | Average maximum EMV |
| 1,000 to 5,000 | $9 | $75 |
| 5,000 to 20,000 | $35 | $223 |
| 20,000 to 100,000 | $128 | $657 |
| 100,000 to 1,000,000 | $1,155 | $4,311 |
| 1,000,000 and above | $5,133 |
Earned media value from Instagram Influencer Posts
Instagram Influencer Engagement Rates
Instagram influencers with less than 15,000 followers normally see an average of 3.86% engagement rate on each post. Engagement rates starts to decrease as the follower count increases. The engagement rates of 15,000 to 50,000 followers (2.39%), 50,000-100,000 followers (1.87%), 100,000-500,000 (1.62%), 500,000-1,000,000 (1.36%), >1,000,000 (1.21%) amounts to an average of 2.05% engagement rate (baseline) across each Instagram influencer post.
| Instagram influencers’ follower count | Engagement Rates |
| <15,000 | 3.86% |
| 15,000-50,000 | 2.39% |
| 50,000-100,000 | 1.87% |
| 100,00-500,000 | 1.62% |
| 500,000-1,000,000 | 1.36% |
| >1,000,000 | 1.21% |
Instagram influencer engagement rates based on follower counts
How many followers do Instagram influencers have?
44.13% of Instagram influencers have 5,000-20,000 followers. The second most popular group are the nano-influencers (1,000-5,000 followers) with 27.86% of influencers being in this category. Influencers with 20,000-100,000 followers account for 22.73% of influencers, and celebrities with more than 1M followers make up 0.34% of influencers.
| Instagram Influencers’ follower count | Percentage of influencers with this follower count |
| 1,000 to 5,000 | 27.86% |
| 5,000 to 20,000 | 44.13% |
| 20,000 to 100,000 | 22.73% |
| 100,000 to 1,000,000 | 4.96% |
| 1,000,000 and above | 0.34% |
How many followers do influencers typically have
YouTube influencer engagement rate
YouTube influencers with less than 15,000 follower tend to see a higher baseline of engagement rate, 1.63%. The next highest engagement rate baseline would be 0.51% with YouTube Influencers with followers of 15,000-50,000. On average, the engagement rate across all YouTube influencer is 0.61%.
| YouTube influencer’s follower count | Engagement rate |
| <15,000 | 1.63% |
| 15,000-50,000 | 0.51% |
| 50,000-100,000 | 0.46% |
| 100,00-50,000 | 0.43% |
| 500,000-1,000,000 | 0.44% |
| >1,000,000 | 0.37% |
YouTube Influencer engagement rate
Most popular categories for YouTube influencers.
19.55% of YouTube influencers are posting videos in the Music and Dance category, making it the most popular. The next most popular categories are Animation (9.19%), Video Games (7.72%), Humor (7.09%), Design and art (6.88%), Daily vlogs (5.47%), Science and technology (4.63), Movies (4.43%), DIY (3.94%).
| Topic and Categories on YouTube | Percentage of Influencers |
| Music and dance | 19.55 |
| Animation | 9.19 |
| Video games | 7.72 |
| Humor | 7.09 |
| Design and art | 6.88 |
| Daily Vlogs | 6.29 |
| News and politics | 5.47 |
| Science and technology | 4.63 |
| Movies | 4.43 |
| DIY | 3.94 |
Most popular categories on YouTube for influencers
Average cost per post for YouTube Influencer
Mega-Influencers on YouTube with over 1M charge a minimum of $7,332 per post on YouTube. The next highest would be influencers with 100k-1M followers ($1,306 to $4,061), mid-influencers with 20k-100k followers ($389 to $1859), Micro-influencers with 5k-20k followers ($168 to $1,240), and nano-influencers with 1k-5k followers ($60 to $793).
| Influencers based on the number of followers | Average minimum price | Average maximum price |
| Nano-influencers (1K-5K) | $60 | $793 |
| Micro-influencers (5K-20K) | $168 | $1,240 |
| Mid-influencers (20K-100k) | $389 | $1,859 |
| Macro-influencers (100k-1M) | $1,306 | $4,061 |
| Mega-influencers (over 1M) | $7,332 |
Average cost per post for YouTube Influencer
Engagement Rate of TikTok Influencers
Mega-influencers (over 1M followers) have the highest engagement rate of 13.70%, followed by Micro-influencers (5k-20k followers) with 13.33% engagement rate, Macro-influencers (100k-1M followers) at 13.09% engagement rate, Mid-influencers (20k-100k) at 12.93% engagement rate, and Nano-influencers (1k-5k)- at 12.43% engagement rate.
| Types of TikTok Influencers based on Number of followers | Engagement Rate |
| Nano-influencers (1K-5K) | 12.43% |
| Micro-influencers (5k-20K) | 13.33% |
| Mid-influencers (20K-100K) | 12.93% |
| Macro-influencers (100K-1M) | 13.09% |
| Mega-influencers (over 1M) | 13.70% |
Engagement rate of TikTok Influencers
Distribution of TikTok Influencers by number of followers
According to Statista, 50.51% of TikTok influencer have about 1,000 to 5,000 followers on TikTok. 29.93% of influencers were reported to have 5,000 to 20,000 followers, making it the second largest group. And 15.20% of TikTok Influencers command 20,000 to 100,000 followers.
| Number of Follower on TikTok | Percentage of TikTok Influencers |
| 1,000 to 5,000 | 50.51 |
| 5,000 to 20,000 | 29.93 |
| 20,000 to 100,000 | 15.20 |
| 100,000 to 1,000,000 | 4.12 |
| 1,000,000 and above | 0.24 |
Distribution of TikTok Influencers by number of followers
Conclusion
Influencer marketing is still small ($7B Spending) compared to the entire Digital Marketing ad ecosystem ($293.34). However, it is still growing even with a recurring pandemic and a likely recession, showing it’s resilience. Influencer marketing allows marketers to authentically reach out to large sets of audiences immediately, instead of building from scratch. Moreover, as Social media platforms continues to enhance features for influencers, we’ll continue to see more budgets shift into influencer marketing.
• Tags:
• marketing
Influencer marketing statistics: frequently asked questions
How big is the influencer marketing industry in 2026?
US creator advertising spend was $37 billion in 2025, up 26%, and IAB forecasts $44 billion for 2026. Influencer Marketing Hub estimates the global influencer marketing industry at $32.55 billion in 2025. Goldman Sachs expects the wider creator economy to reach $480 billion by 2027. The figures differ because they measure different things.
How much do US brands spend on influencer marketing?
eMarketer forecast $10.52 billion of US spend on paid influencer posts in 2025, with 15.7% growth in 2026. IAB's broader measure, which includes paid amplification of creator content, was $37 billion in 2025.
Which platform gets the most influencer marketing spend?
YouTube, at a forecast $3.45 billion in the US in 2025, ahead of Instagram ($3.17 billion) and TikTok ($1.19 billion) (eMarketer). Instagram is still the most used: 85% of brands name it their most common creator platform (CreatorIQ, 2025).
Is influencer marketing spending still growing?
Yes. 87.49% of respondents to Influencer Marketing Hub's 2026 Benchmark Report (a survey of 600+ marketers) expect budgets to rise, 62% of enterprise marketers are increasing budgets in 2026 (Linqia), and IAB says creator ad spend grows about four times faster than the media industry.
What is the ROI of influencer marketing?
There is no reliable single figure. 81% of enterprise marketers say creator content outperforms brand-created assets, but 79% struggle to measure ROI and 48% say attribution is their biggest gap (Linqia, 2026). The often-quoted "$5.78 per $1" has no primary source we could find.
How big is the creator economy?
Goldman Sachs estimated it at $250 billion in 2023 and expects $480 billion by 2027, with about 50 million creators of whom about 4% earn more than $100,000 a year. YouTube says it paid more than $100 billion to creators, artists and media companies from 2022 to 2025.
Do consumers trust influencers?
Only 5% of US consumers completely trust influencer content and 74% trust it at least somewhat, against 87% for advertising in general; 58% have bought because of an influencer endorsement, and 70% feel deceived by undisclosed partnerships (BBB National Programs, 2025).
What are the FTC rules for influencers?
The FTC's Endorsement Guides, updated in June 2023, require clear and conspicuous disclosure of any material connection, cover virtual influencers and tags, and make brands and intermediaries potentially liable. Its Rule on Consumer Reviews and Testimonials, in force since 21 October 2024, bans fake reviews and buying fake followers or views to misrepresent influence.
Does influencer marketing work for B2B?
Increasingly, mostly on LinkedIn. LinkedIn's creator-led ads grew 63% year on year in July to September 2026. In the Kiin panel, half of LinkedIn advertisers ran thought leader ads in September 2026, and they engage at a median 4.7% against 1.2% for company-page ads, at a higher CPM ($74.71 vs $48.80 in the same accounts).
What are LinkedIn thought leader ads and BrandLink?
Thought leader ads let a company promote a post from a person, an employee, founder or outside creator who approves it. BrandLink places video ads before creator and publisher videos on LinkedIn; LinkedIn reports a 130% higher completion rate than standard video ads.
What happened to The B2B House influencer marketing statistics page?
The B2B House is now part of Kiin. Its influencer marketing statistics are on this page, with every figure it published kept in the section "Figures previously published by The B2B House", next to the 2026 figure.
How we built this page, and every source
We started from every statistic in The B2B House guide and every claim other sites link to it for (we checked its backlinks one by one). For each, we looked for the newest figure from the original publisher first: IAB, eMarketer, Goldman Sachs Research, platform pressrooms (LinkedIn, YouTube), the FTC, Pew Research Center, and the annual surveys of Influencer Marketing Hub, Linqia and CreatorIQ. We opened each source page in November 2026 and copied the figure from it; where a publisher blocked access (eMarketer) we confirmed the figure in a named report of it and link both. Surveys are labelled as surveys with their sample. Where there is no update we say so and keep the old figure with its date. Kiin's own LinkedIn figures come from the Kiin Labs panel, described in our method note. Corrections: [email protected].
- IAB, 2025 Creator Economy Ad Spend & Strategy Report (20 Nov 2025)
- IAB press release, Creator economy ad spend to reach $37 billion in 2025
- IAB/PwC Internet Advertising Revenue Report, full year 2025 (16 Apr 2026)
- eMarketer, US influencer marketing spending will surpass $10 billion in 2025
- Tubefilter, eMarketer YouTube influencer marketing forecast (19 Mar 2025)
- Influencer Marketing Hub, Influencer Marketing Benchmark Report 2026 (survey, 600+ respondents, 4 May 2026)
- Influencer Marketing Hub, Influencer marketing statistics (market size estimates)
- Goldman Sachs Research, The creator economy could approach half a trillion dollars by 2027 (19 Apr 2023)
- Linqia, 2026 State of Influencer Marketing (200+ enterprise marketers)
- CreatorIQ, State of Creator Marketing 2025 to 2026 (1,723 respondents, 1 Oct 2025)
- YouTube, How YouTube works: YouTube's impact
- BBB National Programs, 2025 Influencer Trust Index (26 Jun 2025)
- Pew Research Center, America's News Influencers (18 Nov 2024)
- FTC, Updated Endorsement Guides (29 Jun 2023)
- FTC, Final rule banning fake reviews and testimonials (14 Aug 2024)
- FTC, Consumer Reviews and Testimonials Rule: Questions and Answers
- LinkedIn, Q1 FY27 business highlights (28 Oct 2026)
- LinkedIn, Q3 FY26 earnings highlights (30 Apr 2026)
- LinkedIn, BrandLink and video update (30 Apr 2025)
- Net Influencer, LinkedIn expands video ad program (LinkedIn figures via Reuters, Aug 2025)
- Reuters via The Star, LinkedIn launches new effort to capture business advertisers (10 Jun 2026)
- Kiin Labs, 150 LinkedIn Ads Statistics and LinkedIn Ads Benchmarks 2026
Ilic, P. (2026). Influencer Marketing Statistics 2026: Spend, Platforms, ROI and B2B. Kiin Labs (incorporating The B2B House). kiin.co/research/influencer-marketing-statistics. Free to cite with a link.
Running creator or thought leader ads on LinkedIn? Send read access to your LinkedIn Ads account and we'll show you where your thought leader, video and company-page ads sit against 1,000+ connected accounts. Free, read-only, one page.