
Spending on LinkedIn to build your brand? I’ll show you your real reach, frequency and influenced pipeline against our $65M+ panel in a free 30-minute call. Book my free brand benchmark with Phil →
Ilic, P. (2026). B2B Brand Awareness in 2026: Why It Works, How to Build It and How to Measure It. Kiin Labs (incorporating The B2B House). https://kiin.co/blog/b2b-brand-awareness
- The key B2B brand awareness numbers
- What is B2B brand awareness, and why is it an asset?
- Why does brand awareness matter in B2B?
- How much should B2B companies spend on brand?
- How do you build B2B brand awareness?
- How do you build brand awareness on LinkedIn?
- How do you measure B2B brand awareness?
- B2B brand awareness campaign examples
- Figures previously published by The B2B House
Also: claims we no longer recommend · FAQ · every source
What are the key B2B brand awareness numbers in 2026?
If you only need one table, this is it. Every figure was checked on the page or report it comes from on 14 November 2026. The rest of the guide explains what each one means and how to use it.
| Statistic | Figure | Date | Source |
|---|---|---|---|
| B2B buyers in the market in a given quarter | about 5% (95% are not) | May 2021 | John Dawes, Ehrenberg-Bass / LinkedIn B2B Institute |
| Companies that change their main bank or law firm | about once every 5 years | May 2021 | Dawes, 95-5 rule |
| Best B2B budget split, brand building to sales activation | 46% : 54% | 2019 (IPA cases 1998 to 2018) | Binet and Field, The 5 Principles of Growth in B2B Marketing |
| Market share gain per 10 points of extra share of voice, B2B | 0.7 points a year (B2C: 0.6) | 2019 | Binet and Field |
| B2B marketers who measure impact beyond six months | 4% | 2019 LinkedIn survey | B2B Institute foreword |
| Very large business effects per campaign: fame vs activation goals | 2.2 vs 0.7 | IPA B2B cases 1998 to 2018 | Binet and Field, Fig. 8 |
| B2B marketers increasing brand-building budgets | over two-thirds | 2024 survey, 2,000+ marketers | LinkedIn 2024 B2B Marketing Benchmark, via TopRank |
| LinkedIn ads' share of sessions at the SQL stage | 30.2% | Mar 2026 (2025 data) | Dreamdata 2026 |
| Average time from first LinkedIn ad impression to revenue | 281 days | Mar 2026 | Dreamdata 2026 |
| Closed deals where organic Company Page impressions appear | 17.9% | Mar 2026 | Dreamdata 2026 |
| Win rate (SQO to closed-won) of outbound deals exposed to LinkedIn ads vs all outbound | 21.09% vs 16.96% | Dec 2025 (2023 to Feb 2024 data) | HockeyStack Labs |
| Median influenced revenue per $1 of LinkedIn spend | 7.0x | Aug 2026 (Aug 2025 to Jul 2026) | Fibbler 2026, 1,000+ advertisers |
| Median CPM, LinkedIn brand awareness objective | $41.04 | Aug 2026 | Fibbler 2026 |
| Extra people reached per dollar, brand awareness vs engagement objective | +77% | 2026 | Kiin Labs Report No. 1 |
| Minimum budget for a LinkedIn Brand Lift test (one question) | $60,000 | Nov 2026 | LinkedIn Help |
| LinkedIn members / companies on LinkedIn | 1.4 billion+ / 71 million | Nov 2026 | LinkedIn About Us |
Cite: "About 95% of B2B buyers are not in the market in a given quarter, and the IPA data puts the best B2B split at 46% brand, 54% activation." Kiin Labs, kiin.co/blog/b2b-brand-awareness#key-numbers
What is B2B brand awareness, and why is it an asset?
B2B brand awareness is the share of potential buyers who know your brand and, more usefully, who think of it when they face a buying situation in your category. The second part is what the Ehrenberg-Bass Institute calls mental availability: the chance that your brand comes to mind when a buyer has a need. Being recognised when someone hears your name is awareness. Being thought of when the need arises, without a prompt, is salience. Being talked about across the market is fame.
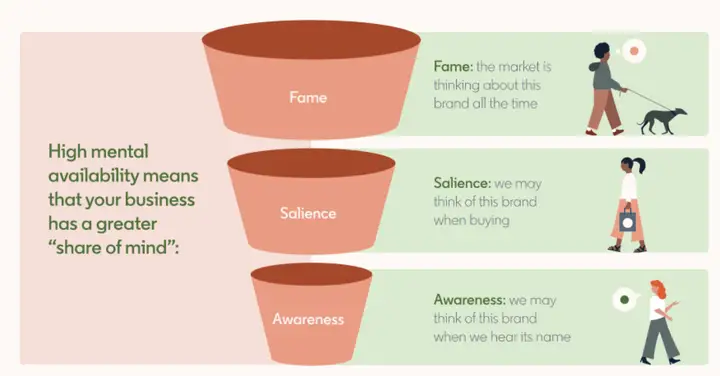
Brand awareness and brand equity are related but not the same. Awareness is whether people know and recall you. Equity is what that recall is worth: the price premium, preference and loyalty it creates. Over the last two decades companies have put more weight on intangible assets like these, because they cost money and time to build, they can be sold, and a competitor would often rather buy one than build its own. A strong brand is valued because it makes future sales more likely.
The practical test is simple. When a company in your category decides to buy next quarter, will the person running the search already have your name on the list? Ehrenberg-Bass measures this through category entry points, the situations in which someone might buy or use the category, such as "our current vendor just raised prices" or "we are opening an office in Germany". In John Dawes' 2021 paper for the B2B Institute, many well-established brands are linked to a given entry point by only 20 to 30% of buyers, and even market leaders often reach only 50%. Getting to double-digit mental availability is, in his words, a multi-year task (Dawes, Advertising effectiveness and the 95-5 rule, 2021).
Research from the same programme found that lack of awareness is a much bigger problem than active rejection of a B2B brand (LinkedIn B2B Institute and Ehrenberg-Bass, How B2B Brands Grow). Most buyers who do not choose you never thought of you; they did not consider you and say no.
Most of this thinking traces back to Byron Sharp's book How Brands Grow (Oxford University Press, 2010), built on the Ehrenberg-Bass Institute's research: brands grow mainly by winning more buyers (penetration), by being easy to think of in buying situations (mental availability) and easy to buy (physical availability), and by using consistent distinctive assets such as colours, characters and taglines. The B2B House's book summary of How Brands Grow now lives on this page; the B2B application is the LinkedIn B2B Institute work cited below.
Why does brand awareness matter in B2B?
Because at any moment almost all of your future customers are not buying, and when they start, they shortlist the brands they already know. Marketers often treat brand awareness as a B2C activity and point B2B budgets at people who are ready to buy now. The evidence says that leaves most of the market untouched.
The 95-5 rule
Professor John Dawes of the Ehrenberg-Bass Institute set out the 95-5 rule in a paper published by the LinkedIn B2B Institute in May 2021. Companies change providers such as their main bank or law firm about once every five years on average. That means only about 20% of business buyers are in the market over a whole year, and about 5% in any quarter: 95% are not in the market (LinkedIn B2B Institute, 95-5 rule). LinkedIn's page on the rule adds that 75% of companies buy computers once every 4 years and 80% change banking services once every 5 years.
Dawes is careful to say the 95% "is not meant to be a precise rule". It is a heuristic, and you can calculate your own number: if your category's average time between purchases is two years, about 50% of buyers are in the market over a year and about 13% in a quarter. The consequence is the same. Advertising mostly reaches people who will not buy soon, so it works by building and refreshing memory links to the brand, which activate when the buyer comes into the market. When buyers do search, they strongly prefer brands they are familiar with, and click-through rates for unfamiliar brands are lower.
The benefits of strong brand awareness
The B2B House studied the common traits of strong B2B brands such as Salesforce, Adobe and GE and listed six benefits. They still hold, and most now have evidence behind them:
| Benefit (as The B2B House listed it) | What the evidence says in 2026 |
|---|---|
| Strong brands can offer a wider range of products and pivot when needed | Consistent with Binet and Field: brand effects make activation work harder across the range (IPA B2B cases, Fig. 11, 2019). |
| A lasting competitive advantage and market dominance | Competitors find mental availability "very difficult to catch up" with (Dawes, 2021). |
| Customers are more loyal, even when buying is hard or the price is not the best | Loyalty is mostly a side effect of penetration: bigger brands have more buyers and slightly more loyal ones (Double Jeopardy, How B2B Brands Grow). |
| Longer mental availability carries a brand through long sales cycles | The average first LinkedIn impression comes 281 days before revenue (Dreamdata, 2026). |
| Less price sensitivity and higher profitability over time | Brand building reduces price sensitivity (Binet and Field, 2019). Only 30% of B2B marketers believed advertising affects pricing power (LinkedIn survey, 2019). |
| Stronger brands attract more talented employees | LinkedIn now offers employer familiarity, favourability and consideration as standard Brand Lift questions (LinkedIn Marketing API docs, 2026). |
Sources: Binet and Field, The 5 Principles of Growth in B2B Marketing; How B2B Brands Grow; Dreamdata 2026; LinkedIn Brand Lift Testing docs. Fetched 14 Nov 2026.
Brand awareness often produces short-term sales too, but it is most effective as a long-term growth strategy. As out-of-market buyers move into the market, the ones who already know you are more likely to consider you, and often to pre-select you. For a wider view of how B2B buyers research and buy, see our B2B marketing statistics.
Cite: "Only about 5% of business buyers are in the market in any quarter, so B2B advertising works mainly by building memory before the purchase (Dawes, Ehrenberg-Bass, 2021)." Kiin Labs, kiin.co/blog/b2b-brand-awareness#why
How much should B2B companies spend on brand awareness?
The best evidence says roughly half: about 46% of the budget on brand building and 54% on sales activation, against 60:40 in B2C. That is the finding of Les Binet and Peter Field's analysis of B2B cases in the IPA Databank from 1998 to 2018, published by the LinkedIn B2B Institute in 2019 as The 5 Principles of Growth in B2B Marketing. The B2B Institute's page for the report now rounds the advice to a 50/50 split.
Two caveats come from the authors themselves. The B2B sample is small, under 50 cases, and the IPA databank is biased towards effective campaigns with large budgets. Treat 46:54 as a direction, not a law. And the right mix varies by category, price and how long your sales cycle is.
Share of voice vs share of market
Share of voice (SOV) is your advertising spend, or presence, as a share of all advertising in your category. Share of market (SOM) is your revenue as a share of the category's revenue. Brands whose SOV is above their SOM tend to grow, and the gap is called extra share of voice (ESOV). Binet and Field found the rule holds in B2B almost exactly as in B2C: for consumer brands, 10 points of ESOV raises market share by 0.6 points a year; for B2B brands, by 0.7 points.
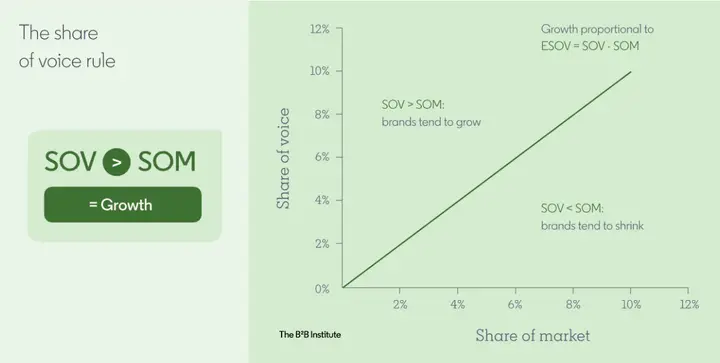
How to estimate both:
- Share of voice. Ask your platform representatives; LinkedIn reps can estimate your share of voice among a target audience. Or calculate a proxy from brand mentions: your mentions divided by your mentions plus your competitors' mentions (HubSpot's share of voice guide shows the method). On LinkedIn you can also compare your impressions in a target audience with what the Forecasting tool says the audience can deliver.
- Share of market. Add your competitors' revenue to yours to get the market total. If revenue is not available, use units sold or number of clients.
- Set the gap. Decide the market share you want, set share of voice above it, then work out the spend needed to get there.
Until you can quantify both, the practical rule from The B2B House still stands: grow share of voice by buying more reach and frequency in your target audience. In our LinkedIn Ads benchmarks the median LinkedIn CPM across the Kiin panel is $36.23, which is the starting point for working out what a given level of reach will cost.
Cite: "In B2B, 10 points of extra share of voice grows market share by about 0.7 points a year, and the best budget split is about 46% brand, 54% activation (Binet and Field, IPA data, 2019)." Kiin Labs, kiin.co/blog/b2b-brand-awareness#budget
How do you build B2B brand awareness?
Four things build brand awareness: more share of voice, reaching your whole category rather than only current customers, building mental availability with distinctive and repeated exposure, and emotional messaging. The B2B House listed these four in 2022 and the evidence behind each has only grown.
1. Increase your share of voice
Covered in section 04: spend above your market share, and measure it as reach and frequency among the people who buy in your category.
2. Grow your customer base through reach, not loyalty
Binet and Field found in the IPA B2B cases from 2008 to 2018 that customer acquisition strategies are much more effective than loyalty strategies, and reach strategies, which talk to customers and non-customers together, are the most effective of all. Broad reach brings in new buyers and also reassures existing clients. Loyalty is largely a predictable function of market share (the Double Jeopardy law), so a business cannot grow sustainably on loyalty alone. In LinkedIn's 2019 survey, more than 65% of B2B marketers still believed businesses grow by increasing loyalty (B2B Institute, 2019).
Buying committees change, so keep your picture of them current. Dreamdata's 2026 data counts an average of 10 stakeholders and 88 touchpoints per B2B buying journey, and 81% of the journey happening outside the sales pipeline (Dreamdata, March 2026). Reach the people who influence the decision, not only the person who signs.
3. Increase mental availability
Mental availability, or share of mind, grows when your brand is linked to buying situations, repeatedly, in a way people remember. Recommendations that still hold:
- Maximise reach across the whole buyer category.
- Use clear, distinctive copy and creative, and keep it consistent so each exposure adds to the last.
- Increase frequency of brand exposure, within limits (see section 07).
- Use video. In the Kiin panel, LinkedIn video gets 42% more dwell time than an image in the same account, though it costs 18% more per landing page click (LinkedIn video ads benchmarks, 676 advertisers).
- Target current and future buyers. Do not hyper-target; the 95% are by definition not showing intent yet.
- Drive engagement with both paid and organic activity, including posts from your founders and experts.
4. Use emotional messaging
The IPA data shows that B2B buying is only slightly more rational than B2C, and that the pattern of effects is the same: rational messages work for short-term activation, emotional messages build the brand over the long term. Campaigns whose main objective was fame, getting talked about and shared, reported an average of 2.2 very large business effects, against 1.6 for awareness goals and 0.7 for activation goals (Binet and Field, Fig. 8, IPA B2B cases 1998 to 2018).
The reason is the same 95-5 logic. People who are not buying screen out product messages, but they will pay attention to advertising that is engaging, and remember it. Prime them with repeated, memorable exposure before they come to market. When they do, more rational messages help you cash in that brand strength.
How do you build brand awareness on LinkedIn?
Use the brand awareness objective with broad, category-wide targeting for cold reach, add video and thought leader content for attention, and switch to engagement and website objectives for smaller, warmer audiences. The approach works on any channel, but for B2B we recommend starting with LinkedIn Ads: people visit it with a professional goal, and it lets you reach a whole buying group, not just one contact. LinkedIn now has more than 1.4 billion members and 71 million companies (LinkedIn About Us, November 2026); more in our LinkedIn statistics.
The B2B House's guide mapped organic and paid formats and targeting to each phase of an awareness programme. Here is that plan, as published:
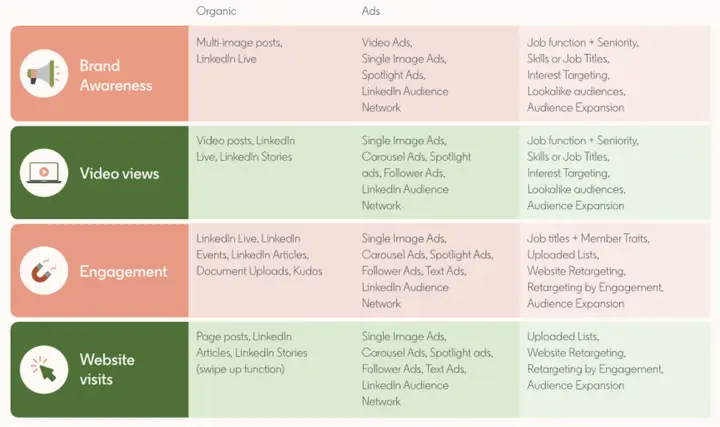
What we would change in 2026:
| Phase | Audience | Objective and formats in 2026 |
|---|---|---|
| Brand awareness | Whole buying committee or total addressable market, cold, 30,000+ people | Brand awareness objective (reach or impressions), single image, video, thought leader ads, CTV where budget allows |
| Video views and attention | Same broad audience | Short video and thought leader video; build video retargeting pools |
| Engagement | Under 10,000 people, uploaded account lists, video and engagement retargeting | Engagement objective, document ads, thought leader ads, events |
| Website visits and demand capture | In-market: website visitors, engaged accounts | Website visits or lead generation, conversation ads, retargeting |
Audience thresholds from Kiin Labs Report No. 1, engagement vs brand awareness. Format availability per LinkedIn Campaign Manager, Nov 2026.
Which LinkedIn objective is best for brand awareness?
On big cold audiences, the brand awareness objective. Paired within 36 accounts running both objectives, brand awareness reached 77% more people per dollar than engagement and paid 39% less per impression, while a landing page click cost the same on each ($17.24 vs $17.22). On a cold audience of 30,000 or more it reached 184% more people at a 59% lower CPM. Under 10,000 people engagement wins, because there is nobody extra to reach (LinkedIn engagement vs brand awareness).
Fibbler's 2026 benchmarks, across 1,000+ B2B advertisers and $200M+ of spend, put the spend-weighted CPM for the brand awareness objective at $41.04, with a 0.49% CTR, against $59.90 for engagement and $121.77 for lead generation (Fibbler, August 2026; identified companies only, so CPMs run higher than in Campaign Manager).
| LinkedIn objective (Fibbler 2026) | CTR | CPC | CPM |
|---|---|---|---|
| Brand awareness | 0.49% | $8.31 | $41.04 |
| Engagement | 1.56% | $3.84 | $59.90 |
| Website visits | 0.22% | $16.84 | $36.85 |
| Video views | 0.03% | $140.35 | $36.41 |
| Lead generation | 0.12% | $105.81 | $121.77 |
Source: Fibbler, LinkedIn Ads Benchmarks 2026, spend-weighted, Aug 2025 to Jul 2026.
Reach optimisation, forecasting and frequency caps
Under the brand awareness objective you can optimise for reach, which maximises the number of unique members who see your ads, or for impressions. The Forecasting panel in Campaign Manager shows expected reach and frequency before you launch. Since July 2025 LinkedIn has also offered a frequency cap on brand awareness ad sets across the feed, Audience Network and CTV: you can leave it on default or set a cap of 3 to 30 impressions per member in seven days. LinkedIn notes delivery can exceed the cap, so treat it as a preference, not a ceiling (LinkedIn Help, frequency cap).
People, not just pages: founders and thought leader ads
People pay more attention to people than to logos. Thought leader ads, which promote a post from an employee's own profile, had a median CTR of 1.35% in Fibbler's 2026 data, against 0.38% for single image ads. Building the founder's and experts' own audiences organically, then promoting their best posts, is how many B2B brands now build awareness on LinkedIn. Our founder content service does exactly this.
How do you measure B2B brand awareness?
Measure brand awareness on LinkedIn in three layers: whether you reached the right accounts often enough (reach and frequency), whether it changed what they think (brand lift), and whether the accounts you reached turned into pipeline (influenced pipeline). Then judge it over a year or more, not a quarter. In LinkedIn's 2019 survey, only 4% of B2B marketers measured impact beyond six months, and Dreamdata now puts the average first LinkedIn impression 281 days before revenue.
Layer 1: reach and frequency in your target accounts
- Penetration rate: the share of your target audience that saw your ads at least once in the month. We aim for 50% or more.
- Frequency, measured at the account level. Campaign Manager reports frequency per campaign, which undercounts: in Kiin data, campaigns reported 3.5 while the account delivered 9.5 to the same people (LinkedIn ad frequency and fatigue). Engagement on a creative falls 9% once everyone has seen it once and 22% after five times, so refresh creative by audience size, not by the calendar.
- Companies reached. Fibbler's median cost per company reached is $1.20, and $11.42 per company influenced (engaged).
Layer 2: brand lift
LinkedIn's Brand Lift test splits your audience into exposed and control groups and surveys both. Questions include ad recall, aided awareness, top-of-mind awareness, familiarity, favourability, consideration and recommendation, plus employer brand versions. The test has no separate fee, but it is not free in practice: you need $60,000 budgeted for one question, $90,000 for two, and $45,000 for each additional question, over a test of 14 to 90 days (LinkedIn Help, Create a Brand Lift test). Below that budget, use a simple survey of your target market once or twice a year, asking which brands come to mind in your main buying situations.
Layer 3: influenced pipeline
Brand campaigns should show up in pipeline months later. The evidence that they do, by association:
| Finding | Figure | Source |
|---|---|---|
| LinkedIn ads' share of sessions at MQL / SQL / new business stage | 24.2% / 30.2% / 28.3% | Dreamdata 2026 |
| Average days from first ad impression / engagement / conversion to revenue | 281 / 212 / 214 | Dreamdata 2026 |
| Organic Company Page impressions present in MQLs / SQLs / closed deals | 9.4% / 15% / 17.9% | Dreamdata 2026 |
| LinkedIn ROAS vs Google Search vs Meta | 121% / 67% / 51% | Dreamdata 2026 |
| Win rate, outbound deals with LinkedIn ad impressions vs all outbound | 21.09% vs 16.96% | HockeyStack Labs |
| Sales cycle, outbound deals with LinkedIn impressions vs none | 76 vs 84 days | HockeyStack Labs |
| Median influenced pipeline / revenue per $1 of LinkedIn spend | 41.5x / 7.0x | Fibbler 2026 |
Dreamdata: 66M+ sessions and 3.5M+ customer journeys, published 10 Mar 2026. HockeyStack: 50+ B2B SaaS companies, Jan 2023 to Feb 2024, published 15 Dec 2025. Fibbler: 1,000+ advertisers, Aug 2025 to Jul 2026, published Aug 2026. All are association, not proof of cause. Fetched 14 Nov 2026.
The organic Company Page figure matters for awareness: Company Page posts that nobody paid to promote still turn up in almost one in five closed deals, an average of 90 days before revenue. Brand on LinkedIn is not only ads.
The full metric list
The B2B House listed eleven metrics for awareness campaigns. Here is each with how we would measure it now:
| Metric (The B2B House, 2022) | How to measure it in 2026 |
|---|---|
| % growth in impressions and reach of target audience or accounts | Penetration rate and account-level frequency in your target list, monthly |
| % growth in website visitors from branded search | Branded search impressions and clicks in Google Search Console |
| Website visitors from your ideal customer profile | Company-level visitor identification against your account list |
| Engagement rate (likes, comments, shares, mentions) | Engagement rate by audience; a signal, not a goal. Fibbler's median is 0.82% for sponsored content |
| Brand sentiment | Social listening, plus favourability in a Brand Lift test |
| Share of voice | Impression share from your LinkedIn rep, or mention share |
| Content consumption by your ICP | Video view rates and dwell time by company and job function |
| Follower or subscriber growth | Company Page and founder followers from target accounts |
| Mentions from analysts and influencers | Still useful; now also mentions in AI assistant answers |
| Speaking slots at large events | Still useful for category fame |
| Brand lift ("free on LinkedIn") | No fee, but a $60,000 budget minimum for one question (see Layer 2) |
The guide's point that these effects compound still stands, and we would keep its advice: if resources are limited, use LinkedIn's reach optimisation, the Forecasting tool, and the engagement and viral columns in Campaign Manager reporting (viral metrics count clicks, reactions and shares that happen when members share your sponsored content with their own network).
Cite: "LinkedIn ads appear in 30.2% of SQL-stage sessions, and the average first LinkedIn ad impression comes 281 days before revenue (Dreamdata, 2026)." Kiin Labs, kiin.co/blog/b2b-brand-awareness#measure
What do good B2B brand awareness campaigns look like?
The B2B House used three LinkedIn campaigns as examples. All three come from LinkedIn's own case studies, so the results are as LinkedIn and the advertiser reported them. We have checked each against LinkedIn's page and added the date, which the original guide did not give.
Cenareo: from new audience to 500 leads in a month (2021)
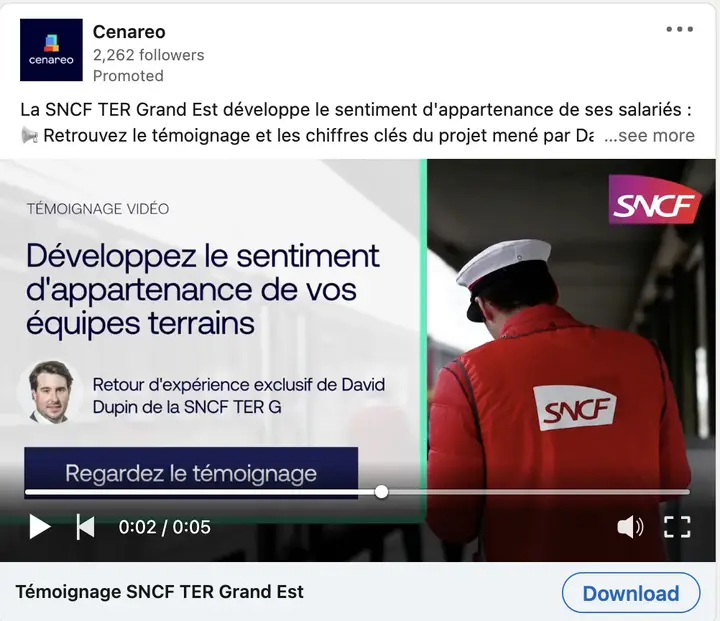
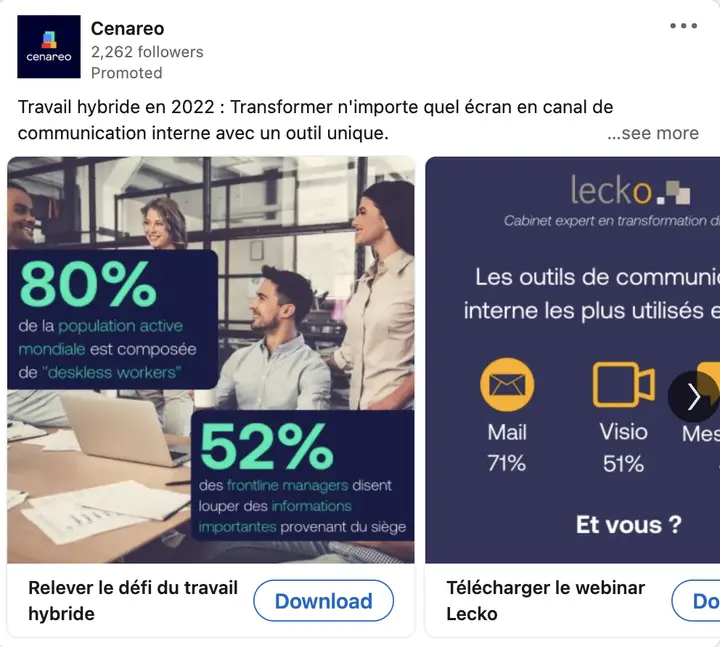
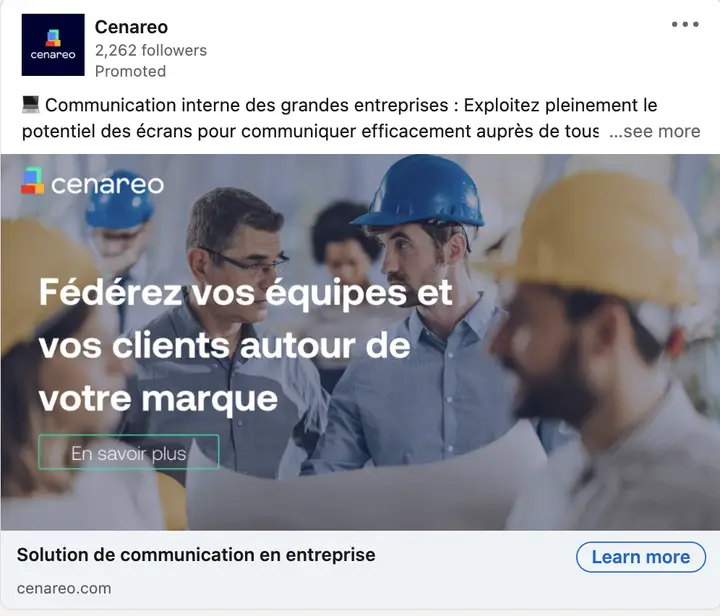
Cenareo makes digital signage software that updates any number of screens in real time. With many shops closed in the pandemic, it repositioned to help corporate communications and HR teams keep staff safe and informed, so it needed awareness with a new audience, then nurture, then leads. It used LinkedIn audience insights to tailor creative, ran Conversation Ads with two calls to action (stage-appropriate content, and a case study, solution guide and demo), and used single image and video ads to keep nurturing and build awareness.
Result: more than 500 leads in one month and an estimated pipeline of more than €180,000, as reported by LinkedIn on 9 September 2021 (LinkedIn Marketing Blog). Note that the leads came mainly from Conversation Ads; the video ads carried the awareness job.
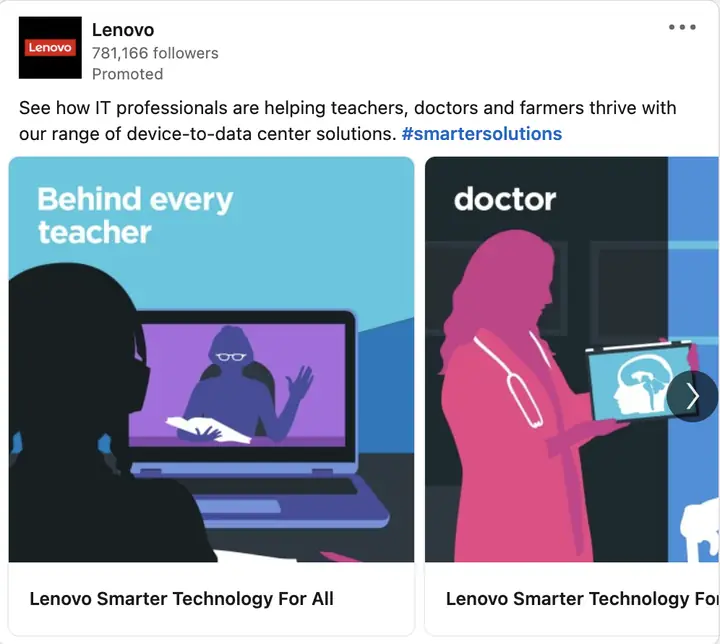
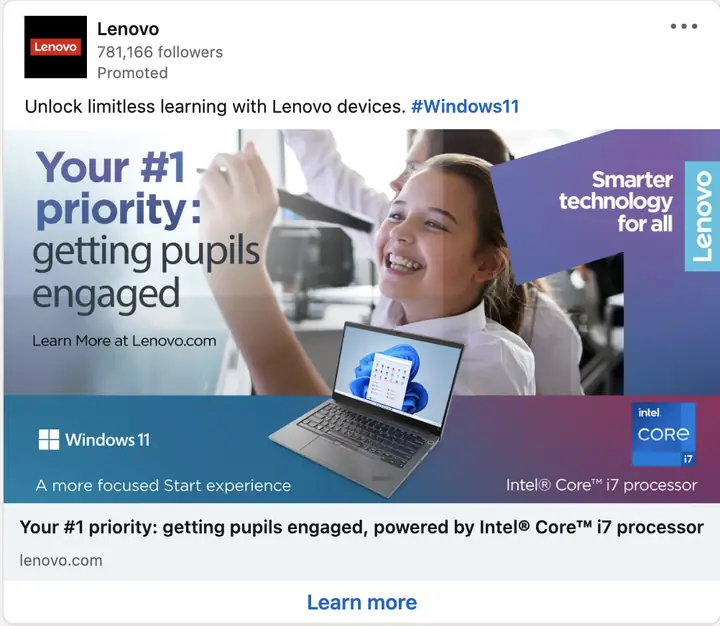
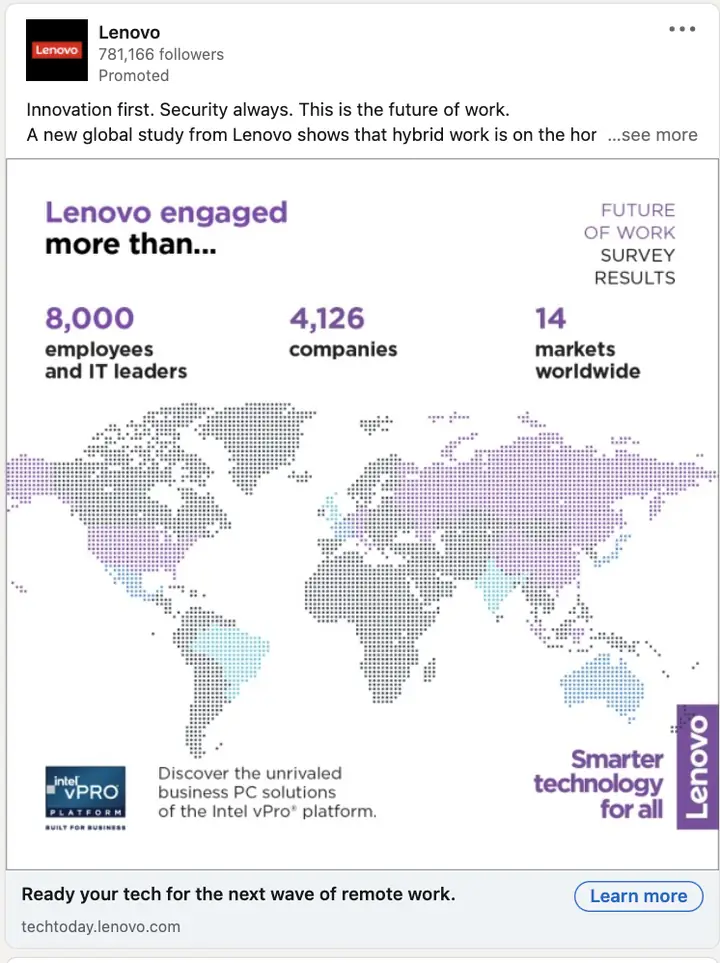
Lenovo: 17% lift in brand favourability (2013)
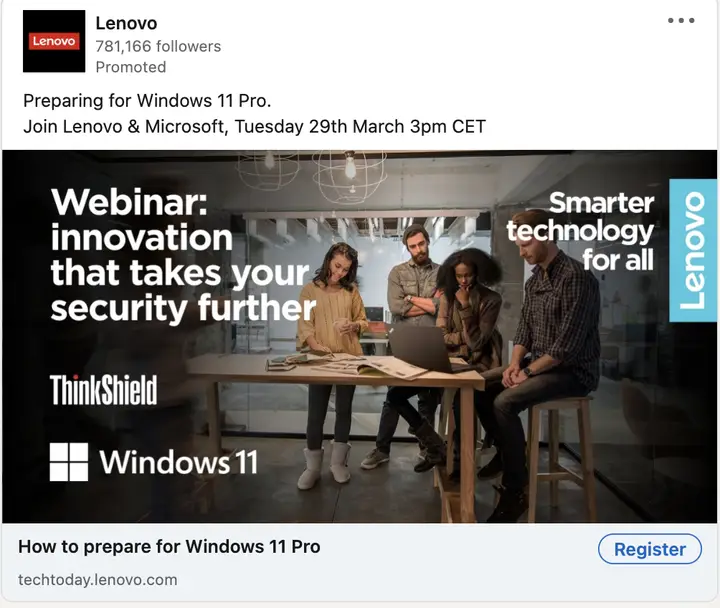
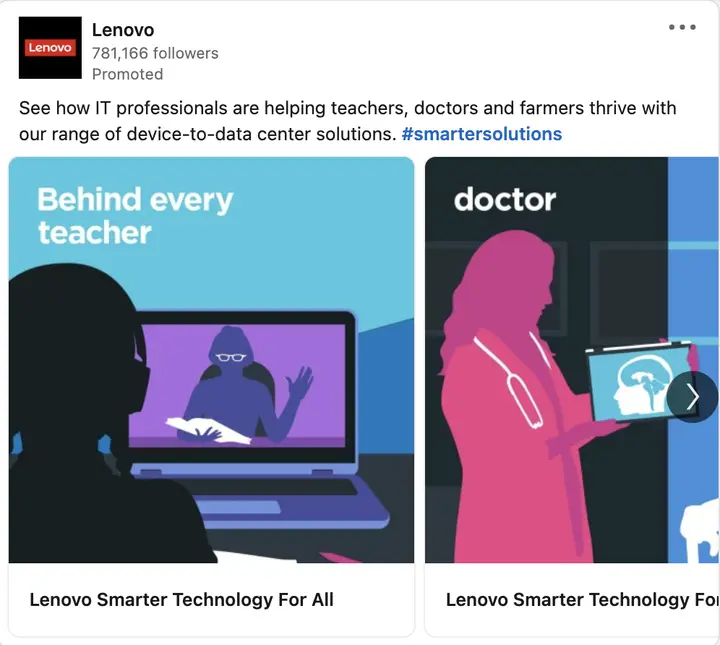
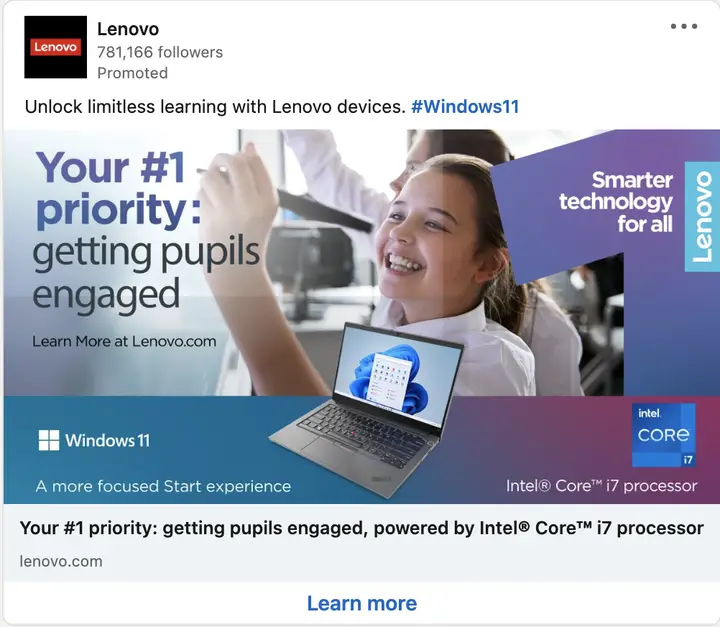
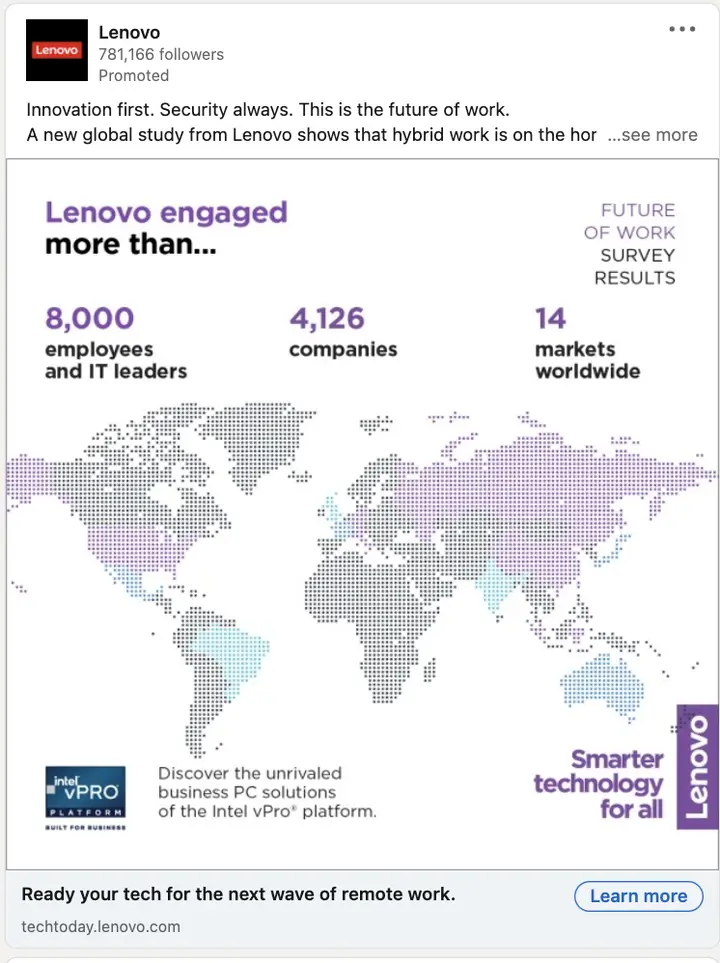
Lenovo, then described as a $34 billion technology company with more than 35,000 employees and customers in 160+ countries, ran LinkedIn Sponsored Updates (now Sponsored Content) through May and June 2013 across four themes: brand, thought leadership, products and external trends, and optimised content to each audience's reactions.
Result: a 17% increase in brand favourability in a brand impact study run with LinkedIn, and post-level engagement about four times display averages (LinkedIn case study, © 2013). It is a classic, but it is 13 years old. LinkedIn's current Lenovo story is about thought leader ads lifting mid-funnel CTR by 63%.
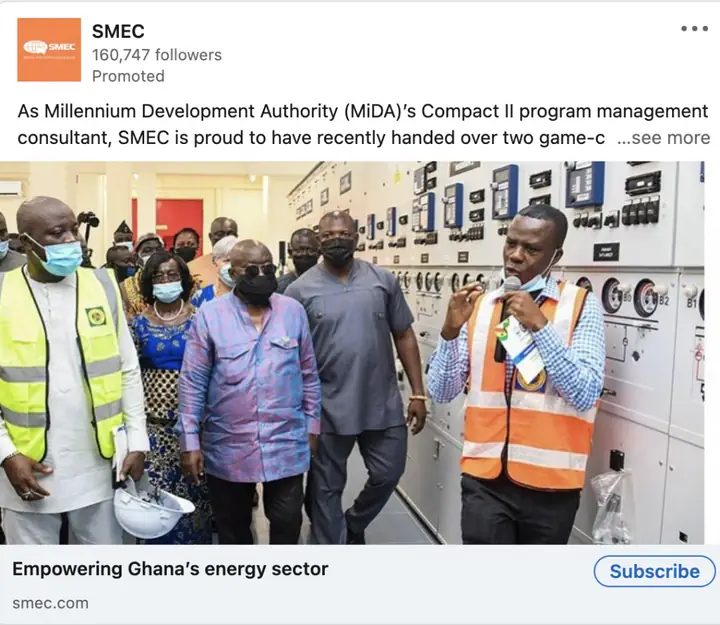
SMEC: 756,000 members reached on a small budget (2020)
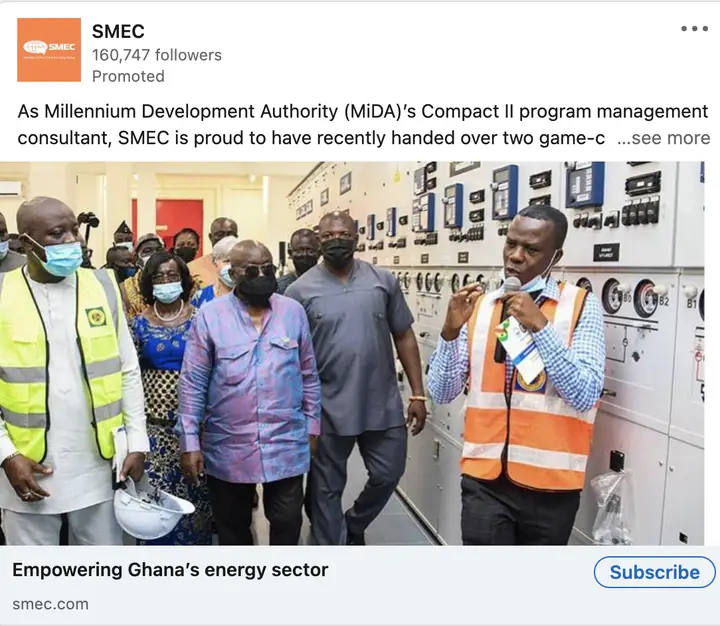
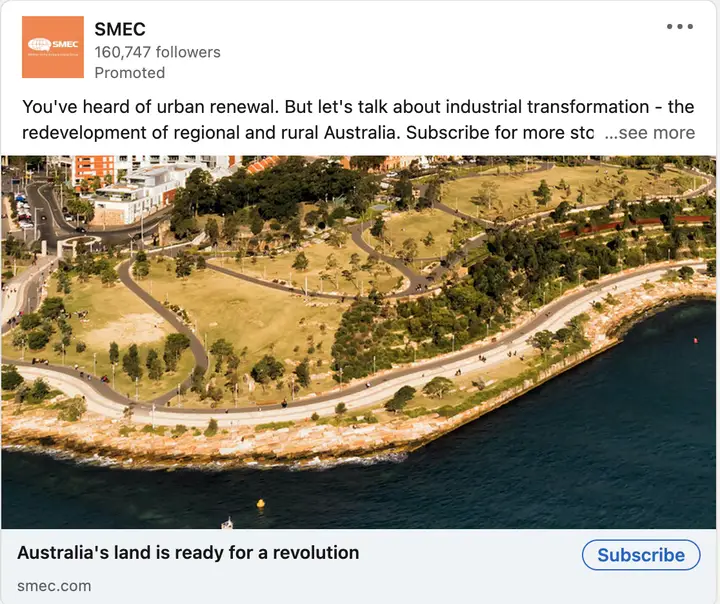
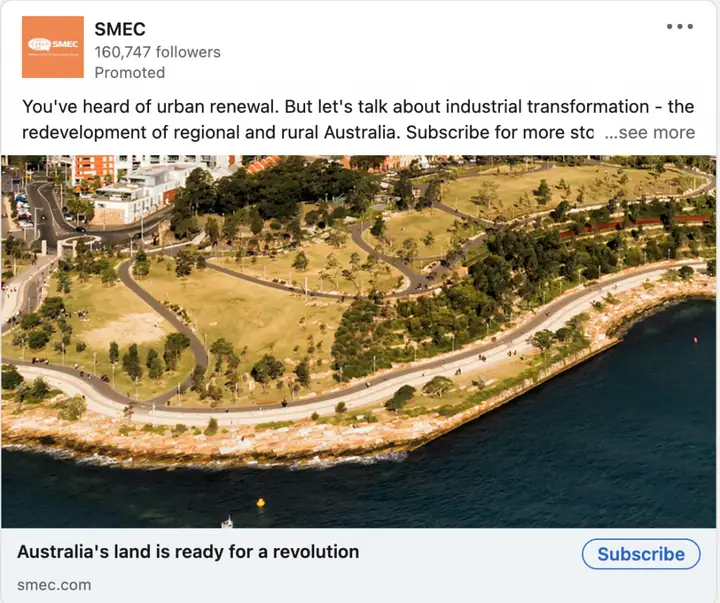
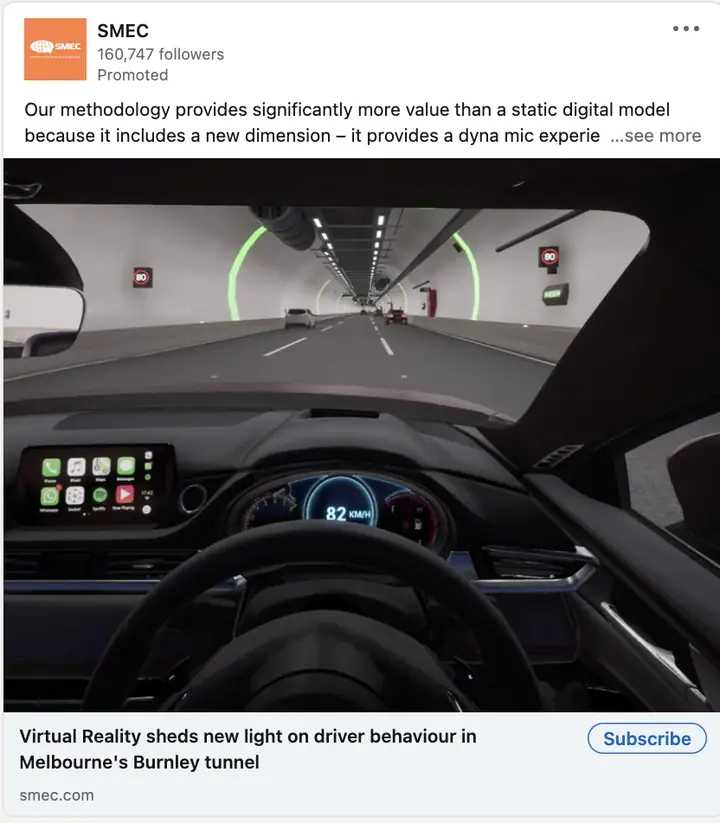
SMEC, a global engineering, management and development firm, wanted to be known as a world-class specialist infrastructure brand and an employer of choice. Its marketing team in Australia was small with a limited budget for a global campaign. For its "70 Years of Impact" campaign it used LinkedIn audience segments to scale reach and a mix of single image and video sponsored content, plus organic posts and employee advocacy.
Result: more than 2 million impressions, more than 756,000 members reached, and a 5% engagement rate against an industry benchmark of 1%. The people engaging were mainly managing directors and owners in engineering and project management, the profile SMEC targeted; senior professionals were 36% of the engaged audience. LinkedIn's page also reports employee shares up 90% and Net Promoter Score up 3.3% (LinkedIn, SMEC case study; the campaign won awards in April 2020).
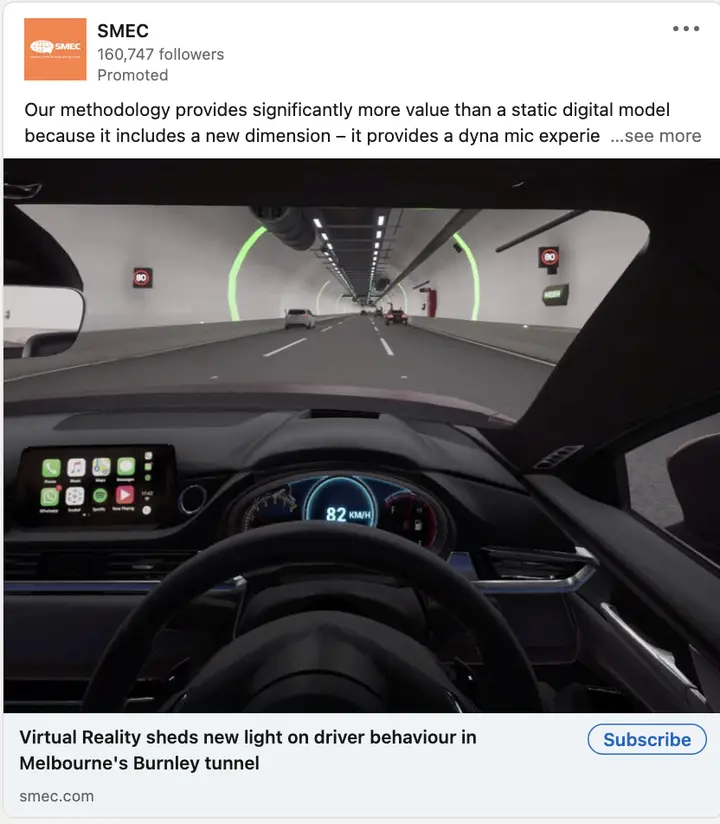
What the three have in common: broad reach into a defined professional audience first, content built for that audience rather than a product pitch, and a mix of formats including video. What none of them reported is pipeline over the following year, which is the measure we would add today.
Figures previously published by The B2B House
The B2B House's "B2B Brand Awareness: The Complete Guide 2024" was first published in 2022 and is linked to by sites including HubSpot. The B2B House is now part of Kiin, so every figure and factual claim it published stays here, exactly as published, so every link to it still makes sense. Next to each is what we know in 2026.
Two things to know before you use them:
- Most are from 2013 to 2022. The guide was titled 2024 but its LinkedIn figures and case studies are older, and none were dated on the page.
- Some had no source. Where a claim cannot be traced, we say so rather than invent a replacement.
"Brand awareness is a key target for increased investment among B2B marketers"
As cited: this is the sentence HubSpot and others link to this guide for. The guide itself argued that B2B marketers get long-term benefits from brand awareness and that brand equity drives both short-term activation and long-term growth.
2026: Still true. In LinkedIn's 2024 B2B Marketing Benchmark (2,000+ B2B marketing leaders), over two-thirds said they were increasing their brand-building budget in the coming year (as reported by TopRank, June 2024; we could not open LinkedIn's PDF directly). The evidence for why is in section 04: a 46:54 brand to activation split and 0.7 points of share growth per 10 points of ESOV (Binet and Field, 2019).
"95% of buyers are out-of-market"
As published: brand awareness creates mental availability with "the 95 percent of buyers who are out-of-market (future) buyers"; "95% of your audiences are not 'in-market'" (linked to The Shattuck Group).
2026: Same figure, better source. It comes from Professor John Dawes of the Ehrenberg-Bass Institute, published by the LinkedIn B2B Institute in May 2021: companies switch key suppliers about once every five years, so about 5% are in the market in a quarter (95-5 rule). Dawes calls it a heuristic, not a precise rule. The Shattuck Group page the guide linked to no longer loads.
"Businesses tend to grow when SOV is bigger than SOM"
As published: share of voice is your ad spend divided by total category ad spend; share of market is your revenue divided by total market revenue; businesses tend to grow when SOV is bigger than SOM. Raise SOV by capturing more reach and frequency in your target audiences.
2026: Confirmed for B2B, with a number. Binet and Field found 10 points of extra share of voice grows B2B market share by 0.7 points a year, against 0.6 in B2C (The 5 Principles of Growth in B2B Marketing, 2019). Details.
"Reach drives customer acquisition; loyalty is mainly a function of market share"
As published: according to LinkedIn's B2B Institute study, reach drives customer acquisition and conversion; addressing everyone in the buyer category beats focusing on segments; it is impossible to grow sustainably by focusing solely on loyalty.
2026: Unchanged. The study is Binet and Field (2019): in IPA B2B cases from 2008 to 2018, acquisition beat loyalty strategies and reach strategies did best of all. The Ehrenberg-Bass Double Jeopardy law, shown to hold in B2B in How B2B Brands Grow, is why loyalty follows market share.
"Stronger brands have less price sensitivity, more loyal customers and attract better talent"
As published: six benefits drawn from The B2B House's study of the common characteristics of strong B2B brands such as Salesforce, Adobe and GE.
2026: The B2B House did not publish data for its study, so we cannot update it as a statistic. The claims are supported elsewhere, mostly by Binet and Field's IPA analysis (brand building reduces price sensitivity) and Ehrenberg-Bass. See the table in section 03.
"Over 850+ million active users and 55 million registered firms"
As published: LinkedIn has "over 850+ million active users and 55 million registered firms" (linked to The B2B House LinkedIn statistics page).
2026: LinkedIn now has more than 1.4 billion members and 71 million companies (LinkedIn About Us, November 2026). Note these are registered members: LinkedIn has never published active users, so "active users" was not right in 2022 either. Full detail in our LinkedIn statistics.
"LinkedIn Stories are no longer available"
As published: an update to the guide noted LinkedIn Stories had gone and that document ads and LinkedIn events were more relevant new formats. The awareness plan image still lists Stories and lookalike audiences.
2026: Correct: Stories were retired in 2021. Since then LinkedIn has also replaced lookalike audiences with predictive audiences and added thought leader ads, CTV ads and a frequency cap for brand awareness ad sets (July 2025). Updated plan.
"Brand lift (free on LinkedIn)"
As published: brand lift listed as a free LinkedIn measurement, alongside the advice to use LinkedIn's Reach Optimization and brand lift tools if resources are limited.
2026: There is no fee for the test, but it needs $60,000 budgeted for one question, $90,000 for two and $45,000 per extra question, and runs 14 to 90 days (LinkedIn Help, fetched 14 Nov 2026). For most small B2B advertisers it is not available. Reach optimisation is still a goal under the brand awareness objective.
"Measure over more than a year"
As published: awareness metrics have to be measured over a long period, preferably more than a year; it has a compounding snowball effect, linked to "herd mentality".
2026: Supported by data. The average first LinkedIn ad impression comes 281 days before revenue (Dreamdata, March 2026), and only 4% of B2B marketers measured beyond six months in LinkedIn's 2019 survey. The "herd mentality is scientifically proven" line linked only to a dictionary definition; we do not repeat it.
Cenareo: "500 leads and 180k EUR pipeline in just 1 month"
As published: generated 500 leads and drove an estimated total pipeline of 180k EUR in one month, using audience insights and LinkedIn video ads.
2026: Confirmed by LinkedIn (9 Sep 2021): more than 500 leads in a month and more than €180,000 of estimated pipeline. LinkedIn credits Conversation Ads for the leads, with video and single image ads for awareness. Details.
Lenovo: "a lift in brand favourability by 17%"
As published: Lenovo, a $34 billion company employing over 35,000 people and serving clients in over 160 countries, used Sponsored Content for two months across four themes and achieved a 17% lift in brand favourability.
2026: Confirmed, with a date: the campaign ran in May and June 2013, using what LinkedIn then called Sponsored Updates. The company figures are Lenovo's 2013 figures. Details.
SMEC: "2 million impressions, 756,000 members, 5% engagement vs a 1% benchmark"
As published: over 2 million impressions, over 756,000 LinkedIn members reached, a 5% engagement rate against an industry benchmark of 1%, with engagement from the managing directors and owners it targeted.
2026: All confirmed on LinkedIn's SMEC case study (campaign around 2019 to 2020). The "1% benchmark" is LinkedIn's comparison at the time; Fibbler's 2026 median engagement rate for sponsored content is 0.82%. Details.
Brand awareness claims we no longer recommend
These are widely repeated but either have no current source or are easy to misread:
- "95% of buyers are out of market" as a measured fact. It is a rule of thumb from purchase cycles; calculate your own from your category's buying frequency. Details.
- "LinkedIn has 850 million active users." LinkedIn publishes members, not active users. It now has 1.4 billion+ members.
- "LinkedIn brand lift is free." No fee, but a $60,000 budget minimum.
- "A 1% engagement rate is the LinkedIn benchmark." A 2020-era comparison from one case study; use current medians by format.
- "Herd mentality is a scientifically proven reason followers snowball." The guide's source was a dictionary definition.
- "The right split is 60:40 brand to activation" in B2B. That is the B2C figure; the B2B estimate is about 46:54.
The original B2B House guide, archived in full
The B2B House is now part of Kiin. So that every link to its guide still makes sense, the complete original is kept below, section by section, exactly as it was last published (only typos fixed). Figures in it are from the dates its authors gave; the sections above give the current numbers and sources. Open any section to read it.
Why are Brand Awareness and Brand Equity important?
Over the last two decades, there has been greater recognition of the intangible assets that drive corporate financial value.
These assets can be sold and are usually worth significantly more than a company’s actual assets.
The brand’s distinctive iconography, as well as its mental and physical availability, are assets that can be sold.
They represent brand equity.
They are assets because they cost money to construct, and other companies may choose to buy them rather than invest the money, effort, and risk in building their own.
They’re valued since they guarantee a profit in the future.
If you have a strong brand, your prospects will think about you every time they enter buying moments, then sales next year and beyond are going to be secured.
Ehrenberg-Bass Institute calls this Mental Availability. Having high mental availability means being thought of more often when a prospect enters buying situations.
Wouldn’t you want to be the first brand people think about when they need your category of product/service? That’s money in the bag. That’s what brand awareness gets you.
What are the benefits of brand awareness?
We studied the common characteristics of strong B2B brands like Salesforce, Adobe, GE, and more. They showed the following benefits of having strong brand awareness.
• Stronger brands can offer a wider range of products and services, as well as pivot when necessary.
• Stronger brands have a competitive advantage over their competitors in their market, ensuring long-term revenue and market dominance.
• Customers are more loyal to stronger brands, even if the purchase is difficult or the pricing isn’t the best.
• Stronger brands have longer mental availability, which helps them get through lengthy B2B sales cycles.
• Powerful brands have less pricing sensitivity, and they can boost profitability over time.
• Robust brands attract more talented employees and prospects to join them.
While brand awareness frequently produces short-term results (sales), it is even more effective as a long-term growth strategy.
Brand awareness tactics frequently produce both short and long-term profits because they create mental availability with the 95 percent of buyers who are out-of-market (future) buyers.When they need to make a purchase, such out-of-market purchasers progressively come “in-market.” If you’ve built up enough mental availability by then, they’ll be more likely to consider, or even pre-select, your brand.Furthermore, because powerful brands may frequently demand higher prices for their products, your company’s profitability and margins will grow.
How Do You Build Brand Awareness?
There are three ways to increase brand awareness:
• Increase your share of voice
• Growing your customer base
• Increasing mental availability
• Use emotional messaging
How to increase the share of voice (SOV)
Share of voice (SOV) is the amount of ad spend delivered by your company divided by the total amount of ad spend in that category. Share of market (SOM) refers to your company’s total revenue compared to the total revenue in your entire market.
Businesses tend to grow when SOV is bigger than (SOM). Until you can quantify SOV and SOM, we propose that you boost your SOV by capturing more reach and impressions from your target audiences. To get started, we propose increasing your share of voice by acquiring more reach and frequency with your target audiences.
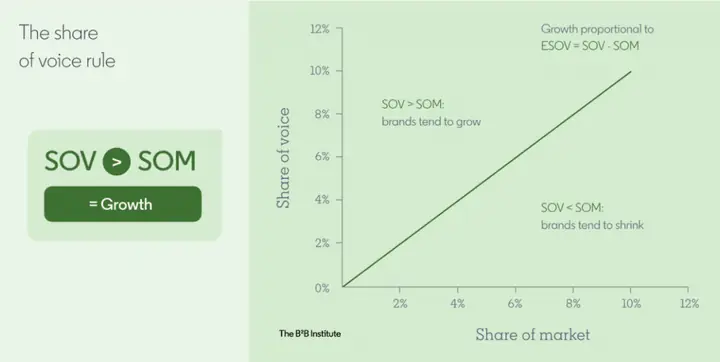
Share of Voice vs Share of Market
You may find your share of voice score from the platform representatives. LinkedIn reps will be able your share of voice.
Alternatively, you may calculate share of feed based on the number of brand mentions vs the total market mentions (Your brand mention plus your competitor mentions)
For the Share of market, you may add together your competitor’s revenue with yours to find the total market revenue.
Alternatively, you may use the total number of units or the total number of clients instead of the total revenue if that figure is not available.
Growing your customer base
According to LinkedIn’s B2B Institute study, reach drives customer acquisition and conversion. A strategy that addresses everyone in your buyer category is more effective than one that focuses on specific segments. Though loyalty and retention programs provide some profit, their share of overall revenue is lower when compared to the impact of reach.
This is due to the fact that reach both reaches out to prospects and reassures existing clients, creating and sustaining favorable feelings over time. Loyalty is mainly a predictable function of market share. It is impossible to grow sustainably by focusing solely on loyalty.
Buyers and purchasing committees are ever-changing and unpredictable. To maximize the effectiveness of your brand initiatives, keep up to date on the composition of existing and prospective buying committees. Targeting those who have influence over the purchasing committee will help your brand’s efforts even more.
Increasing Mental Availability
The possibility that a buyer will think of your brand when making a purchase is referred to as mental availability. If your brand inspires favorable sentiment and is memorable after repeated brand exposure, it is more likely to be remembered.
Share of Mind enhances the business’ Share of Voice by forging links between the brand, the purchasing occasion, and a suitable set of emotions and feelings.
Here are the key recommendations to improve mental availability:
• Maximising Reach
• Use clear and distinct copy/creatives
• Increase frequency (brand exposure)
• Use videos as it gets more engagement
• Expand audiences to both current and future buyers. Don’t hyper-target
• Driving engagement with both paid and organic activity.
Use Emotional Messaging
Emotional messaging must be used by B2B brands to create their brands for long-term growth.
Emotional messaging is critical for capturing the 95% of customers who are out of the market for when they are in the market. People are rational by nature, yet they can be emotional when making decisions, as we discovered with the availability heuristic.
People will pay attention and remember your brand as long as the advertising is entertaining and targeted.
Customers should be primed with repeated, memorable exposure to your brand before they come to market (in a purchase scenario).
As those purchasers enter the market, more logical messaging can support you in maximizing on this latent brand strength to achieve short-term results.
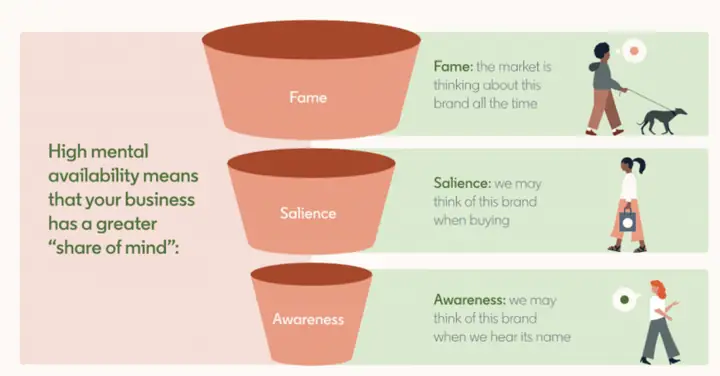
How Mental Availability works
Marketing strategies, tactics and tools to build brand awareness
Let’s get started with the techniques and approaches you may use to build your brand over time. We’ll cover both organic and paid strategies to help you achieve your brand awareness goals.
While the examples below are based on LinkedIn, the concept can be applied to any channel and platform.
We do recommend starting with LinkedIn if your target audiences are B2B.
LinkedIn audiences are distinct since their users visit the site with a specific goal in mind.
They devote time to becoming more productive and successful, as well as to learning and growing.
As a result, as compared to other platforms, they are more interested in learning about brands on LinkedIn. And, with over 850+ million active users and 55 million registered firms, your marketing campaigns can reach a large B2B audience.
LinkedIn is an excellent resource for rapidly reaching out to everyone in a B2B category, and even B2B buyer groups.
The diagram below shows how you could run your organic/digital campaigns to raise awareness.[Insert Awareness marketing screenshot]Update: Do note that LinkedIn stories are no longer available. But there are new formats like document ads and LinkedIn events that are more relevant
A balance of organic and paid is needed.
In the brand awareness and video views phases, aim for broad outreach. Reach the entire buyer committee or total addressable market.
In the engagement and website visit phases, the targeting should aim more toward in-market audiences. These include retargeting by engagements and website visits.
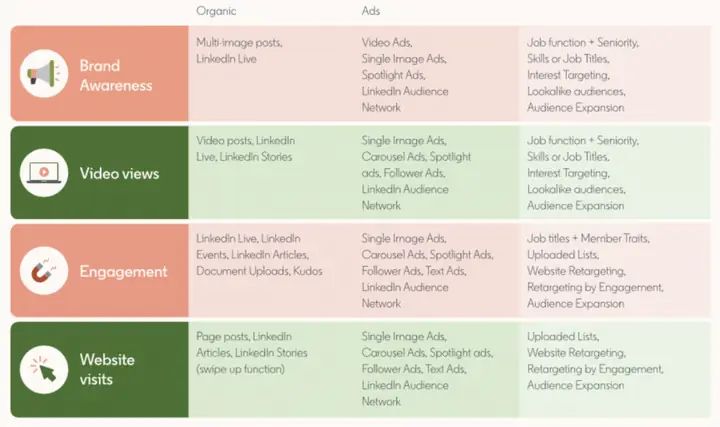
B2B Brand Awareness Campaign Example
How to measure brand awareness for B2B businesses
There are a number of marketing metrics that you could look into to find out if your awareness campaigns are moving the needle.
• % growth of impressions and reach of target audience/accounts
• % growth of website visitors through branded search terms
• Number of website visitors from Ideal customer profile
• Engagement rate (Like, Comments, Shares, Social mentions)
• Brand sentiment
• Share of voice
• View of content from the ideal customer profile (Measure content consumption)
• Followers or subscriber growth
• Mentions from Analyst and influencers
• Number of speaking gigs at large scale events conducted
• Brand lift (Free on LinkedIn)
These have to be measured over a long period of time (Preferably more than a year at least). It has a compounding snowball effect. The more followers you get, the more audiences want to follow you. Everyone likes to follow the crowd. It’s a scientifically proven behavior called Herd mentality.
If you only have limited resources, I’d suggest using LinkedIn’s reach optimization and brand lift tools to help.
With LinkedIn’s Reach Optimization tool, expanding your customer base on LinkedIn has never been easier.
Reach Optimization is available as a campaign objective under Brand Awareness, and it optimizes for the number of unique users who see your advertisements. By boosting your brand’s exposure to prospects and customers, Reach will help optimize brand strength and hence long-term activation.
The Forecasting Tool in Campaign Manager makes it simple to see anticipated reach and frequency for your Reach Optimization campaigns too.
You may also select Engagement metrics as a column view in Campaign Manager’s reporting dashboard or when exporting a report to get specifics about how different social actions contributed to the campaign’s performance. This is just for Sponsored Content advertisements. View average CTR, reactions, comments, followers, and other metrics.
Viral stats are also available if you export a Campaign performance or Ad performance report. Viral metrics are generated when individuals share a Sponsored Content ad with their own network of contacts. View viral clicks, reactions, shares, and more.
Example of B2B Brand Awareness Campaigns
(Section heading only in the original guide.)
B2B brand awareness campaign example 1: Cenareo
Cenareo offers a digital signage technology that can communicate in real time with a limitless number of screens.
With many shops closed during the pandemic, Cenareo modified their strategy to supporting Corporate Communications and Human Resources departments in using their solutions to keep their staff safe and informed. With this change, Cenareo needed to raise brand recognition among a new audience, educate and nurture them, and eventually create leads.
Cenareo uses LinkedIn audience insights to deliver a tailored experience for each of their prospective customers. Based on these data, they continued to adjust their ad creative and brand-building content, such as case studies, solution guides, and product demos. They then employed LinkedIn video advertisements to continue engaging their target demographic and increasing brand awareness.
Results: They generated 500 leads and drove a total pipeline of estimated 180k EUR in just 1 month.
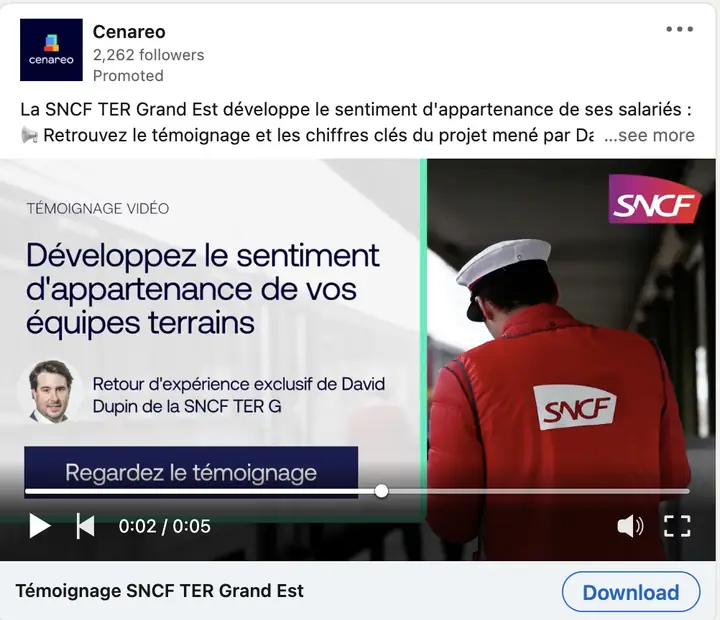
Cenareo Brand Awareness Example 1
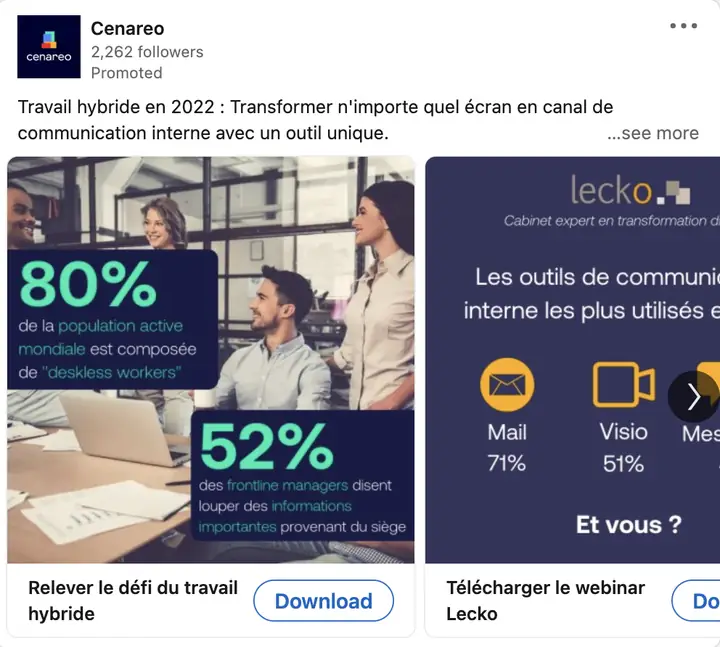
Cenareo Brand Awareness Example 2
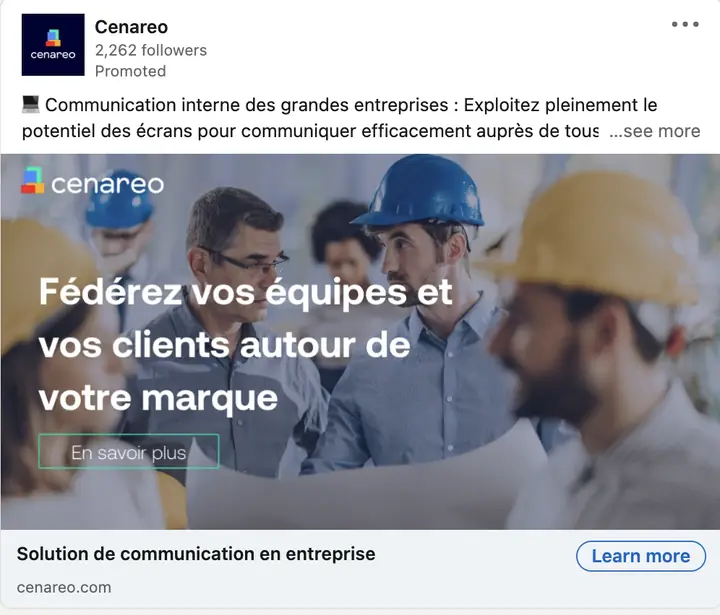
Cenareo Brand Awareness Example 3
B2B brand awareness campaign example 2: Lenovo
Lenovo is a $34 billion personal technology firm that employs over 35,000 people and serves clients in over 160 countries. They serve the majority of the world’s countries, and were recently crowned the world’s number one PC company and is a rising PC+ leader with its smartphone and tablet advancements.
LinkedIn Sponsored Content was used for two months to further engage their audience across four key themes: brand, thought leadership, products, and external trends. Lenovo was able to adapt the content to increase engagement based on each specific target group and their accompanying answers.
They achieved a lift in brand favourability by 17%.
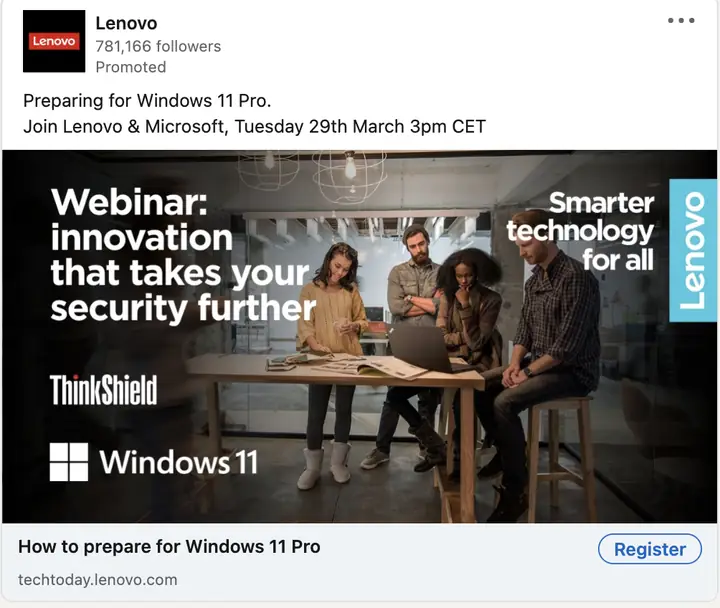
Lenovo Brand Awareness Example 1
Lenovo Brand Awareness Example 2
Lenovo Brand Awareness Example 3
Lenovo Brand Awareness Example 4
B2B brand awareness campaign example 3: SMEC
SMEC is a global engineering, management, and development firm that provides customers, partners, and communities with technical excellence and long-term solutions.
SMEC wants to be known as a world-class, specialist infrastructure brand and an industry employer of choice.
The primary goal was to enhance brand awareness among their primary consumers, creating a solid basis for future tactics that would contribute to advanced stages of the buyer journey. The team developed unique goals for each of its target audiences. However, because SMEC has a tiny marketing team in Australia, it has limited resources and a restricted budget to execute a global campaign.
They used LinkedIn’s audience segments to scale outreach to a global audience. They used a series of rich content, from single images to videos, to establish themselves as a thought leader.
Results:
• The campaign received over 2 million impressions and reached over 756,000 LinkedIn members.
• The campaign achieved a high LinkedIn engagement rate of 5% compared to the industry benchmark of 1%.
• According to demographic data, LinkedIn members interacting with the content included only the profile SMEC was targeting, Managing Directors/Owners; the most common industries were engineering and project management.
SMEC Brand Awareness Example 1
SMEC Brand Awareness Example 2
SMEC Brand Awareness Example 3
Conclusion
Building brand awareness and brand equity future-proofs a business. Many B2B marketers are blocking their own way whenever they focus solely on lead generation. 95% of your audiences are not “in-market”. So positioning messages that are hard-selling won’t work.
Instead, effort should be put into creating strong mental availability. This ensures that whether the audience is in-market or out-market, they will think of your brand in buying situations.
• Tags:
• B2B Marketing Strategy
• Brand Awareness
• linkedin marketing
Nice article. Can someone tell me if Lenovo created the whol branding campaign in-house? If not I would like to have the nam of the marketing agency who helped them (also with the measuring process).
B2B brand awareness: frequently asked questions
What is B2B brand awareness?
B2B brand awareness is the share of potential business buyers who know your brand and think of it when they have a need in your category. The second part, being thought of in buying situations, is what the Ehrenberg-Bass Institute calls mental availability.
Why is brand awareness important in B2B?
Because only about 5% of business buyers are in the market in a given quarter (Dawes, Ehrenberg-Bass, for the LinkedIn B2B Institute, 2021). The other 95% can only be reached by building memory of your brand before they buy, and buyers strongly prefer brands they already know when they start to search.
What is the 95-5 rule?
The 95-5 rule says that about 95% of B2B buyers are not in the market for a product at any one time and about 5% are, because companies replace many suppliers only every few years. Professor John Dawes published it with the LinkedIn B2B Institute in May 2021 and describes it as a heuristic, not a precise rule.
How much of a B2B marketing budget should go to brand?
About half. Binet and Field's analysis of B2B cases in the IPA Databank puts the best split at around 46% brand building and 54% sales activation (2019), and the B2B Institute now rounds it to 50/50. The B2B sample was under 50 cases, so treat it as a guide.
How do you measure B2B brand awareness on LinkedIn?
In three layers: reach and frequency in your target accounts (penetration rate of 50%+ and account-level frequency), brand lift (LinkedIn Brand Lift tests need $60,000 budgeted for one question), and influenced pipeline from accounts that saw your ads. Judge it over at least a year: the average first LinkedIn impression comes 281 days before revenue (Dreamdata, 2026).
Is the LinkedIn brand awareness objective worth using?
For cold audiences of 30,000 people or more, yes. Paired within 36 accounts, brand awareness reached 77% more people per dollar than engagement at the same cost per landing page click (Kiin Labs Report No. 1). Under 10,000 people, use engagement instead. Fibbler's 2026 median CPM for the brand awareness objective is $41.04.
Do brand awareness ads on LinkedIn generate pipeline?
By association, yes. Dreamdata finds LinkedIn ads in 30.2% of SQL-stage sessions (2026), HockeyStack found outbound deals exposed to LinkedIn ads won 21.09% of the time against 16.96% overall, and Fibbler's 2026 median is 7.0x influenced revenue per $1 spent. These show the ads were present before deals, not that they caused them.
What is share of voice and why does it matter?
Share of voice is your share of all advertising in your category. When it is higher than your share of market, brands tend to grow: in B2B, 10 points of extra share of voice adds about 0.7 points of market share a year (Binet and Field, 2019).
Should B2B brand advertising be emotional?
Yes, for brand building. IPA data shows rational messages work best for short-term activation and emotional ones for long-term brand effects, in B2B as in B2C. Campaigns aiming for fame reported 2.2 very large business effects on average, against 0.7 for activation goals (Binet and Field, 2019).
What happened to The B2B House guide to B2B brand awareness?
The B2B House is now part of Kiin. Its guide is on this page, with every figure it published kept in the section "Figures previously published by The B2B House", next to the 2026 figure.
How we built this page, and every source
We started from every claim in The B2B House guide and every claim other sites link to it for (we checked its backlinks one by one). For each, we went to the original publisher: the LinkedIn B2B Institute and its reports by the Ehrenberg-Bass Institute and by Les Binet and Peter Field (IPA Databank), LinkedIn's Help Center, case studies and About page, and the attribution studies from Dreamdata, Fibbler and HockeyStack. We opened each source on 14 November 2026 and copied the figure from it. Where there is no update we say so and keep the old figure with its date. Kiin's own figures come from the Kiin Labs panel ($65M+ of LinkedIn Ads spend across 1,000+ advertiser accounts), described in our method note. Corrections: [email protected].
- LinkedIn B2B Institute, The 95-5 rule and John Dawes, Advertising effectiveness and the 95-5 rule (May 2021)
- Les Binet and Peter Field, The 5 Principles of Growth in B2B Marketing (LinkedIn B2B Institute, 2019; IPA Databank B2B cases 1998 to 2018)
- LinkedIn B2B Institute and Ehrenberg-Bass Institute, How B2B Brands Grow
- Ehrenberg-Bass Institute for Marketing Science
- TopRank Marketing, takeaways from LinkedIn's 2024 B2B Marketing Benchmark (20 Jun 2024)
- LinkedIn, Global B2B Marketing Benchmark
- Dreamdata, 2026 LinkedIn Ads Benchmarks Report (10 Mar 2026)
- Fibbler, LinkedIn Ads Benchmarks 2026 (Aug 2026)
- HockeyStack Labs, Marketing influence on outbound deals (15 Dec 2025)
- LinkedIn Help, Create a Brand Lift test
- LinkedIn Marketing API, Brand Lift Testing getting started (Microsoft Learn, Apr 2026)
- LinkedIn Help, frequency cap for brand awareness ad sets
- LinkedIn Pressroom, About Us
- LinkedIn Marketing Blog, 5 examples of striking the right balance between brand and demand (Cenareo, 9 Sep 2021)
- LinkedIn Success Hub (Lenovo case study, 2013; Lenovo thought leader ads)
- LinkedIn, SMEC case study
- HubSpot, share of voice
- Kiin Labs, LinkedIn engagement vs brand awareness (Report No. 1), LinkedIn video ads benchmarks, ad frequency and fatigue, penetration rate and LinkedIn Ads benchmarks
Ilic, P. (2026). B2B Brand Awareness in 2026: Why It Works, How to Build It and How to Measure It. Kiin Labs (incorporating The B2B House). kiin.co/blog/b2b-brand-awareness. Free to cite with a link.
Building your brand on LinkedIn? Send read access to your LinkedIn Ads account and we'll show you your real penetration, account-level frequency and the pipeline from accounts you reached, against 1,000+ connected accounts. Free, read-only, one page.