
Running B2B paid media? I’ll benchmark your LinkedIn and paid search spend against our $65M+ panel of B2B advertisers in a free 30-minute call. Book my free benchmark with Phil →
Ilic, P. (2026). B2B Marketing Statistics 2026: Buyers, Budgets, Content and Ads. Kiin Labs (incorporating The B2B House). https://kiin.co/research/b2b-marketing-statistics
- The key B2B marketing statistics for 2026
- How do B2B buyers buy in 2026?
- How big is the B2B market?
- How much do B2B companies spend on marketing?
- How many B2B companies use content marketing?
- Does B2B thought leadership work?
- Which channels work best for B2B marketing?
- What do B2B ads and LinkedIn return?
- What is the 95-5 rule in B2B marketing?
- How is B2B marketing measured, and what about ABM?
- What this means for B2B paid media
- Figures previously published by The B2B House
Also: stats we no longer use · FAQ · every source
What are the key B2B marketing statistics for 2026?
If you only need one table, this is it. Every figure was checked against the page it comes from on 14 November 2026, or, where the publisher blocks automated access, against its press release as reported on the publication date. The sections below give the detail, the trend and the caveats.
| Statistic | Figure | As of | Source |
|---|---|---|---|
| Marketing budget as a share of company revenue | 7.8% (7.7% in 2025) | 2026 | Gartner CMO Spend Survey 2026 |
| Share of marketing budgets spent on paid media | 31.4%, a five-year high | 2026 | Gartner 2026, via Chief Marketer |
| Share of marketing budgets spent on AI | 15.3% | 2026 | Gartner CMO Spend Survey 2026 |
| Internal stakeholders in a typical B2B purchase | 13, plus 9 external influencers | Jan 2026 | Forrester, State of Business Buying 2026 |
| How far through the buying process buyers first contact a seller | 61% (69% in earlier studies) | Nov 2025 | 6sense Buyer Experience Report 2025 |
| Buyers who ranked vendors before contacting any of them | 94% | Nov 2025 | 6sense 2025 |
| How often buyers purchase from their pre-contact favourite | 77% | Nov 2025 | 6sense 2025 |
| B2B buyers who prefer a rep-free buying experience | 61% | Jun 2025 | Gartner |
| Channels B2B buyers use in a buying journey | ~10 (5 in 2016) | 2024 | McKinsey B2B Pulse |
| B2B marketers who say LinkedIn delivers the best value of any social platform | 85% | 2025 edition | Content Marketing Institute |
| Who rate LinkedIn the most effective thought leadership channel | 76% | 2026 edition | Content Marketing Institute |
| B2B marketers using AI-powered applications | 95% | 2026 edition | Content Marketing Institute |
| LinkedIn Marketing Solutions (ads) revenue growth | +16% year on year | Apr to Jun 2026 | LinkedIn Q4 FY26 highlights |
| LinkedIn's share of total B2B ad budgets | 41% | 2025 data | Dreamdata 2026 |
| Return on ad spend: LinkedIn / Google Search / Meta | 121% / 67% / 51% | 2025 data | Dreamdata 2026 |
| Average time from first LinkedIn ad impression to revenue | 281 days | 2025 data | Dreamdata 2026 |
| Median influenced revenue per $1 of LinkedIn spend | 7.0x | Aug 2025 to Jul 2026 | Fibbler 2026 |
| B2B buyers in the market at any one time | ~5% (the 95-5 rule) | 2021 | Ehrenberg-Bass / B2B Institute |
| Median cost per demo request lead on LinkedIn | $350 (top quarter $161) | 2026 | Kiin Labs panel |
| Median LinkedIn CPM (feed ads) | $36.23 | 2026 | Kiin Labs panel |
Cite: "B2B marketing budgets average 7.8% of company revenue in 2026, and paid media takes 31.4% of them (Gartner CMO Spend Survey 2026)." Kiin Labs, kiin.co/research/b2b-marketing-statistics#key-statistics
How do B2B buyers buy in 2026?
B2B purchases are made by groups of about 13 internal stakeholders, who do most of their research alone, pick a favourite before they speak to any seller, and buy from that favourite most of the time. That is the picture across the four largest public buyer studies: Forrester's State of Business Buying 2026, the 6sense Buyer Experience Report 2025, Gartner's B2B buying research and McKinsey's B2B Pulse. They use different samples and definitions, but they agree on the shape of the journey.
How big is a B2B buying group?
Forrester's 2026 report, based on its 2025 Buyers' Journey Survey of nearly 18,000 business buyers, finds the average buying decision involves 13 internal stakeholders and 9 external influencers such as consultants, peers and analysts (Forrester, 21 January 2026). Purchases that include generative AI features have buying groups twice the size of those that do not: 14 members against seven. Procurement is a decision maker in 53% of buying cycles, and more than 60% of buyers run a trial before they buy, rising to 78% for purchases of $10 million or more.
Other studies count differently and land lower. 6sense, which asks buyers about one recent purchase, has reported an average of about 10 people in the buying group for several years running. Dreamdata, which counts the people from an account who actually show up in a company's data before a deal closes, also finds 10 stakeholders and 88 touchpoints in the average B2B journey (Dreamdata, March 2026). Gartner's long-standing range is six to ten decision makers for a complex purchase. Whichever number you use, the point is the same: you are not selling to one person, so targeting one job title is not enough.
| Buying group statistic | Figure | Source, sample, date |
|---|---|---|
| Internal stakeholders in the average purchase | 13 | Forrester 2026, ~18,000 buyers |
| External influencers in the average purchase | 9 | Forrester 2026 |
| Buying group size, purchases with vs without genAI features | 14 vs 7 | Forrester 2026 |
| Buyers in groups of six or more who say the size brings clear benefits | 94% | Forrester 2026 |
| Buying cycles where procurement is a decision maker | 53% | Forrester 2026 |
| Buyers who run a trial before buying / for purchases of $10M+ | 60%+ / 78% | Forrester 2026 |
| Stakeholders and touchpoints in the average B2B journey (observed) | 10 / 88 | Dreamdata 2026, 3.5M+ journeys |
| Decision makers in a complex B2B purchase | 6 to 10 | Gartner, B2B buying journey |
| Millennials and Gen Z as a share of B2B buyers | 71% (64% a year earlier) | Forrester, 2023 survey, published Mar 2024 |
Sources: Forrester press release and blog, 21 January 2026 (full report is for clients); Dreamdata 2026 LinkedIn Ads Benchmarks Report, March 2026; Gartner B2B buying journey research; Forrester blog by Amy Hayes, 25 March 2024.
When do B2B buyers talk to sales?
Buyers first contact a seller when they are 61% of the way through their buying process, according to the 6sense 2025 Buyer Experience Report, based on more than 4,000 buyers in North America, EMEA and Asia Pacific and published on 12 November 2025 (6sense). That is earlier than the 69% 6sense found in previous years, and buyers say the reasons are economic uncertainty and the need to ask vendors about their AI features. Earlier is still late. By the time the first call happens:
- 94% of buyers have already ranked the vendors on their shortlist.
- Four of the five vendors they evaluate are on the shortlist from day one.
- 79% of buyers initiate the first contact themselves, rather than responding to outreach.
- They contact their top-ranked vendor first about 80% of the time, and buy from it 77% of the time.
The average buying cycle fell from 11.3 months in 2024 to 10.1 months in 2025 in the same study. In North America it is 11.1 months.
Gartner's research says the same thing from the buyer's side. 61% of B2B buyers prefer a rep-free buying experience overall, and 73% actively avoid suppliers who send irrelevant outreach, from a survey of 632 B2B buyers in August and September 2024 (Gartner, 25 June 2025). In the same release, 69% of buyers said they found inconsistencies between what a supplier's website said and what its sellers told them. Gartner's older and much-quoted finding is that buyers in a complex purchase spend only 17% of their buying time meeting potential suppliers, all suppliers combined, so a vendor on a shortlist of three gets about 5% (Gartner, survey of 750 B2B buyers). The rest goes on independent research and on meetings inside the buying group.
| Buyer behaviour statistic | Figure | Source, sample, date |
|---|---|---|
| Point in the buying process of first seller contact | 61% | 6sense 2025, 4,000+ buyers |
| Point of first contact in earlier 6sense studies | 69% | 6sense 2024 |
| Buyers who ranked shortlisted vendors before any contact | 94% | 6sense 2025 |
| Buyers who initiated first contact themselves | 79% | 6sense 2025 |
| Purchases won by the pre-contact favourite | 77% | 6sense 2025 |
| Vendors evaluated, on average | 5 | 6sense 2025 |
| Average buying cycle, global / North America | 10.1 / 11.1 months | 6sense 2025 |
| Purchases that included AI features | 89% | 6sense 2025 |
| Buyers who prefer a rep-free buying experience | 61% | Gartner, 632 buyers, 2024 survey |
| Buyers who avoid suppliers that send irrelevant outreach | 73% | Gartner, Jun 2025 |
| Buyers who found website and seller information inconsistent | 69% | Gartner, Jun 2025 |
| Buying time spent meeting potential suppliers (all combined) | 17% | Gartner, 750 buyers, pre-2020 survey |
| Channels used in the buying journey | ~10 (5 in 2016) | McKinsey B2B Pulse 2024, ~4,000 decision makers |
| Split of supplier interactions: in person / remote / digital self-serve | About a third each | McKinsey B2B Pulse 2024 |
| Business buyers who use AI in their buying process | 94% | Forrester 2026 |
Sources: 6sense 2025 B2B Buyer Experience Report, 12 Nov 2025; Gartner press release, 25 Jun 2025; McKinsey, Five fundamental truths, 2024; Forrester, Jan 2026.
The practical reading: the shortlist is mostly decided before a buyer fills in a form, and the people deciding it are a committee, most of whom will never talk to you. That is the job of B2B marketing in 2026. It is also why the old B2B House figures in this area, "77% of buyers do extensive research" and "61% read three to seven pieces of content before talking to sales", still get linked: the direction was right even where the sources were thin. Both are in section 12.
Cite: "B2B buyers first contact a seller 61% of the way through the buying process, and buy from their pre-contact favourite 77% of the time (6sense, 2025)." Kiin Labs, kiin.co/research/b2b-marketing-statistics#how-b2b-buyers-buy
How big is the B2B market?
US manufacturers and wholesale distributors alone sold $15.12 trillion in 2025, up 0.4%, and B2B ecommerce grew far faster than that total. That is from Digital Commerce 360's analysis of US Department of Commerce data (Digital Commerce 360, 26 January 2026). Digital Commerce 360's B2B ecommerce forecast puts US B2B ecommerce at about $2.93 trillion in 2025, up 13% (Digital Commerce 360 B2B Ecommerce Market Forecast). Note that this counts sales through B2B ecommerce sites, portals and marketplaces; other trackers that include EDI orders publish much larger numbers, so check the definition before comparing two figures.
How many B2B companies are there? Nobody publishes a clean count, because most official statistics classify companies by industry, not by who their customers are. What can be counted: the US had 5,934,950 employer firms in reference year 2023 (US Census Bureau QuickFacts). Many of them sell to other businesses, and many sell to both. The "more than 3 million B2B businesses in the US" that The B2B House published, and that several sites still link to, was attributed to Statista via a McKinsey article that does not contain it. We could not trace it to any primary source. The same goes for "23.6% of US companies operate in the B2B sector". Both are in section 12.
| B2B market statistic | Figure | Date | Source |
|---|---|---|---|
| US manufacturing and wholesale distribution sales | $15.12 trillion (+0.4%) | 2025 | Digital Commerce 360 |
| US B2B ecommerce sales (sites, portals, marketplaces) | ~$2.93 trillion (+13%) | 2025 | Digital Commerce 360 forecast |
| US B2B ecommerce, as published by The B2B House | $1.63 trillion (+17.8%) | 2021 | see section 12 |
| US employer firms (all sectors) | 5,934,950 | 2023 | US Census Bureau |
| US B2B digital ad spending | $24.60 billion (+17.4%) | 2026 forecast | eMarketer |
| US B2B ad spending, as published by The B2B House | $22.14B (2020), ~$26B (2021), "over $30B by 2023" | 2021 forecast | see section 12 |
Sources: Digital Commerce 360, 26 Jan 2026 and its B2B forecast report; US Census Bureau QuickFacts (reference year 2023); eMarketer B2B Digital Ad Spend Forecast 2026 (subscriber report; headline figures as published in its summary).
The ad spend numbers matter more for marketers than the sales totals. eMarketer forecasts US B2B digital ad spending of $24.60 billion in 2026, up 17.4%, a faster rate of growth than in 2025 (eMarketer). LinkedIn's ad business, which is almost entirely B2B, grew 16% in the quarter to June 2026 (section 08). Both point the same way: B2B budgets are moving into paid digital media, and the CMO surveys in the next section confirm it.
Cite: "US B2B digital ad spending is forecast at $24.60 billion in 2026, up 17.4% (eMarketer)." Kiin Labs, kiin.co/research/b2b-marketing-statistics#market-size
How much do B2B companies spend on marketing?
The average marketing budget is 7.8% of company revenue in 2026, up from 7.7% in 2025 and 2024, and half of CMOs spend 6% of revenue or less. Those figures are from Gartner's CMO Spend Survey, the largest public budget benchmark. The 2026 edition surveyed 401 CMOs and marketing leaders in North America, the UK and Europe between January and March 2026, most at companies with more than $1 billion in revenue (Gartner, 11 May 2026). The survey covers B2B and B2C companies; where it splits the two, we say so.
The longer trend is down, not up. Gartner said in its 2025 release that budgets averaged 11.2% of revenue in the five years before the pandemic and 8.1% in the five years after (Gartner, 12 May 2025). Marketing has been asked to do more with a flat share of revenue for five years running.
Where does the B2B marketing budget go?
Paid media takes 31.4% of marketing budgets in 2026, a five-year high, up from 25.1% in 2021. Martech has fallen to 19.4%, a five-year low, from 26.6% in 2021, and labour has risen to 24.5% from 21.9% (Gartner 2026 CMO Spend Survey, reported by Chief Marketer, 24 June 2026). 53% of CMOs plan to invest more in paid media, and only 25% expect to cut it.
| Budget statistic | 2026 | Earlier | Source |
|---|---|---|---|
| Marketing budget as % of company revenue | 7.8% | 7.7% (2025 and 2024) | Gartner 2026 |
| Average, five years before / after the pandemic | 11.2% / 8.1% | Gartner 2025 | |
| CMOs with budgets of 6% of revenue or less | Half (2025) | Gartner 2025 | |
| Paid media share of budget | 31.4% | 30.6% (2025), 25.1% (2021) | Gartner via Chief Marketer |
| Labour share of budget | 24.5% | 21.9% (2025) | Gartner via Chief Marketer |
| Martech share of budget | 19.4% | 22.4% (2025), 26.6% (2021) | Gartner via Chief Marketer |
| Agencies share of budget | 20.7% (2025) | Gartner 2025 | |
| Share of marketing budget spent on AI | 15.3% | Gartner 2026 | |
| Digital share of marketing expenses | 67.5% | 54.9% (2023) | Gartner via Chief Marketer |
| Search advertising / social advertising / SEO, share of digital budget | 16.0% / 15.7% / 9.4% | 14.8% / 12.7% / 8.9% (2025) | Gartner via Chief Marketer |
| Events share of offline budget, B2B vs B2C | 27.6% vs 16.5% | Gartner via Chief Marketer | |
| Linear TV share of offline budget, B2B vs B2C | 13.2% vs 19.9% | Gartner via Chief Marketer | |
| CMOs planning to invest more / less in paid media | 53% / 25% | Gartner via Chief Marketer | |
| Media spend on awareness and conversion | 62.6% | up 10% from 2024 | Gartner, 8 Jun 2026 |
| Media spend on loyalty and retention | under 15% | down 29% from 2024 | Gartner, 8 Jun 2026 |
Sources: Gartner CMO Spend Survey 2026 (401 CMOs, Jan to Mar 2026); Gartner CMO Spend Survey 2025 (~400 CMOs); detailed allocations as reported by Chief Marketer, 24 Jun 2026. Gartner's site blocks automated reading, so we checked the Gartner figures against its press releases as reported on the day.
Two things stand out for B2B. First, B2B companies put far more of their offline money into events (27.6%) than B2C companies (16.5%), and less into TV. Second, the growth is in paid digital: social advertising rose from 12.7% to 15.7% of digital budgets in a year, the fastest rise of any line. The Content Marketing Institute's numbers match. In its 2026 edition, 25% of B2B marketers named paid media as a top area to increase investment, and 45% named AI-powered marketing tools (CMI 2026). A year earlier, 46% of B2B content marketers who knew their budget expected it to grow in 2025, 41% expected it to stay the same and 8% expected a cut (CMI 2025).
If you are working out how much of that budget should go to LinkedIn specifically, our guide to what LinkedIn ads cost works through it from the cost per lead backwards.
Cite: "Paid media takes 31.4% of marketing budgets in 2026, a five-year high (Gartner CMO Spend Survey 2026)." Kiin Labs, kiin.co/research/b2b-marketing-statistics#budgets
How many B2B companies use content marketing?
Almost all of them. 97% of B2B marketers say they have a content strategy, 96% create thought leadership, and 95% now use AI-powered applications in their marketing. Those figures are from the Content Marketing Institute's 2026 B2B Content and Marketing Trends survey, run with MarketingProfs, with 1,015 B2B marketers analysed, fielded 24 June to 14 August 2025 and published 8 October 2025 (CMI 2026). CMI's annual survey, now in its sixteenth year, is the most-cited source of B2B content marketing statistics, and most "content marketing stats" on other pages trace back to an older edition of it.
Using content marketing is not the same as getting results from it. Only 12% of B2B marketers rated their marketing as highly effective in the 2026 survey, and 59% said it was at least somewhat effective. The most common challenge, at 40%, was creating content that prompts action or conversion, ahead of resource constraints (39%) and measuring effectiveness (33%).
| B2B content marketing statistic | Figure | Edition |
|---|---|---|
| Have a content strategy | 97% | 2026 |
| Rate their marketing highly effective / at least somewhat effective | 12% / 59% | 2026 |
| Say their content strategy improved in the past year | 61% | 2026 |
| Top challenge: creating content that prompts action | 40% | 2026 |
| Use AI-powered applications | 95% | 2026 |
| Use AI for written content / for images and video | 89% / 53% | 2026 |
| Say AI improved productivity / content quality / content performance | 87% / 58% / 39% | 2026 |
| Experiment with AI agents | 28% | 2026 |
| Personalise content / mostly at a basic level | 89% / 59% | 2026 |
| Collect first-party data | 91% | 2026 |
| Allocate budget to experiential (events) | 78% | 2026 |
| Top 2026 investment priorities: AI tools / events / owned media / paid media | 45% / 33% / 32% / 25% | 2026 |
| Have a dedicated content team or person | 76% | 2025 |
| Use paid channels to distribute content | 84% | 2025 |
| Content types used: short articles / videos / case studies | 92% / 76% / 75% | 2025 |
| Most effective content types: videos / case studies / e-books and white papers | 58% / 53% / 45% | 2025 |
| Content goals: brand awareness / demand and leads / nurturing | 87% / 74% / 62% | 2025 |
| Measure content performance / agree they measure it effectively | 96% / 51% | 2025 |
| Expect a bigger content budget the following year | 46% | 2025 |
Source: Content Marketing Institute, 2026 B2B Content and Marketing Trends (1,015 B2B marketers, fielded Jun to Aug 2025, published 8 Oct 2025) and B2B Content Marketing Benchmarks, Budgets and Trends 2025 (980 B2B marketers, fielded Jun to Aug 2024). Respondents are mostly North American.
The 2025 edition is still the best source for distribution channels, because the 2026 edition did not repeat those questions. B2B marketers distributed content through organic social media (89%), their blogs (84%), email newsletters (71%) and email (63%). The channels they rated most effective were different: in-person events (52%), webinars (51%), then email and organic social media (42% each). Video was both the most used rich format and the one rated most effective, at 58%.
The B2B House's old figure that "97% of marketing professionals use content as a technique" came from a 2021 Semrush poll of all marketers, not B2B marketers. The current CMI figure happens to be the same number, for a narrower and more relevant group. It is in section 12.
Cite: "95% of B2B marketers use AI-powered applications, but only 12% rate their marketing highly effective (Content Marketing Institute, 2026)." Kiin Labs, kiin.co/research/b2b-marketing-statistics#content-marketing
Does B2B thought leadership work?
Buyers say it does, and they say LinkedIn is where it works best. 76% of B2B marketers rate LinkedIn the most effective thought leadership channel, ahead of email newsletters (54%) and events or webinars (52%) (CMI 2026). On the buyer side, the main source is the annual Edelman and LinkedIn B2B Thought Leadership Impact Report.
The 2025 edition, which surveyed nearly 2,000 business decision makers in March and April 2025, found that 64% of decision makers spend more than an hour a week reading thought leadership, up from the 54% The B2B House quoted from the 2021 edition. It focused on "hidden buyers", the members of a buying group who never meet a seller: 71% of them reported little or no interaction with sales, 95% said strong thought leadership made them more receptive to outreach, and more than 40% of B2B deals stall because of misalignment inside the buying group (Edelman and LinkedIn, 2025).
The 2026 edition, published in November 2026 from a survey of 1,135 business professionals in seven markets, adds AI. 84% of B2B decision makers used AI to summarise thought leadership during vendor evaluation, and 82% said thought leadership is becoming more valuable as AI becomes a common source of business answers. 59% of final decision makers said poor or absent thought leadership contributed to a vendor being removed from consideration (Edelman and LinkedIn, 2026).
| Thought leadership statistic | Figure | Source, date |
|---|---|---|
| B2B marketers who say their organisation creates thought leadership | 96% | CMI, Oct 2025 |
| Rate LinkedIn / email newsletters / events and webinars the most effective channel | 76% / 54% / 52% | CMI, Oct 2025 |
| Organisations where under 5% of employees take part | 37% | CMI, Oct 2025 |
| Decision makers who read thought leadership for more than an hour a week | 64% (54% in 2021) | Edelman and LinkedIn, 2025 |
| Hidden buyers with little or no contact with sales | 71% | Edelman and LinkedIn, 2025 |
| Hidden buyers more receptive to outreach after strong thought leadership | 95% | Edelman and LinkedIn, 2025 |
| Hidden decision makers who trust thought leadership more than marketing materials and product sheets | 64% | Edelman and LinkedIn, 2025 |
| B2B deals that stall on internal misalignment | 40%+ | Edelman and LinkedIn, 2025 |
| Decision makers who used AI to summarise thought leadership when evaluating vendors | 84% | Edelman and LinkedIn, Nov 2026 |
| Final decision makers who dropped a vendor partly for poor or absent thought leadership | 59% | Edelman and LinkedIn, Nov 2026 |
| Of those who shared thought leadership, shared it privately (email, DMs, chat) | 89% | Edelman and LinkedIn, Nov 2026 |
Sources: Content Marketing Institute 2026; Edelman and LinkedIn B2B Thought Leadership Impact Reports 2025 and 2026. Edelman's site blocks automated reading; the 2025 and 2026 figures were checked against coverage of the reports at publication. These are self-reported attitudes, not measured win rates.
Thought leadership on LinkedIn has a paid form, too: thought leader ads, which promote a person's post rather than a company page. If you are weighing them up, our 150 LinkedIn Ads statistics cover their costs, and our LinkedIn Ads agency page explains how we use them for B2B clients.
Cite: "76% of B2B marketers rate LinkedIn the most effective thought leadership channel (Content Marketing Institute, 2026)." Kiin Labs, kiin.co/research/b2b-marketing-statistics#thought-leadership
Which channels work best for B2B marketing?
For social, LinkedIn by a distance: 85% of B2B marketers say it delivers the best value of any social platform, against 28% for Facebook, 22% for YouTube and 21% for Instagram. 68% increased their use of LinkedIn in the previous year, more than twice the share for any other platform (CMI 2025). For paid channels, B2B marketers rate search engine marketing first: 61% call it a best-performing paid channel, ahead of social media advertising (49%) and sponsorships (48%).
Social and paid channels
| Channel statistic (B2B marketers) | Figure | Source, date |
|---|---|---|
| Best-value social platform: LinkedIn / Facebook / YouTube / Instagram / X / TikTok | 85% / 28% / 22% / 21% / 7% / 3% | CMI, Oct 2024 |
| Increased use in the past year: LinkedIn / YouTube / Instagram / Facebook | 68% / 31% / 27% / 20% | CMI, Oct 2024 |
| Do not use X (Twitter) | 39% (27% a year earlier) | CMI, Oct 2024 |
| Use paid channels | 84% | CMI, Oct 2024 |
| Paid channels used: social ads / search (PPC) / display / sponsorships | 73% / 64% / 62% / 62% | CMI, Oct 2024 |
| Best-performing paid channel: search (PPC) / social ads / sponsorships / display | 61% / 49% / 48% / 35% | CMI, Oct 2024 |
| Influencer marketing used as a paid channel | 16% | CMI, Oct 2024 |
| Share of B2B ad budgets on LinkedIn | 41% | Dreamdata, Mar 2026 |
| Social advertising as a share of digital budgets (all CMOs) | 15.7% (12.7% in 2025) | Gartner 2026 |
| Search advertising as a share of digital budgets (all CMOs) | 16.0% (14.8% in 2025) | Gartner 2026 |
Sources: CMI B2B Content Marketing Benchmarks, Budgets and Trends 2025 (980 B2B marketers); Dreamdata 2026; Gartner CMO Spend Survey 2026 via Chief Marketer.
The two findings are not in conflict. Search captures people who already know they have a problem, which in B2B is a small share of the market at any time (see the 95-5 rule). LinkedIn reaches the buying group before they search. Most B2B paid media programmes we see need both: Google Ads to capture the demand that exists, LinkedIn to create the preference that decides which vendor gets searched for. For LinkedIn's audience itself, members, countries and who uses it, see our LinkedIn statistics page.
Email, events and video
Email newsletters are used by 71% of B2B content marketers, and email by 63%, but in-person events (52%) and webinars (51%) are rated the most effective distribution channels (CMI 2025). Events also take a bigger share of B2B budgets than of B2C ones: 27.6% of offline spend against 16.5% (Gartner 2026). In CMI's 2026 survey, 78% of B2B marketers put budget into experiential marketing, and among those who measured it, 51% said it shortened sales cycles.
For video, the most-cited survey is Wyzowl's annual State of Video Marketing. Its 2026 edition, from 266 marketers surveyed in late 2025, reports that 91% of businesses use video as a marketing tool and 82% of marketers say video gives them a good return on investment (Wyzowl 2026). Wyzowl's sample covers B2B and B2C. For B2B specifically, CMI's 2025 survey found 76% of B2B marketers used video and 58% rated it their most effective content type. LinkedIn says paid video on its platform grew 25% year on year in the quarter to September 2026 (LinkedIn, 28 October 2026).
| Email, events and video statistic | Figure | Source, date |
|---|---|---|
| B2B marketers using email newsletters / email to distribute content | 71% / 63% | CMI, Oct 2024 |
| Most effective distribution channel: events / webinars / email / organic social | 52% / 51% / 42% / 42% | CMI, Oct 2024 |
| Personalise email (of those who personalise) | 85% | CMI, Oct 2025 |
| Put budget into experiential marketing | 78% | CMI, Oct 2025 |
| Events share of offline budget, B2B | 27.6% | Gartner 2026 |
| B2B marketers using video / rating it the most effective content type | 76% / 58% | CMI, Oct 2024 |
| B2B marketers expecting to invest more in video | 61% | CMI, Oct 2024 |
| Businesses using video as a marketing tool (B2B and B2C) | 91% | Wyzowl 2026 |
| Marketers who say video gives a good ROI | 82% | Wyzowl 2026 |
| Paid video growth on LinkedIn | +25% year on year | LinkedIn, Jul to Sep 2026 |
Wyzowl blocks automated reading; its 2026 headline figures were checked against coverage of the report. For LinkedIn video ad costs specifically, see our LinkedIn video ads benchmarks.
Cite: "85% of B2B marketers say LinkedIn delivers the best value of any social platform, and 61% rate search the best-performing paid channel (Content Marketing Institute, 2025)." Kiin Labs, kiin.co/research/b2b-marketing-statistics#channels
What do B2B ads and LinkedIn return?
LinkedIn takes 41% of B2B ad budgets and returns 121% on ad spend, against 67% for Google Search and 51% for Meta, in Dreamdata's 2026 benchmarks. LinkedIn's ads also appear in 30.2% of sessions at the sales-qualified lead stage, and the average journey from first LinkedIn ad impression to revenue takes 281 days (Dreamdata, March 2026, built on 66M+ sessions and 3.5M+ customer journeys from its customers' data). LinkedIn's ad business grew 16% year on year in the quarter to June 2026, "a seventh consecutive quarter of double-digit growth" (LinkedIn, 29 July 2026).
LinkedIn matters this much in B2B because it is the only large ad platform that targets by job title, seniority, company and industry from data people keep up to date themselves. That is what makes it expensive per impression, and it is also why B2B attribution data keeps finding it near the top on return.
| B2B advertising statistic | Figure | Source, sample, date |
|---|---|---|
| LinkedIn Marketing Solutions revenue growth | +16% year on year | LinkedIn, Apr to Jun 2026 |
| LinkedIn total revenue, fiscal 2026 | $19.8 billion | LinkedIn, year to Jun 2026 |
| LinkedIn's share of total B2B ad budgets | 41% | Dreamdata 2026 |
| Return on ad spend: LinkedIn / Google Search / Meta | 121% / 67% / 51% | Dreamdata 2026 (LinkedIn 113% a year earlier) |
| LinkedIn ads' share of sessions at the SQL stage | 30.2% | Dreamdata 2026 |
| First LinkedIn ad impression to revenue | 281 days | Dreamdata 2026 |
| Touchpoints / stakeholders in the average B2B journey | 88 / 10 | Dreamdata 2026 |
| Median influenced revenue per $1 of LinkedIn spend | 7.0x (bottom quarter 1.7x, top 19.3x) | Fibbler 2026, 1,000+ advertisers, $200M+ spend |
| Median influenced pipeline per $1 of LinkedIn spend | 41.5x | Fibbler 2026 |
| Median influenced ROAS, under $10k vs over $50k a month | 8.6x vs 3.8x | Fibbler 2026, Aug 2025 to Jul 2026 |
| Paid video growth on LinkedIn | +25% | LinkedIn, Jul to Sep 2026 |
| US B2B digital ad spending | $24.60B (+17.4%) | eMarketer, 2026 forecast |
Dreamdata and Fibbler sell attribution software and report on their own customers, so these figures are associations, not proof that the ads caused the deals. Fibbler's "influenced" ROAS counts revenue from companies that saw the ads, which is why it is much higher than Dreamdata's multi-touch ROAS; the two are not comparable. Fibbler is a Kiin partner.
What do LinkedIn ads cost B2B advertisers?
The median B2B advertiser on LinkedIn pays $36.23 per 1,000 impressions, $164 per content lead and $350 per demo request lead; the top quarter gets demo leads for $161 or less. Those are from the Kiin Labs panel: more than 1,000 B2B LinkedIn ad accounts and $65M+ of spend, medians across accounts, USD. LinkedIn does not publish average costs, so the only way to know them is from what advertisers actually paid.
| LinkedIn ads cost (Kiin Labs panel) | Median | Good (top quarter) | Source |
|---|---|---|---|
| CPM, all feed formats | $36.23 | Kiin LinkedIn Ads benchmarks | |
| Cost per lead, content offer | $164 | Kiin Labs, 150 LinkedIn Ads statistics | |
| Cost per lead, demo request | $350 | $161 | Kiin Labs, 150 LinkedIn Ads statistics |
| Panel size | 1,000+ accounts, $65M+ of LinkedIn ad spend | Method note | |
A demo lead at $350 looks expensive next to a content lead at $164, until you set it against the 281 days and 10 stakeholders in a B2B journey. The full set of cost figures, by format, country and audience, is in our LinkedIn Ads benchmarks, and the plain-English version is in how much LinkedIn ads cost.
Cite: "LinkedIn takes 41% of B2B ad budgets and returns 121% on ad spend, against 67% for Google Search and 51% for Meta (Dreamdata, 2026)." Kiin Labs, kiin.co/research/b2b-marketing-statistics#advertising
What is the 95-5 rule in B2B marketing?
The 95-5 rule says that at any one time only about 5% of B2B buyers are in the market for what you sell; the other 95% will buy later. It comes from Professor John Dawes of the Ehrenberg-Bass Institute, in a May 2021 paper for LinkedIn's B2B Institute, "Advertising effectiveness and the 95-5 rule: most B2B buyers are not in the market right now" (Ehrenberg-Bass Institute).
The arithmetic is simple. Companies change suppliers of things like their main bank, law firm or core software roughly once every five years. So about 20% of buyers are in the market over a year, and about 5% in any quarter. Dawes calls it a heuristic, not a law: the share is higher for products bought often and lower for products bought rarely. But the implication holds for most B2B categories. If 95% of your future customers are not buying now, advertising that only reaches people who are ready to buy this quarter is aimed at 5% of the market.
| Brand and demand statistic | Figure | Source, date |
|---|---|---|
| B2B buyers in the market in a given quarter | ~5% | Dawes, Ehrenberg-Bass / B2B Institute, May 2021 |
| B2B buyers in the market over a year (5-year switching cycle) | ~20% | Dawes, 2021 |
| Buyers with a ranked shortlist before first contact | 94% | 6sense, Nov 2025 |
| Deals won by the pre-contact favourite | 77% | 6sense, Nov 2025 |
| Media spend on awareness and conversion | 62.6% | Gartner, Jun 2026 |
| B2B marketers with brand awareness as a content goal | 87% | CMI, Oct 2024 |
Put the 95-5 rule next to the 6sense data and you get the strongest argument in B2B marketing for spending on reach. If 77% of deals go to the vendor the buying group preferred before it spoke to anyone, and only 5% of the market is choosing right now, the vendor that wins next year is the one the other 95% already know. That does not mean every pound should go on brand. It means judging all of your advertising on this quarter's leads systematically underfunds the part that decides who gets on the shortlist.
Cite: "Only about 5% of B2B buyers are in the market in any quarter; 95% will buy later (Dawes, Ehrenberg-Bass Institute for the B2B Institute, 2021)." Kiin Labs, kiin.co/research/b2b-marketing-statistics#95-5-rule
How is B2B marketing measured, and does ABM work?
96% of B2B marketers measure content performance, but only 51% think they do it effectively, and the hardest part is attributing ROI (56%). Tracking customer journeys (56%) and tying performance to business goals (44%) follow (CMI 2025). That is the measurement problem in one line: B2B journeys run for most of a year across ten or more people, and most reporting looks at one person and one month.
On account-based marketing (ABM), the newest public figures are from CMI's 2026 survey. 49% of B2B marketers use ABM, alone (30%) or together with account-based experience programmes (19%). Of those who compared it with traditional campaigns, 65% said ABM outperforms them, 18% significantly; 16% saw no difference and 6% said it underperformed (CMI 2026). Most programmes are early: 49% of ABM-only users describe theirs as still developing, and 70% personalise only on basic firmographics such as industry and size.
| Measurement and ABM statistic | Figure | Source, date |
|---|---|---|
| Measure content performance / agree they measure it effectively | 96% / 51% | CMI, Oct 2024 |
| Measurement challenge: attributing ROI / tracking journeys / tying to goals | 56% / 56% / 44% | CMI, Oct 2024 |
| Thought leadership programmes that track business impact | 63% | CMI, Oct 2025 |
| Use ABM (alone or with ABX) / neither | 49% / 51% | CMI, Oct 2025 |
| Say ABM outperforms traditional campaigns (of those who measured) | 65% (18% significantly) | CMI, Oct 2025 |
| ABM personalisation on basic firmographics / account-specific content | 70% / 40% | CMI, Oct 2025 |
| First LinkedIn ad impression to revenue | 281 days | Dreamdata, Mar 2026 |
| Advertisers whose influenced revenue exceeded LinkedIn spend | 75% to 82% in every spend tier | Fibbler 2026 |
| B2B marketers rating their marketing highly effective | 12% | CMI, Oct 2025 |
Sources: Content Marketing Institute 2025 and 2026; Dreamdata 2026; Fibbler 2026.
The B2B House's guide quoted a set of ABM figures that are still widely linked: 87% see higher ROI from ABM, 91% see bigger deals, 86% see higher win rates, 70% more opportunities and 28% faster deal velocity. They come from ITSMA and vendor surveys from around 2013 to 2019, and we could not find a current primary source for most of them. The current, sourced figure is CMI's 65%. Details are in section 12.
Cite: "65% of B2B marketers who measured it say ABM outperforms traditional campaigns (Content Marketing Institute, 2026)." Kiin Labs, kiin.co/research/b2b-marketing-statistics#measurement
What do these statistics mean for B2B paid media?
Read together, the 2026 numbers say three things: B2B budgets are moving to paid media, the shortlist is decided before buyers raise their hand, and LinkedIn is where B2B marketers reach the people who decide it. We run LinkedIn Ads and Google Ads for sales-led B2B companies, and this is how the research lines up with what we see in client accounts and in the Kiin Labs panel.
- Budget is following paid media, so cost discipline matters more. Paid media is 31.4% of marketing budgets, a five-year high (Gartner), and US B2B digital ad spend is growing 17.4% (eMarketer). More money chasing the same buying groups pushes prices up. Know your benchmarks: on LinkedIn the median CPM is $36.23 and the median demo lead costs $350, with the top quarter under $161 (Kiin benchmarks).
- Reach the buying group, not one lead. With 13 internal stakeholders (Forrester), 10 people showing up in the data (Dreamdata) and 71% of hidden buyers rarely meeting sales (Edelman), campaigns targeting one job title miss most of the committee. Target accounts and functions, and judge success on how much of each account you reached.
- Be the favourite before the first call. 94% of buyers rank vendors before contact and 77% buy from the favourite (6sense). Only about 5% are in the market at once (the 95-5 rule). Spend that reaches the other 95% is not waste; it is what gets you on next year's shortlist.
- Judge LinkedIn on pipeline over nine months, not leads over thirty days. First impression to revenue averages 281 days, and LinkedIn's share of sessions grows from MQL to SQL (Dreamdata). Measured on 30-day cost per lead, LinkedIn looks expensive; measured on influenced pipeline, the median advertiser sees 7.0x revenue per dollar (Fibbler).
- Use search for the 5%, LinkedIn for the 95%. B2B marketers rate search the best-performing paid channel (61%) and LinkedIn the best-value social platform (85%) in the same survey (CMI). Search captures demand that exists. LinkedIn creates the preference that decides which brand gets searched for. Most programmes need both, in that order of patience.
For the LinkedIn-specific evidence behind each point, see 150 LinkedIn Ads statistics, our LinkedIn Ads benchmarks, what LinkedIn ads cost and our LinkedIn statistics on the platform's audience.
Figures previously published by The B2B House
The B2B House's "B2B Marketing Statistics: Key Trends, Stats, and Strategies for 2024" was linked to by more than 40 sites, from sales software companies to university repositories. The B2B House is now part of Kiin, so the figures it published stay here, exactly as published, so every link to them still makes sense. Next to each one is what we know in 2026.
Two things to know before you use them:
- They are old. The guide was titled for 2024, but its text was written for 2022 and most of its figures came from surveys published between 2014 and 2022.
- Many had no traceable source. Several figures were linked to a homepage (Semrush, Forbes, WebFX, Insider Intelligence) or to a page that does not contain them. Where we could not find the original, we say so rather than invent a replacement.
"There are more than 3 million B2B businesses in the US"
As published: "There are more than 3 million B2B businesses in the U.S., generating trillions of dollars in revenue annually, according to data from Statista.com." Linked source: McKinsey, "The new B2B growth equation".
2026: No source found. The linked McKinsey article does not contain the figure, and no official statistics agency counts companies by whether they sell to businesses. What is counted: the US had 5,934,950 employer firms in reference year 2023 (US Census Bureau), and US manufacturers and wholesale distributors sold $15.12 trillion in 2025 (Digital Commerce 360). "Trillions of dollars in revenue" is right; "3 million" should not be quoted as a measured count. See section 03.
"87% of B2B marketers see higher ROI from ABM"
As published: 87% of marketers said ABM ROI was higher than other marketing; 91% of ABM programmes saw bigger average deal sizes, 25% by more than 50%; 86% said ABM increased win rates; ABM increased opportunities by 70%; deal velocity up 28%. ABM was "the most effective strategy (46%)". No source linked.
2026: The 87% figure traces to ITSMA's ABM research from the mid-2010s; Momentum ITSMA's later benchmarks have reported lower shares, and we could not open a current primary report to confirm one. The newest public figure: 65% of B2B marketers who measured it say ABM outperforms traditional campaigns, 18% significantly, and 49% of B2B marketers use ABM at all (CMI 2026). The 91%, 86%, 70% and 28% figures have no current source. See section 10.
"59% of B2B buyers are millennials"
As published: "The bulk of B2B purchasers are millennials, who make up 59% of the market." Linked source: a ThriveMyWay statistics roundup.
2026: Updated. Forrester's buyer surveys found Millennials and Gen Z together made up 64% of B2B buyers in 2022 and 71% a year later (Forrester, March 2024). The 59% figure for millennials alone has no traceable primary source. The direction is the same: most B2B buyers are now under about 45.
"61% of B2B buyers read three to seven pieces of content before speaking to sales"
As published: According to a 2022 Demand Gen Report, 55% of US B2B buyers rely on B2B content more than a year ago, and 61% will read three to seven pieces of content before speaking with a salesperson. Often quoted as "over half of all leads engage with six to seven pieces of content".
2026: No public update. Demand Gen Report's Content Preferences Survey is gated and we could not confirm a newer figure. The better current evidence is on when buyers talk to sales at all: they first contact a seller 61% of the way through the process, after 94% have already ranked their shortlist (6sense 2025), and 64% of decision makers read more than an hour of thought leadership a week (Edelman and LinkedIn 2025). See section 02.
"77% of B2B buyers do extensive research before making a purchase"
As published: "77% of B2B consumers say they do extensive research before making a purchase." Linked source: a statistics roundup.
2026: No primary source found for 77%. The current, sourced figures say the same thing more precisely: 61% of B2B buyers prefer a rep-free buying experience (Gartner, 2025), buyers spend only 17% of buying time with suppliers (Gartner), and they are 61% through the process before first contact (6sense 2025).
"80% of B2B buyers value content that educates them about products"
As published: 80% of B2B consumers value content that educates a potential client about the product, and nearly 60% then want to learn more. Linked source: the WebFX homepage. Also: 52% of B2B customers prefer to buy from businesses that produce their own content; 66% of buyers rate product specs the top piece of content.
2026: No primary source for any of the three. The best current measure of what buyers value is the Edelman and LinkedIn research: 64% of hidden decision makers trust thought leadership more than marketing materials and product sheets, and 59% of final decision makers say poor or absent thought leadership helped get a vendor dropped (section 06).
"54% of decision makers read thought leadership for more than an hour a week"
As published: Nearly 54% of decision makers read thought leadership for more than an hour each week; almost 30% rate vendors' thought leadership mediocre or poor. Source: LinkedIn (linked to the LinkedIn app store page; the figures are from the 2021 Edelman and LinkedIn report).
2026: Updated. 64% of decision makers spend more than an hour a week on thought leadership (Edelman and LinkedIn, 2025), and in the 2026 edition 84% used AI to summarise it while evaluating vendors. See section 06.
"97% of marketing professionals use content marketing" and "96% of B2B content marketers use LinkedIn"
As published: According to a 2021 Semrush poll, 97% of marketing respondents use content as part of their strategy; 96% of B2B content marketers use LinkedIn; 97% of B2B companies use LinkedIn for content marketing (CMI); 61% use sponsored ads to distribute content; only 28% don't use paid distribution; 4% will never develop a content strategy.
2026: Updated from CMI. 97% of B2B marketers have a content strategy (CMI 2026). 84% use paid channels, so 16% do not, and 73% use social media advertising (CMI 2025). CMI no longer asks what share use LinkedIn; it asks which platform delivers the best value, and 85% say LinkedIn. See section 05.
"87% of B2B marketers prioritise the audience's informational needs over sales messages"
As published: 87% of B2B marketers place a higher priority on the informational needs of the audience than on the company's sales or promotional messages; 78% use keyword research for SEO; most outsource content creation. Attributed to Ahrefs, originally from CMI.
2026: CMI's recent editions no longer ask these questions, so there is no like-for-like update. The closest current figure: 65% of B2B marketers say content relevance and quality is the top driver of marketing effectiveness, the most cited factor (CMI 2026). For SEO, 41% use AI-powered SEO tools. The 78% keyword research figure has no update.
"71% of B2B customers prefer search engines when looking for information"
As published: Search engines are preferred by 71% of B2B customers when looking for information online; 70% of B2B marketers' traffic is organic search; 95.5% of traffic goes to the first results page. No source linked.
2026: No primary source. The 71% likely descends from a 2014 Google and Millward Brown study of B2B researchers starting with generic search, now 12 years old. Current evidence on search is from the marketer side: 61% of B2B marketers rate search (PPC) a best-performing paid channel (CMI 2025), and search advertising is 16.0% of digital budgets (Gartner 2026). Buyers increasingly research with AI tools too: 94% use AI in the buying process (Forrester 2026).
"84% of B2B marketers use email as their primary method" and "81% use newsletters"
As published: Email is the primary method of communication for 84% of B2B marketing experts; 82% use email to spread content; one in five B2B emails gets opened; 81% of B2B content marketers use newsletters; 16% spend most of their budget on email; it takes 3 hours 55 minutes to write an email campaign (a figure that was actually about blog posts).
2026: Updated from CMI. 71% of B2B content marketers use email newsletters and 63% use email, and 42% rate email among their most effective channels (CMI 2025). Of B2B marketers who personalise content, 85% personalise email (CMI 2026). The 84%, one-in-five open rate and 16% have no traceable source.
"72% of businesses say video increases conversion" and other video figures
As published: Over 85% of B2B marketers use or plan to use video; 94% watch videos to learn about a product (HubSpot); 98% say video converts at least as well as other content (Vidyard); 84% were convinced to buy by a video; 75% say video increases ROI; 72% say video increases conversion; 70%+ of B2B businesses focus mainly on video.
2026: 91% of businesses use video and 82% of marketers say it gives a good ROI (Wyzowl 2026, B2B and B2C). For B2B: 76% of marketers use video and 58% rate it their most effective content type (CMI 2025). The 72%, 75% and 70%+ figures have no traceable source. See section 07.
"86% of B2B firms had success with influencer marketing"
As published: According to TopRank Marketing, 86% of B2B firms had success with influencer marketing; 84% use influencer marketing for brand awareness; "a 44% annual growth rate over the past decade".
2026: No like-for-like update we could confirm. The 86% came from TopRank Marketing's B2B influencer marketing research from around 2020. CMI's 2025 survey found only 16% of B2B marketers use influencer marketing as a paid channel. For agencies that do B2B creator programmes well, see our list of the best B2B influencer marketing agencies.
B2B ecommerce: "$1.63 trillion", "$4.6 trillion by 2025", "90% would switch supplier"
As published: US B2B ecommerce grew 17.8% to $1.63 trillion in 2021 (Digital Commerce 360); North American B2B ecommerce will reach $4.6 trillion by 2025 (Statista); 65% of B2B businesses would transact fully online by 2022 and ecommerce is about 18% of B2B revenue (McKinsey); 49% of B2B purchases are online (Wunderman Thompson); 52% of buyers are dissatisfied with online buying and 90% would switch supplier over a poor digital channel.
2026: Updated. US B2B ecommerce reached about $2.93 trillion in 2025, up 13%, within $15.12 trillion of total US manufacturing and distribution sales (Digital Commerce 360). McKinsey's 2024 B2B Pulse finds buyers split interactions roughly equally between in-person, remote and digital self-serve, and more than half would switch suppliers over a poor omnichannel experience (McKinsey). The $4.6 trillion forecast and the 90% have no current primary source.
B2B ad spend: "$22.14 billion in 2020", "over $30 billion by 2023"
As published: US B2B advertising spend was $22.14 billion in 2020, down from $22.58 billion in 2019, rebounded 16.5% to about $26 billion in 2021, and would pass $30 billion by 2023 (Insider Intelligence); 93% of B2B marketers included digital ads in their plans (Statista, 2021); 16% of B2B organisations spend most on online advertising.
2026: eMarketer (formerly Insider Intelligence) now forecasts US B2B digital ad spending of $24.60 billion in 2026, up 17.4% (eMarketer). The old figures included traditional media, so the two series are not directly comparable. Paid media is 31.4% of marketing budgets in 2026 (Gartner), and 84% of B2B marketers use paid channels (CMI). See section 04.
"64% of users would rather tweet a support account than call a company"
As published: "Twitter reports that 64% of users would rather tweet a specialized support account on Twitter than call a company." Also: Facebook had 1.93 billion daily users and 2.91 billion monthly users in Q4 2021; one in four B2B marketers uses Pinterest.
2026: No current source. The 64% came from Twitter's own marketing material, and X has not republished it. Among B2B marketers, 39% no longer use X at all, up from 27% a year earlier (CMI 2025), and only 7% say it delivers the best value. We do not recommend the 64% figure.
"The top five B2B industries are VR/AR, medical marijuana, FinTech, biotech and content marketing"
As published: Virtual and augmented reality, medical marijuana, financial technology, biotechnology and content marketing are the top five B2B businesses; AR/VR growing at a 31.5% CAGR from 2021 to 2026; 6,829 martech products from 6,242 suppliers.
2026: No source; this was an opinion list, not a statistic. By sales, the largest US B2B sectors are manufacturing and wholesale distribution, $15.12 trillion in 2025 (Digital Commerce 360). The martech count is from the 2018 chiefmartec landscape and is far higher now.
Goals and challenges: "80% brand awareness", "37% struggle with high-quality leads"
As published: Content goals achieved: brand awareness 80%, credibility 75%, educating the audience 70%, demand and leads 60%; 37% say generating high-quality leads is a main challenge; challenges of quality leads 42%, quality data 40%, enough leads 33%; 53% don't link content to revenue and 49% don't know how content performs (Parse.ly); only 3% always hit their goals (Backlinko); 58% saw demand gen budgets rise.
2026: Updated from CMI. B2B marketers' content goals are brand awareness (87%), demand and leads (74%) and nurturing (62%) (CMI 2025). The top challenge is creating content that prompts action (40%), and 56% find attributing ROI hard (section 10). Only 12% rate their marketing highly effective (CMI 2026).
Other figures from the original guide
As published: 79% of businesses automate marketing (HubSpot); 34% use minimal marketing automation, 25% heavy, 13% none; social scheduling (83%) is the top automation use; one-minute videos are ideal; 52% of marketers believe their content drives leads; 32% of US B2B professionals call ecommerce the most effective sales channel; 36.6% of wholesalers struggle to modernise systems; "B2B campaigns convert better than B2C" (Forbes); 6 in 10 marketers planned budget increases in 2018.
2026: For AI and automation, the current figure is 95% of B2B marketers using AI-powered applications, 28% experimenting with AI agents (CMI 2026), and 15.3% of marketing budgets going to AI (Gartner 2026). The rest have no current primary source; we keep them here only as the original guide published them.
B2B marketing stats we no longer recommend using
A good statistics page should also say what not to quote. These are still widely repeated, including in AI answers, but have no current primary source:
- "There are 3 million B2B companies in the US." Not in the source it was attributed to; no official count exists. Details.
- "23.6% of US companies are B2B." Appears only in roundups. Details.
- "87% see higher ROI from ABM." A mid-2010s ITSMA figure; use CMI's 65% (2026). Details.
- "77% of B2B buyers do extensive research." No source; use Gartner's 61% rep-free preference or 6sense's 61% first-contact point. Details.
- "71% of B2B customers prefer search engines." Likely from a 2014 Google study. Details.
- "80% of B2B buyers value educational content." Sourced to a homepage. Details.
- "64% would rather tweet support than call." Old Twitter marketing material. Details.
- "VR/AR and medical marijuana are the biggest B2B industries." An opinion, not data. Details.
- "59% of B2B buyers are millennials." Superseded by Forrester's 71% for Millennials and Gen Z. Details.
The original B2B House guide, archived in full
The B2B House is now part of Kiin. So that every link to its guide still makes sense, the complete original is kept below, section by section, exactly as it was last published (only typos fixed). Figures in it are from the dates its authors gave; the sections above give the current numbers and sources. Open any section to read it.
What is B2B marketing?
Business-to-business (B2B) or business-to-government (B2G) marketing is a type of marketing that involves businesses and other organizations (such as nonprofit organizations, schools, or governments) purchasing products from other companies or institutions.
Compared to B2C, Marketers think that B2B marketing is typically more basic, informative, and boring. This is not true because company purchase decisions are also decided by humans. And humans have emotions. B2B marketers tend to forget that and treat their prospects like robots.
B2B marketers frequently sell to buying committees comprising a variety of important stakeholders in the current business world. This results in a complicated and occasionally difficult environment, but as data sources get more reliable and accurate, B2B marketers’ capacity to identify problems and provide customers with pertinent, individualized information has significantly increased.
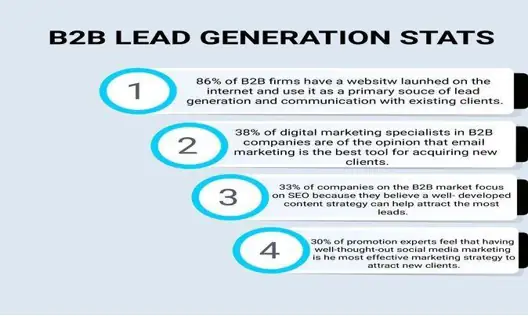
B2B Lead Generation Statistics
After seeing the statistics mentioned in the above image, you can easily realize the significance of B2B marketing and how different B2B companies are benefiting from this approach.
What percentage of Companies are B2B/how many B2B companies are there?
B2B companies account for major largest companies in the United States including Microsoft Corp, IBM, General Electric, Apple, Twilio Inc., Snowflake Inc., Atlassian Corporation Plc, Zoom Video Communications, etc.
Here we have gathered some more statistics about the number of B2B companies and the percentage of how many B2B services and products are there in the B2B market.
• B2B items make for 12.1% of all online sales made by American businesses, while B2B services account for 11.5%.
• The bulk of B2B purchasers are millennials, who make up 59% of the market.
• In the US, 23.6% of companies operate in the B2B sector.
• 77% of B2B consumers say they do extensive research before making a purchase.
• In the upcoming year, 35% of B2B firms anticipate a rise in online sales.
B2B Ad Spending & Marketing Trends
There are more than 3 million B2B businesses in the U.S., generating trillions of dollars in revenue annually, according to data from Statista.com. High B2B business success in the US is also evident from B2B traditional advertising spending in the United States as shown by the graph below.
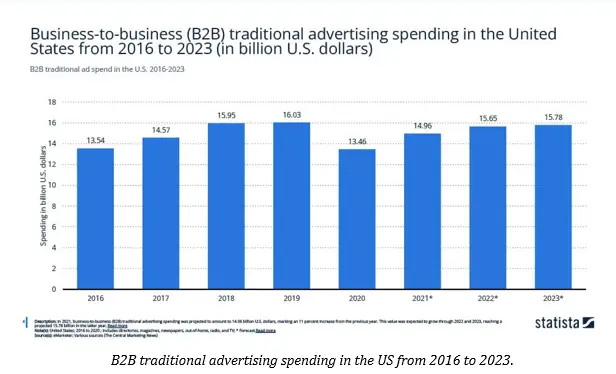
B2B traditional advertising spending from 2016 to 2023
According to Insider Intelligence, a total of $22.14 billion was spent on advertising by US B2Bs in 2020, down from $22.58 billion in 2019. The market for B2B advertising expenditures as a whole rebounded in 2021, increasing by 16.5% YoY to about $26 billion. Over $30 billion will be spent on US advertising by B2B companies by 2023.
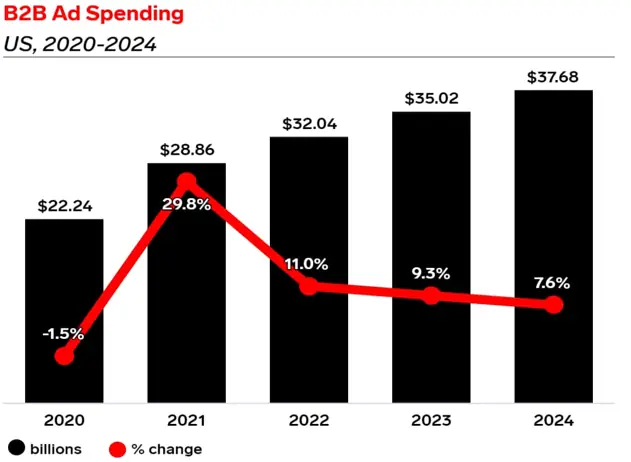
B2B ad spending
B2B companies should also focus on their budgets and how much they plan to spend on content marketing depending on how much budget the companies have for marketing purposes as shown by the graph below.
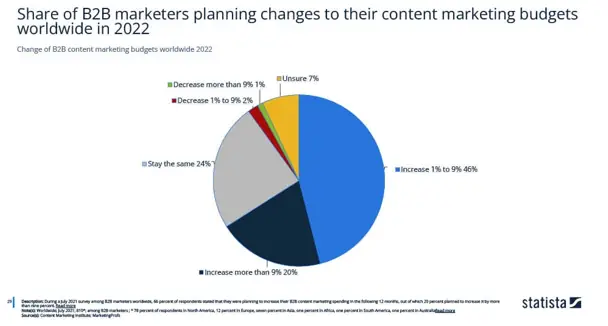
Percentage of B2B marketers who want to change their content marketing budgets
Sometimes the budget may remain the same for B2B marketing purposes but the marketers may change their strategy. For example, if they spend more on video marketing, they start using less budget for it and move toward blogging and search engine optimization for organic results. So where B2B businesses will spend while proceeding with their content marketing strategies also impact their sales and help them to see the effectiveness of particular strategies.
It is also worth noting that more than 70% of B2B businesses focus mainly on video marketing as it is one of the most effective content marketing strategies to attract potential B2B customers.
Event and email marketing are also some other approaches as shown in the graph below.
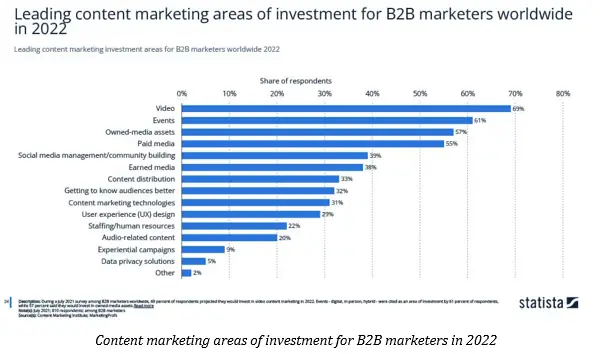
Content marketing areas of investment for B2B marketers in 2022
How many B2B companies use content marketing?
Since the rise of digital transformations, digital marketing, and the pandemic, B2B audiences shifted to digital communication for work, networking, and business transactions, content marketing has been ingrained in B2B marketing.
Content marketing: What is it? the act of producing and disseminating information (such as blogs, podcasts, white papers, webinars, social media postings, and videos) with the goal of drawing in, holding the attention of, and converting new prospects while keeping hold of existing clients.
Brand recognition, demand creation, sales pipelines, and customer loyalty and retention are all supported by content marketing. According to a 2021 Semrush poll, 97% of marketing industry respondents globally choose content as a technique and claim it is a component of their marketing strategy.
The production and delivery of information consume a substantial amount of time and financial resources.
According to a 2022 Casted analysis, US B2B content marketers spend their time creating content for social media, blogs, emails, and newsletters, producing at least one thought leadership asset, such as a white paper or webinar, per week. Additionally, content marketers are in charge of content distribution, which includes posting material to websites and social media outlets.
Despite the fact that budgets for content development might vary, at least 50% of marketers globally who are aware of their company’s content marketing budget allocate that amount to B2B content marketing. According to a July 2021 poll by the Content Marketing Institute, 39% spend a quarter or more (CMI). In 2022, this spending is expected to increase by two-thirds of these marketers.
Look at the statistics showing paid content distribution methods used by B2B Marketers, Tech journalists, and Content marketers, etc.
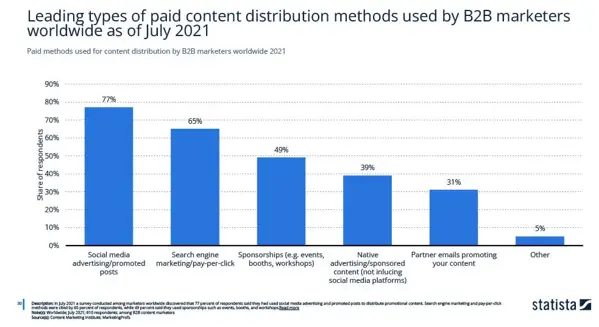
Effectiveness of leading types of paid content distribution methods
Let’s know more about content marketing and why it’s so important.
• 80% of B2B consumers value content that educates a potential client about the product. Nearly 60% of them eventually express a want to learn more about the product. (WebFX)
• The revenue increase and ROI of an ABM-led content syndication campaign may reach 200% and 300%, respectively. (B2B Unbound)
• You may produce over 500 MQLs each month by using the ABM strategy for content syndication. (B2B Unbound)
• Thought leadership is valued by decision-makers. Nearly 54% of decision-makers read about thought leadership for more than an hour each week. (LinkedIn)
• Expectations for thought leadership are growing. Almost 30% of the decision-makers give vendors’ thought leadership a mediocre or unsatisfactory rating. (LinkedIn)
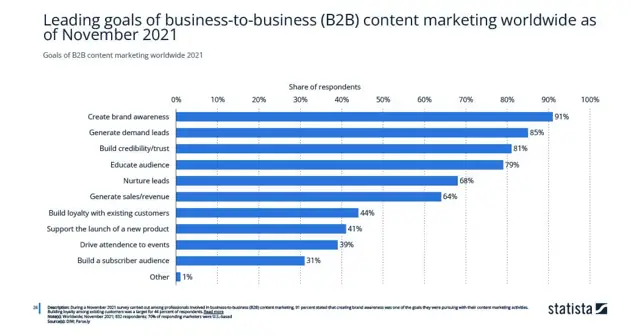
Leading goals of B2B content marketing strategies
Now look at the graph and you will notice that B2B content marketing strategies always have some goals related to brand awareness and addressing the demands of the customers in the best possible way. However, when B2B CMOs fail to link content marketing to corporate goals, they lose a crucial opportunity to drive growth and be relevant to their audience. All content marketing efforts should be focused on achieving quality lead generation. So B2B marketers should focus on the content that can help them in creating brand awareness, generating leads, and building credibility and trust.
Let’s have a look at some relevant statistics by Ahrefs.
• A content marketing strategy will never be developed by 4% of B2B marketers. It means this category of B2B marketers does not use content marketing strategies at all, and thus loses big opportunities for lead generation.
• 87% of B2B marketers place a higher priority on the informational requirements of the audience than on the company’s sales or promotional messages.
• The majority of B2B marketers who use content marketing outsource their content generation.
• Social media, email, and the company’s blog or website are the top three organic content delivery platforms employed by B2B marketers.
• 96% of B2B content marketers utilize LinkedIn.
• Only 28% of B2B marketers do not make use of channels for paid content distribution.
• When developing content, 78% of B2B marketers use keyword research for SEO.
The graph below also gives us more knowledge about B2B content marketing efforts and how difficult it is for B2B marketers to exactly estimate the effectiveness of their efforts.
Top marketing strategies B2B companies are using?
When it comes to marketing, B2B companies are increasingly relying on social media and digital marketing to help them reach their audiences.
Some other strategies that are also being used by B2B marketers include:
-Account-based marketing:
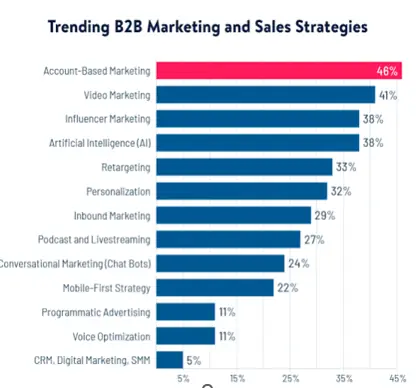
Account-based marketing
As shown by the above graph, ABM is the most effective strategy (46%) among the trending b2b marketing and sales strategies. The close successful B2B marketing strategies are video marketing (41%), influencer marketing (38%), and artificial intelligence (38%).
We are able to provide more unquestionable hard, cold numbers that demonstrate the effectiveness of our ABM strategy.
So let’s examine some data to assist us to focus on the indicators we ought to be tracking.
, According to a survey of B2B marketers, 87% of those polled said the ROI on their ABM campaigns was higher than that of their other marketing expenditures.
, The average transaction size has increased in 91% of ABM programs, with 25% seeing increases of more than 50%.
, 86% of marketers claim that ABM has increased their win rates.
, ABM has increased the number of opportunities by 70%.
, An increase of 28% in deal/sale velocity.
We suggest? Create an ABM dashboard with your VP of Sales and report on these figures jointly.
Now let’s move to content marketing which is also emerging as an effective B2B marketing strategy.
, Content Marketing, Content marketing is a form of marketing in which messages about products or services are distributed for the purpose of educating and informing potential consumers about the benefits of those goods or services. Companies claim that video content marketing increases ROIs in 75% of cases. 71% of marketers who use video make original videos from the start. 72% of businesses are certain that videos increase the effectiveness of customer conversion.
Customer Relationship Management[LS1], CRM is an area of business technology that focuses on managing relationships with customers. An important aspect of CRM is identifying and reaching out to potential customers who have not yet made a purchase from a company. The most common form of content marketing is outsourced by 50% of businesses. The size of a typical B2B content creation team has grown by 31% over the past 12 months.
See the graph below to understand the CRM statistics.
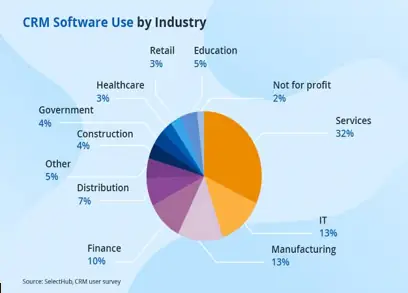
B2B businesses using CRM software
Pay Per Click Advertising (PPC), Pay-per-click advertising (PPC) takes place when someone clicks on paid links for your company. 16% of B2B organizations spend the most on digital marketing through online advertising.
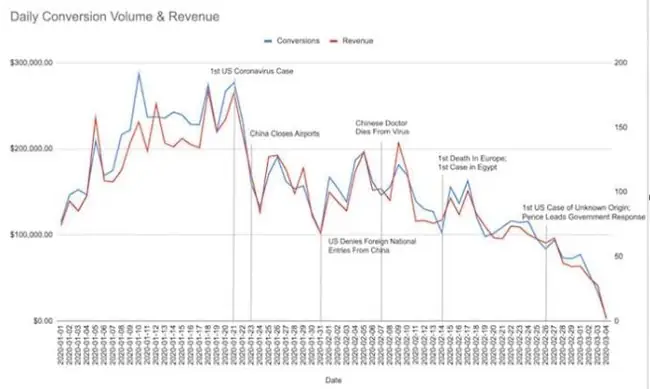
Effect of pandemic on B2B PPC marketing
PPC marketing is a staple of any B2B marketer’s digital marketing plan. Its efficacy has also increased as a result of data analysis and wise decision-making.
Email marketing: Email marketing is now being helped by AI and ML with real-time adjustments. Email marketing will undoubtedly continue to advance and is clearly here to stay.
• According to B2B marketing data, 82% of marketing professionals use email messages as a technique to spread the word about the content they provide.
• Five B2B emails sent on average only get one opened. Email is the primary method of communication for 84% of B2B marketing experts.
• Newsletters are used by 81% of B2B content marketers to update their readers on news and boost sales chances.
• 16% of B2B companies spend the majority of their budget on email marketing.
Blogs: They are an essential part of practically any content team. Regularly maintained blogs increase your site’s inbound traffic and provide you organic visibility. You should do more study on your audience’s preferences, worries, aspirations, requirements, and hobbies if you want your blogging to be more effective. You can use these details as a reference while creating blog entries. It is very easy if you are committed because statistics show that it takes 3 hours and 55 minutes to write a blog post. This duration kept changing as people wanted more updated knowledge.
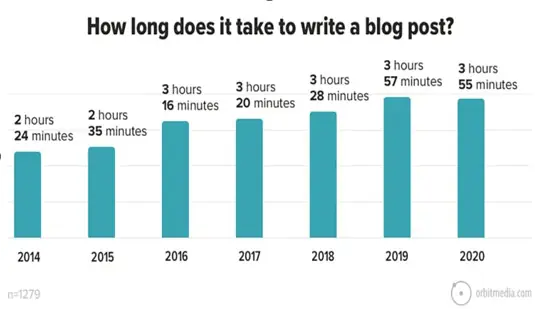
Average duration to write a blog post
Search: SEO best practices are difficult to operate since they vary as frequently as Google’s algorithm (a lot), yet every B2B marketing plan must take this into account. Recently, searcher intent signals have become more important than keywords and metadata. 95.5% of traffic goes to the first SERP (search engine results page). The majority of B2B clients are accustomed to researching online before making an offline payment. Search engines are preferred by 71% of B2B customers when looking for information online. B2B marketers receive organic search traffic for 70% of their traffic.
Social media: Both free and paid efforts have to be included. You may connect with and interact with prospects on social networks, where they are engaged. These channels are increasingly being used by B2B buyers to investigate potential providers before making selections. Pinterest is used by one in every four B2B marketers to advertise their companies online. 95% of B2B businesses have a specific budget set out for content creation.
Moreover, 80% of B2B and B2C businesses start their advertising campaigns on social media platforms with Google Ads. 61% of B2B marketers disseminate their content online using sponsored advertisements.
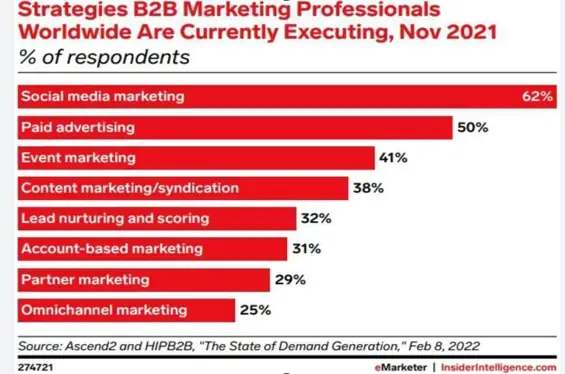
Strategies B2B marketing professionals worldwide are currently using
Let’s have a look at some statistics about effective social media platforms for B2B content marketers.
• According to a CMI report, 97% of B2B companies use LinkedIn as part of their content marketing strategy.
• Twitter reports that 64% of users would rather tweet a specialized support account on Twitter than call a company.
• B2B marketers have the highest chance of connecting with their target market of other company owners on Facebook. As of Q4 2021, Facebook has 1.93 billion daily active users and over 2.91 billion monthly users, according to Statista. 10+ million of those users are strictly companies that advertise on Facebook.
Most of the story is revealed by this graph.
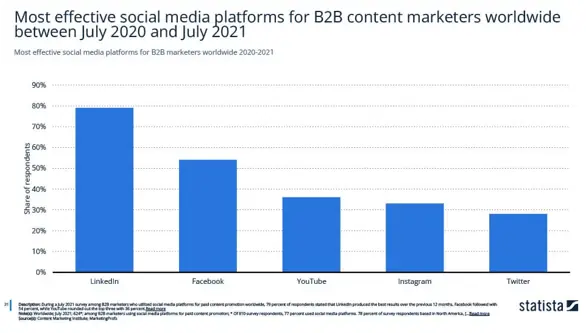
Most effective social media platform for B2B content marketers worldwide
A third of all online time is spent by internet users on social media. Social media is the primary method used by 25% of marketing companies to raise brand awareness. 84% of B2B companies report using influencer marketing to raise brand awareness.
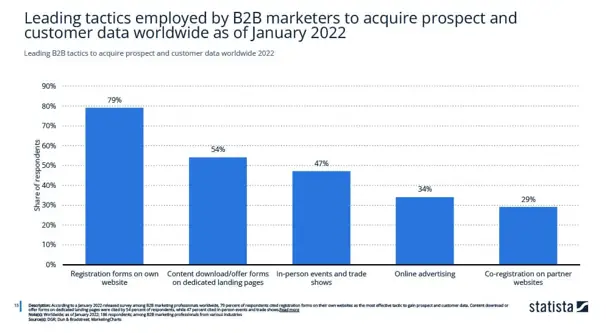
leading tactics used by B2B marketers as of Jan 2022
The core purpose of all these B2B marketing strategies is to increase conversion rates.
A study from Forbes shows that B2B marketing campaigns have a higher conversion rate than B2C ones. When we look at the statistics, it becomes clear why these campaigns are focused on their target audience and understand what their clients really want.
It is safe to say that the marketing strategies deployed by B2B companies have changed a lot over the years.
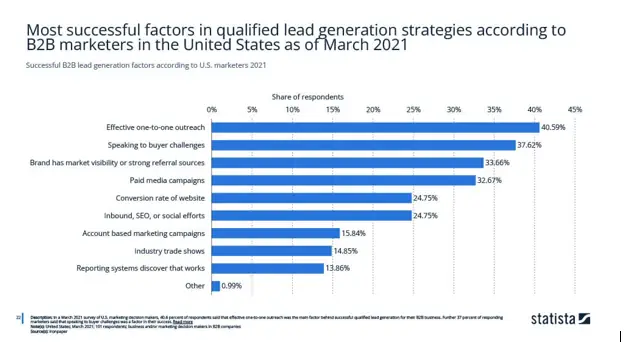
most successful factors in qualified lead generation strategies by B2B marketers
As the above graph shows, the major factors stated by Statista in qualified lead generation strategies are effective one-to-one outreach (40.59%), speaking to buyer challenges (37.62%), Brand has market visibility or strong referral sources (33.66%), paid media campaigns (32.67%), the conversion rate of the website (24.75%), and inbound, SEO, or social efforts (24.75%). Others include account-based marketing campaigns (15.84%), industry trade shows (14.85%), reporting systems (13.86%), and others (0.99%).
How is B2B marketing success measured? B2B marketing analytics
According to Parse.ly, 53% of content marketers do not link their content to revenue targets, and 49% are unaware of how their content is doing.
To measure the success of B2B marketing, it is also very important to check out which goals can be achieved and how they can impact overall sales.
You should carefully consider what you want to track and what B2B success measurement KPIs are required to achieve your company goals before developing a B2B marketing analytics plan.
You can also measure your success from the goals you wanted to achieve.
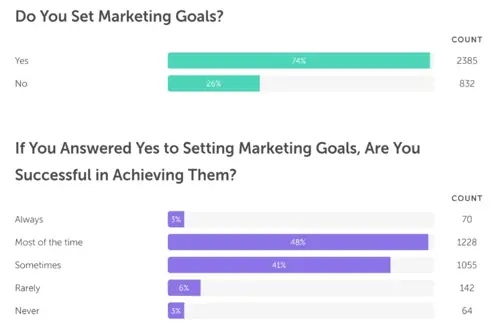
Marketing Goals
According to Backlinko, Only 3% of B2B marketers that establish targets always succeed in achieving them while 74% achieve only some of their goals.
So the core thing that matters is how many prospects convert, how many leads enter your funnel, and how much value each client brings to your bottom line, all of these metrics need to be connected to your revenue model. These measurements can be categorized as follows:
Volume: How frequently your emails are opened and clicked, or how many people visit and view your website and other marketing materials.
Time: How long leads take to go through your marketing funnel, how long leads spend on average in each stage of the funnel, and how frequently prospects respond to efforts like email sequences.
Conversions: They are the percentage of prospects who become leads, MQLs, or SQLs.
Value: Which aspects of your marketing strategy are having an influence on your ROI, such as the cost to move a prospect from the MQL stage to the MQL stage or the channel that is generating the most leads?
It seems like a lot all at once. But today you may use ready-made templates to build datasets and dashboards because of the development of B2B marketing analytics technology.
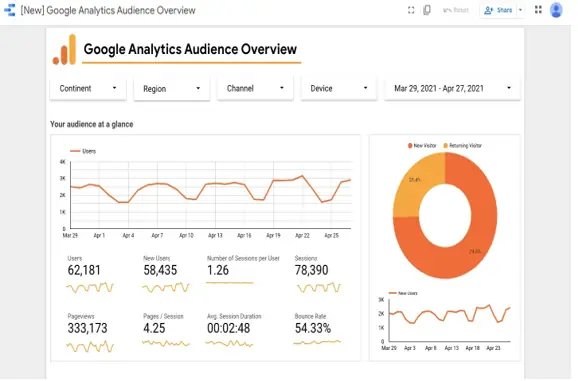
Google analytics tool measuring B2B marketing success
As you can see from B2B marketing analytics, knowing where your consumers are coming from, which marketing initiatives they are reacting to, and what initiatives bring in the most money is essential to the success of your whole marketing plan.
The good news is that you can put all of this on autopilot using B2B marketing analytics. Datasets, lenses, and computerized dashboards have made it possible for marketers to monitor the most profitable campaigns in real time.
B2B marketing challenges statistics
Various factors affect the accomplishment of B2B lead conversion goals. For B2B businesses, the most important thing is to create brand awareness and credibility. So the first goal to achieve B2B success is to create brand awareness (80%). Others are building credibility/trust (75%), educating audience (70%), generating demand/leads (60%), building loyalty with existing clients/customers (60%), nurturing subscribers/audience/leads (49%), driving attendance to one or more in-person events (47%), generating sales/revenue (42%), building a subscribed audience (32%) and supporting the launch of a new product (42%) as shown by the graph below.
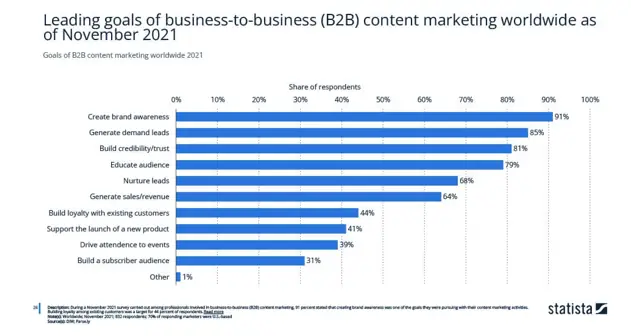
leading goals achieved with the help of content marketing among B2B marketers
B2B business success greatly depends on B2B marketing as it has the ability to increase sales, brand equity, and market share when B2B CMOS completely integrate the power of content with their organization’s brand identity and desired audience. The CMO’s ability to clearly communicate to all stakeholders the need of linking marketing to business strategy is key to the effectiveness of content within a marketing plan.
During the journey of B2B marketing, B2B businesses also face some challenges such as financial issues that become a big hurdle for them as shown by the graph below.
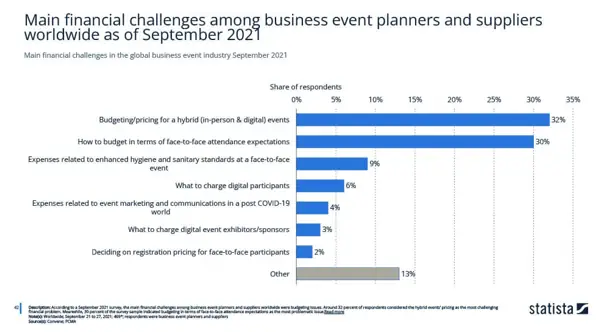
Financial challenges faced by B2B marketers during business event planning
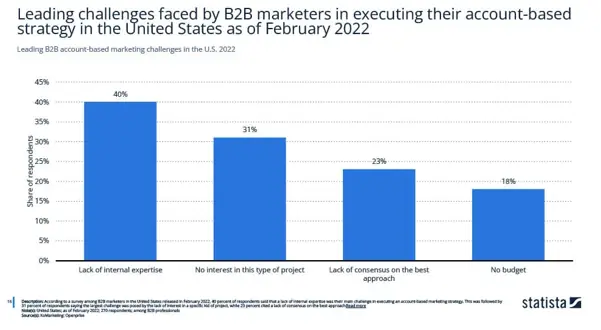
Challenges faced by B2B marketers
Creating high-quality leads is one of the main issues for 37% of marketers.
For a variety of reasons, lead generation is challenging for marketers.
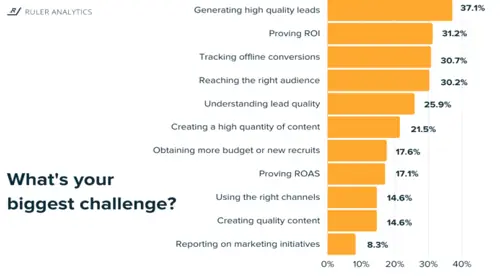
B2B marketing challenges
For starters, lead tracking has problems. How can you be certain that you are correctly tracking each conversion point whether leads are converting by form, phone, or live chat? You’ll find it difficult to connect your high-quality leads to your marketing efforts without this tracking in place. You won’t ever be able to effectively optimize your marketing without it.
What are the biggest B2B industries?
Marketers believed that marketing has evolved more in the preceding two years than in the previous fifty years, according to Adobe research. Today, more than five years later, it appears that change is happening even faster.
Virtual and augmented reality (VR/AR), medical marijuana, financial technology (FinTech), biotechnology, and content marketing are the top five B2B businesses.
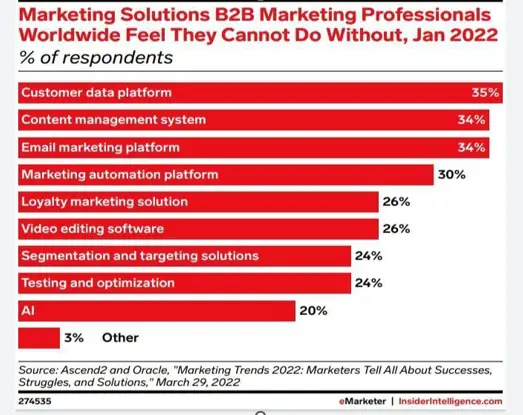
mandatory B2B marketing solutions
With a projected CAGR of 31.5% between 2021 and 2026, AR/VR growth is predicted to be particularly noticeable.
Consider the variety of marketing technology (MarTech) products that are currently offered. There are now 6,829 distinct MarTech products offered by 6,242 suppliers across 55 categories as of the most recent tally. There is no indication that things will slow down any time soon, and this marks a 27% rise over the amount from the previous year.
Is B2B eCommerce growing?
According to Digital Commerce 360, B2B eCommerce sites, log-in gateways, and marketplaces saw growth in online sales of 17.8% to $1.63 trillion in 2021. According to Statista, the B2B eCommerce industry in North America will reach $4,600 billion by 2025.
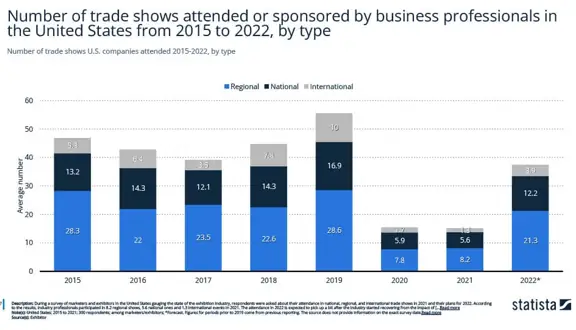
Sponsorship of trade shows as the latest effective B2B marketing strategy
It is evident that B2B enterprises are no longer embracing e-commerce as a hip new channel. Instead, according to McKinsey & Company, by 2022, around 65% of B2B businesses across industries would exclusively conduct business online. Additionally, B2Bs are now more likely to provide eCommerce than in-person sales for the first time.
Why? because it increases income. According to the same Mckinsey & Company report, eCommerce accounts for around 18% of B2B companies’ total sales. greater than video conferencing, email, and phone.
This is consistent with statistics provided by Wonderman Thomson, which stated that as of 2021, 49% of B2B purchases in the UK, US, and China take place online.
However, having a simple website or a poor client experience is no longer acceptable if you want to thrive with B2B eCommerce.
However, 52% of B2B purchasers claim to be dissatisfied with the online purchasing process. Even worse, if a supplier’s digital channel couldn’t meet their demands, a startling 90% of B2B buyers would switch to a rival.
In order to provide the shopping experiences that consumers have grown accustomed to, B2Bs must give their digital transformation top priority in 2022.
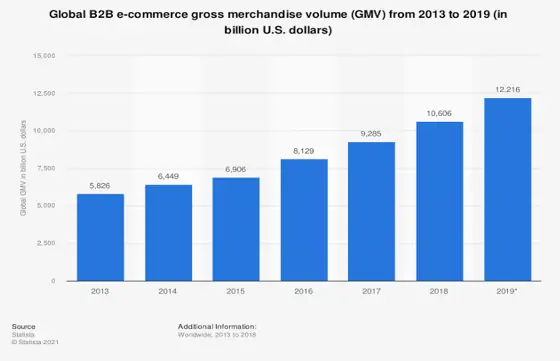
B2B eCommerce gross merchandise volume
The increasing trend is observed with every passing year when it comes to observing the global B2B eCommerce gross merchandise volume as shown by the graph above.
How is B2B marketing changing?
For 36.6% of wholesalers, modernizing old systems will be a big difficulty in 2022. However, you must make sure you have the appropriate methods in place if you want to provide your new and existing clients with a better, more B2C-like experience.
B2B Marketing continues to evolve quickly especially post-pandemic. Based on statistics, we can see that trade shows lost their importance due to many restrictions in 2019. Trade shows are projected to return to their pre-pandemic market share levels only after 2026. From 2021 to 2026, B2B marketing is projected to rely more on digital and marketing technology, with an annual ad spend increase of 2 billion US dollars.
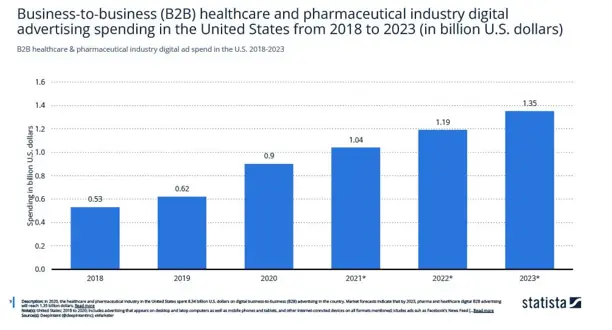
B2B healthcare and pharmaceutical digital advertising spending
Remember that B2B healthcare and pharmaceutical industries are already passing through the phase of digital transformation and are rapidly changing their B2B strategies.
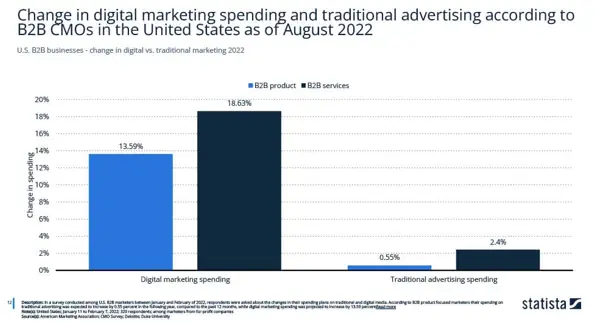
Effectiveness of new digital marketing strategies as compared to traditional advertising according to B2B CMOs
Here is another graph that tells how effective it is to test the new digital marketing techniques and how spending less can yield more results. When we compare the investments between traditional advertising for B2B marketing purposes and the digital latest B2B marketing and advertising techniques, we come to know that the budget has considerably changed as shown by the graphs. However, the graph below shows a decline of -26% in traditional advertising spending in 2020 due to the pandemic which immediately rose up in 2021 to 11.2%. The estimated fall in 2023 is due to new digital marketing strategies like using more advanced CRM software that helps to save money.
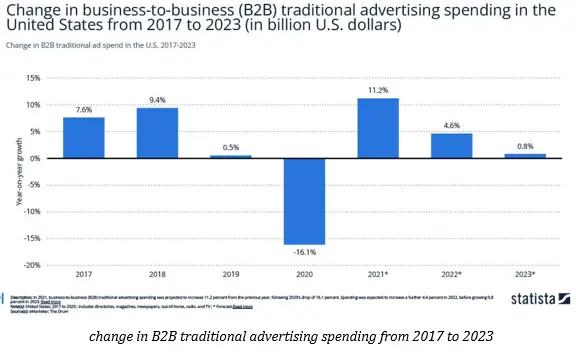
Change in B2B traditional advertising spending from 2017 to 2023
change in B2B traditional advertising spending from 2017 to 2023
You can also observe the change in B2B marketing trends from the graph below. According to Statista, 93% of respondents to a study of B2B marketers from all over the world in August 2021 stated that they were including digital advertisements in their digital marketing plan. 90% of respondents indicated they used digital content, while 92% said they used social media.
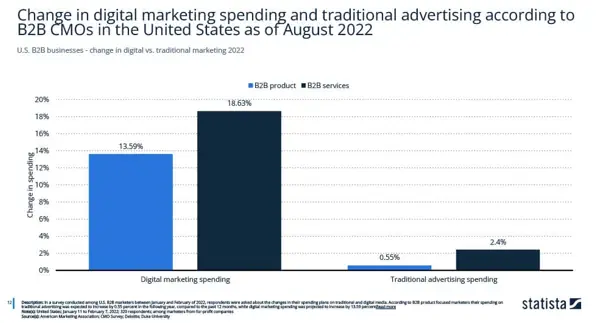
Change in digital marketing trends and adoption of new channels
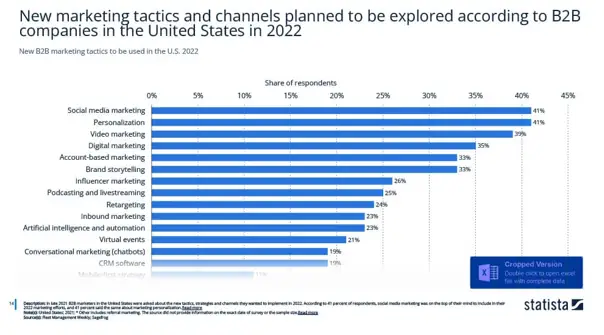
effectiveness of new marketing tactics and channels
As shown by the above graph, social media marketing, video marketing, and personalization are the major new marketing tactics and channels to attract potential B2B leads.
How does B2B marketing work?
B2B marketing is a complicated process that requires a lot of strategy and planning. You will need to understand your target audience, their preferences, and hidden desires in order to make an effective campaign.
B2B marketing is worth it since the conversion rates are higher than consumer-focused content. It can be expensive, but it’s worth it if you take the time to plan everything out.
Marketing professionals in B2B markets typically work at the “account” level for a particular client and jobs vary significantly in scope and complexity. There are many different types of accounts B2B marketers may deal with, each with its own unique set of challenges.
A key objective for any B2B marketer is to satisfy the clients by understanding their needs and objectives while also fulfilling their own company’s objectives. This can sometimes be tricky.
Creating quality content for your target audience that resonates with them has been found to be more effective than any other strategy used by marketers.
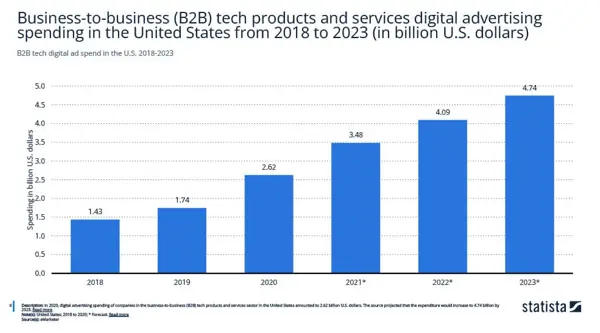
B2B marketing efforts and expenditures
Another important point to be noted about this strategy is that it can help in lowering your cost per lead significantly.
The cost per lead metric calculates how much it cost you when a new lead comes from your marketing tactic
B2B Branding statistics
The majority of B2B clients are accustomed to researching online before making an offline payment.
Our study about demand generation budget changes gives us an idea of B2B branding statistics. 58% of respondents said that it is increasing. 28% of the B2B marketing professionals think that the demand generation budget is constant while 14% said that it is decreasing as shown by the graph below.
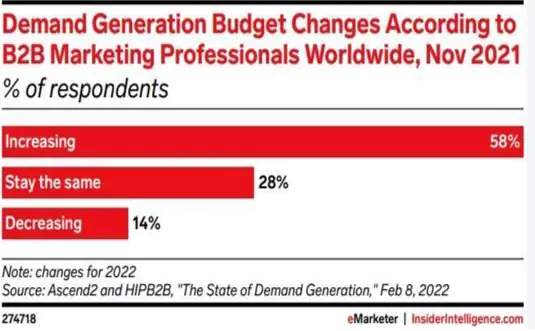
demand budget changes according to B2B professionals
demand budget changes according to B2B professionals
The report shows that the difficulty level for sales and revenues attributed to marketing is 41%. It is 33%, 28%, and 26% for marketing ROI, customer lifetime value, and customer acquisition and retention respectively.
Various branding statistics also show that trade shows have also played a vital role in B2B marketing as shown by the graph below
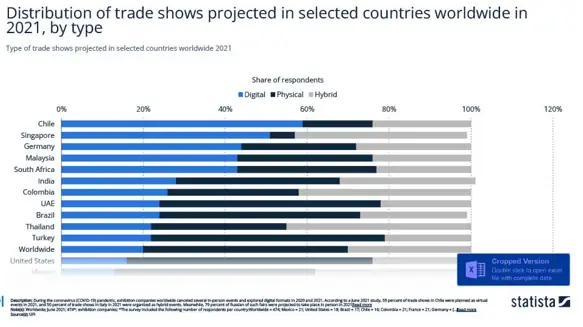
Distribution of trade shows projected in selected countries for B2B marketing
While going through the journey of B2B marketing, various challenges are also faced by B2B businesses, especially generating quality leads (42%), collecting quality data (40%), generating enough leads (33%), and measuring performance (32%). Others include aligning marketing and sales, attributing revenue to marketing, and building an efficient technology stack; you can see detailed statistics below.
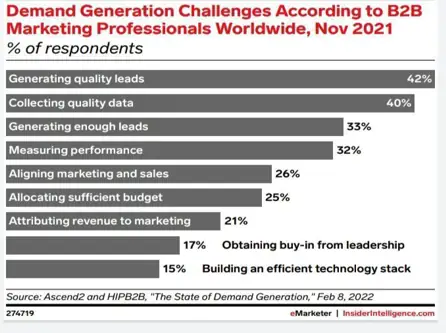
Challenges faced by B2B companies during the branding process
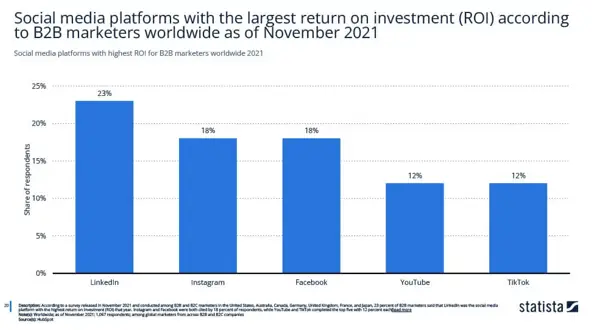
Social Media Platforms ROI
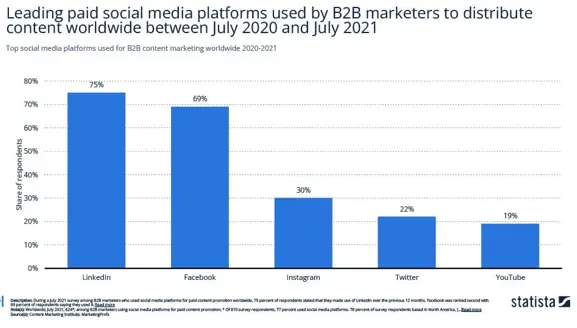
Leading paid social media platforms used by b2b marketeers
B2B video marketing statistics
• The efficacy of video marketing is a topic of confidence for B2B marketers. Over 85% of B2B marketers now use or intend to employ video marketing. Customers also choose movies (Hubspot). The majority of consumers (almost 94%) view videos to learn how a product or service operates. (HubSpot)
• The perfect length for a marketing video is one minute. If the video is under one minute, the majority of viewers will see it through to the conclusion. (Cience)
• 98% of B2B marketers claim that video content converts at least as well as other types of content. (Vidyard)
• 84% of customers claimed that seeing a video motivated them to buy something. (The Yans Media)
Some more interesting statistics about B2B video marketing are shown in the graph below.
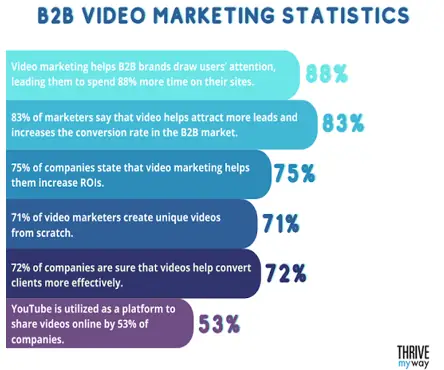
B2b video marketing statistics
B2B Marketing Automation Statistics
We all know that marketing automation can make B2B tasks much simpler. For example, you can continue with your regular marketing efforts by scheduling your posts, automating your email marketing with the help of customer journey automation tools and using AI Technology for content creation, and so on.
Let’s start by examining some statistics that show how many businesses and marketers are adopting marketing automation:
• A minimal amount of marketing automation is being used by 34% of the organizations in the survey.
• 25% of the businesses surveyed use marketing automation heavily.
• In the next two years, 28% of surveyed businesses that don’t now utilize it aim to do so.
• 13% of businesses do not use any marketing automation.
Creator: Pedalix
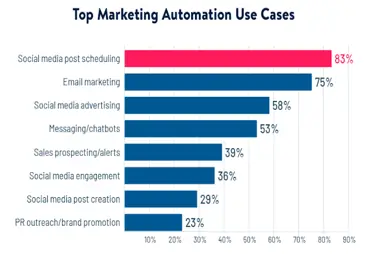
Top marketing automation use cases
The above image gives you a clear idea of B2B companies using social media scheduling as a major automation strategy (83%). Email marketing (75%) and social media advertising (58%) occupy second and third positions respectively. The most common example of using marketing automation tools is the utilization of chatbots for keeping customers engaged.
In their most recent State of Marketing study, HubSpot also examined the use of marketing automation and discovered that:
79% of businesses automate marketing, compared to 45% that automate sales and 33% that automate finance.
The corporate sector that uses automation the most is marketing.
Look at the graph below and you will notice that B2B marketing automation is getting more popular with every passing day.
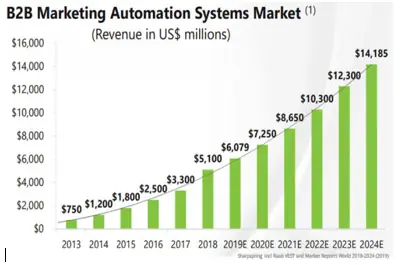
B2B marketing automation systems market
B2B Email Marketing Statistics
Here are some major email marketing statistics that we have gathered.
• A business requires, on average, 3 hours and 55 minutes to compose one effective email marketing campaign, per B2B marketing data.
• Press releases and blog postings when combined with email marketing draw twice as many leads as instructive material.
• 52% of B2B customers say they prefer to buy products from businesses that produce their own content.
• The most common tactic used by B2B companies is content marketing.
• Product specs are the top piece of content, according to 66% of B2B purchasers.
• For 81% of B2B marketers, email newsletters are the most popular form of content marketing.
Some other email marketing statistics are revealed by the graph below.
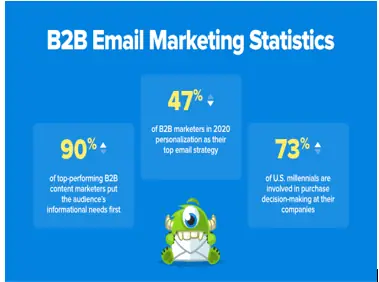
B2b Email Marketing Statistics
B2B influencer & event marketing statistics [LS2]
Statistics are powerful tools that can be used to measure and evaluate different aspects of the business.
In the B2B marketing world, statistics play an important role in understanding how many marketers are influencers, the average number of followers they have, and what events they attend.
According to research published on Lee Odden’s TopRank Marketing blog, 86% of B2B firms had success with influencer marketing. B2B firms may increase sales by using influencer marketing to increase brand recognition and reputation.
Look at more B2B influencer marketing statistics in the image below.
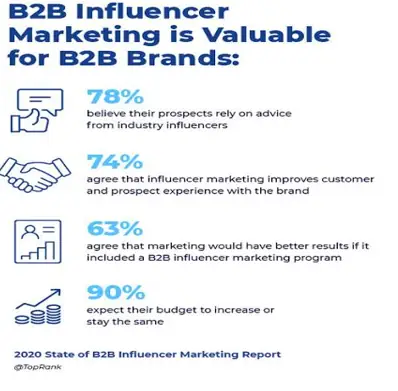
B2B influencer marketing statistics
B2B influencer marketing statistics
Influencer marketing is a great way to promote a brand or product on social media by targeting influential people within a specific industry.
Event marketing can be beneficial for both the brand and attendees.
These two forms of marketing often intersect with one another as event organizers may want to hire influencers to promote their events online.
Through the power of social media, brands can now take advantage of B2B influencers and event marketing. The use of these channels has been growing in popularity with a 44% annual growth rate over the past decade.
Statistics show that 6 out of every 10 B2B marketers plan to increase their marketing budgets in 2018. Influencer marketing is one of the top priorities for marketers near and far as it provides a unique way to reach customers and prospects at scale.
Final Verdict
Marketing of goods or services to other businesses and Organizations is referred to as business-to-business marketing. It differs significantly from B2C marketing, which is focused on customers, and not on businesses. According to all the B2B marketing statistics, we can easily understand that more budget is required for effective B2B marketing strategies as compared to B2C. Various B2B marketing channels are also growing day by day including trade shows, social media channels, and email marketing automation.
If you also want to share some interesting statistics regarding B2B marketing and the latest B2B trends, feel free to comment in the comment section below.
• Tags:
• B2B Marketing Strategy
B2B marketing statistics: frequently asked questions
How much do B2B companies spend on marketing in 2026?
The average marketing budget is 7.8% of company revenue in 2026, up from 7.7% in 2025, according to Gartner's 2026 CMO Spend Survey of 401 CMOs. Half of CMOs spend 6% of revenue or less. Paid media takes 31.4% of budgets, a five-year high.
How many people are in a B2B buying group?
Forrester's State of Business Buying 2026 finds the average purchase involves 13 internal stakeholders and 9 external influencers. Dreamdata observes 10 stakeholders in the average B2B journey, and Gartner's range for complex purchases is six to ten decision makers.
When do B2B buyers contact sales?
On average when they are 61% of the way through the buying process, down from 69% in earlier years, according to the 6sense 2025 Buyer Experience Report (4,000+ buyers). By then 94% have ranked their shortlist, and they buy from their pre-contact favourite 77% of the time.
What percentage of B2B buyers prefer not to talk to sales?
61% of B2B buyers prefer a rep-free buying experience overall, according to a Gartner survey of 632 B2B buyers published in June 2025. 73% actively avoid suppliers who send irrelevant outreach.
What is the best social media platform for B2B marketing?
LinkedIn. 85% of B2B marketers say it delivers the best value of any social platform, against 28% for Facebook and 22% for YouTube (Content Marketing Institute, 2025 edition), and 76% rate it the most effective channel for thought leadership (CMI, 2026 edition).
What is the 95-5 rule in B2B?
The idea, from Professor John Dawes of the Ehrenberg-Bass Institute in a 2021 paper for LinkedIn's B2B Institute, that only about 5% of B2B buyers are in the market in any quarter and 95% will buy later. It follows from companies switching major suppliers about once every five years.
Do LinkedIn ads work for B2B?
Attribution data says they are associated with strong returns. Dreamdata's 2026 report finds LinkedIn takes 41% of B2B ad budgets with a 121% return on ad spend, against 67% for Google Search and 51% for Meta. Fibbler finds a median 7.0x influenced revenue per $1 across 1,000+ advertisers. Both describe association, not proof of cause.
How long is the B2B sales cycle?
The 6sense 2025 study puts the average buying cycle at 10.1 months globally and 11.1 months in North America. Dreamdata finds an average of 281 days from first LinkedIn ad impression to revenue.
How many B2B marketers use AI?
95% of B2B marketers use AI-powered applications, mostly for writing (89%) and images or video (53%), according to the Content Marketing Institute's 2026 survey. CMOs put 15.3% of marketing budgets into AI in 2026 (Gartner).
How much does a B2B lead cost on LinkedIn?
In the Kiin Labs panel of 1,000+ B2B LinkedIn ad accounts ($65M+ spend), the median cost is $164 per content lead and $350 per demo request lead, with the top quarter of advertisers paying $161 or less per demo lead. The median CPM is $36.23.
What happened to The B2B House B2B marketing statistics page?
The B2B House is now part of Kiin. Its B2B marketing statistics are on this page, with every figure it published kept in the section "Figures previously published by The B2B House", next to the 2026 figure.
How we built this page, and every source
We started from every statistic in The B2B House guide and every claim other sites link to it for (we checked its backlinks one by one). For each, we looked for the newest figure from the original publisher first: analyst press releases (Gartner, Forrester, McKinsey), the Content Marketing Institute's annual surveys, buyer studies (6sense, Edelman and LinkedIn), LinkedIn's own results, and attribution benchmarks (Dreamdata, Fibbler). We opened each source on 14 November 2026. Gartner, Edelman, eMarketer and Wyzowl block automated reading; for those we link the original and checked the figures against coverage published at the time, and say so under the table. Where there is no update we say so and keep the old figure with its date. Kiin's own figures come from the Kiin Labs panel, described in our method note. Corrections: [email protected].
- Gartner, 2026 CMO Spend Survey press release, 11 May 2026
- Chief Marketer, Gartner CMO Spend Survey allocations, 24 Jun 2026
- Gartner, media spend by objective, 8 Jun 2026
- Gartner, 2025 CMO Spend Survey press release, 12 May 2025
- Gartner, 61% of B2B buyers prefer a rep-free experience, 25 Jun 2025
- Gartner, The B2B buying journey
- Forrester, The State of Business Buying 2026, press release, 21 Jan 2026
- Forrester blog, Risk-averse buyers demand proof, Jan 2026
- Forrester blog, Younger generations are shaking up B2B buying, 25 Mar 2024
- 6sense, 2025 B2B Buyer Experience Report, 12 Nov 2025
- McKinsey, Five fundamental truths: How B2B winners keep growing (B2B Pulse 2024)
- Content Marketing Institute, 2026 B2B Content and Marketing Trends, 8 Oct 2025
- Content Marketing Institute, B2B Content Marketing Benchmarks, Budgets and Trends 2025
- Edelman and LinkedIn, 2025 B2B Thought Leadership Impact Report
- Edelman and LinkedIn, 2026 B2B Thought Leadership Impact Report findings, Nov 2026
- LinkedIn, Q4 FY26 earnings and business highlights, 29 Jul 2026
- LinkedIn, Q1 FY27 business highlights, 28 Oct 2026
- Dreamdata, 2026 LinkedIn Ads Benchmarks Report, Mar 2026
- Fibbler, LinkedIn Ads Benchmarks 2026, Aug 2026
- Ehrenberg-Bass Institute, Advertising effectiveness and the 95-5 rule (Dawes, for the B2B Institute, May 2021)
- Digital Commerce 360, US B2B sales exceed $15 trillion in 2025, 26 Jan 2026
- Digital Commerce 360, B2B Ecommerce Market Forecast Report
- US Census Bureau, QuickFacts: employer firms
- eMarketer, B2B Digital Ad Spend Forecast 2026
- Wyzowl, Video Marketing Statistics 2026
- Kiin Labs, LinkedIn Ads Benchmarks 2026, 150 LinkedIn Ads Statistics and LinkedIn Statistics 2026
Ilic, P. (2026). B2B Marketing Statistics 2026: Buyers, Budgets, Content and Ads. Kiin Labs (incorporating The B2B House). kiin.co/research/b2b-marketing-statistics. Free to cite with a link.
Putting more of your B2B budget into paid media? Send read access to your LinkedIn Ads account and we'll show you where it sits against 1,000+ connected B2B accounts, content and demo, on every metric. Free, read-only, one page.