
Every LinkedIn video campaign across every advertiser connected to Kiin Intelligence, Audience Network excluded: $10.2M of a $64.8M panel, 676 of 1,096 advertisers, 4,409 campaigns. The comparisons use the 3,764 video campaigns with at least 2,000 impressions and $50 of spend (642 advertisers). Every benchmark is a median across advertiser accounts; every "video costs more than an image" is the same advertiser running both on the same objective, paired within account. Length and shape come from the LinkedIn API for 1,702 company videos.
Ilic, P. (2026). Video on LinkedIn Ads: 2026 benchmarks. Kiin Labs. kiin.co/research/linkedin-video-ads-benchmarks. Figures are medians across advertiser accounts and paired within-account comparisons, USD, 7 Oct 2025 to 6 Oct 2026, LinkedIn Audience Network excluded. Free to cite with a link.
This study comes from Kiin Intelligence, the analytics layer behind Kiin, a London LinkedIn Ads agency with three ex-LinkedIn Marketing Solutions staff and 200+ B2B accounts under management.
Is your video budget buying attention or action? Send read access to your LinkedIn Ads account and we'll show you your cost per completed view, cost per click and pool-building cost against every table in this report.Free. Read-only access. No deck, no call, one page.
- ▶Video is 16% of LinkedIn spend. It buys watching, not doing
- ▶The eight findings that carry the report
- ▶How Kiin runs video now: 8 rules
- 00The panel: where video money goes
- 01Attention, not action: video against an image
- 02Which objective a video should run on, who to show it to, how to bid
- 03Thought leader video
- 04What people actually watch: retention, length, shape, copy
- 05Video and lead forms
- 06The halo test: does video make the rest of the account cheaper?
- 07Video as a pool builder, and what the pool is worth
- 08Benchmarks: video by objective, market and audience size
- 09Numbers to quote
- 10Video myths, with the verdict
- 11Method, robustness, what we can't answer
- 12Frequently asked questions
Video is 16% of LinkedIn spend. It buys watching, not doing
Most B2B teams run video because it feels like the grown-up format: it is how brands get remembered. The data agrees with half of that. Video holds people longer than an image, and a 50% view is one of the cheapest ways to put someone into a retargeting pool. But on every objective where you ask someone to do something, click, fill in a form, book a call, the same advertiser pays more with a video than with a single image.
So the question this report answers is not "does video work?". It is "what job is the video doing?". If the job is attention or pool building, video is a good buy. If the job is traffic, leads or demos, video is the expensive way to do it, and the cheapest version of it runs on the website visits objective, 15 seconds long, square.
The eight findings that carry the report
Each one links to the chapter with the table behind it. Stars are the number of paired advertisers (★ 5+, ★★ 25+, ★★★ 100+); ✱ means the 95% interval excludes zero.
Video is two products sold as one. As attention it is fair value: 6 to 8 seconds of watch time, 42% more dwell than an image, and cheap pool members. As action it is the most expensive format we measured outside brand awareness: every landing page click, form fill and lead costs more than the same advertiser pays with an image. Most accounts buy it as the second product and judge it as the first, or the other way round. Decide the job first.
How Kiin runs video now: 8 rules
The findings are what the data says. These are the decisions we took from it, the operating rules on every video campaign we run.
Judge video on attention, never on the pipeline report
Completed views, cost per completed view, dwell and reach into the target list. Every action metric favours an image.
Chapter 01 →Make it 15 seconds, square, with the point in the first 6
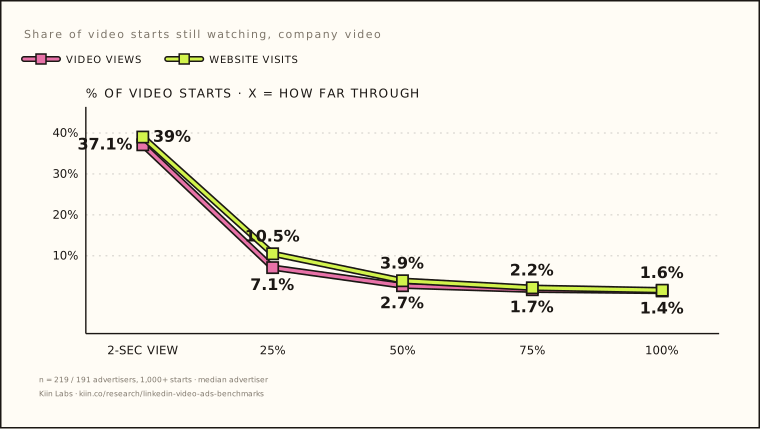
Only 7% of starts reach a quarter of the video and under 2% reach the end. Cost per half-watched view rises from $0.35 at 11 to 15 seconds to $2.08 at 31 to 60.
Chapter 04 →If the video must drive traffic, run it on website visits
Same watch-through as video views, 85% cheaper per landing page click. Never brand awareness for a video that needs clicks.
Chapter 02 →Thought leaders post static, not video
Static thought leader posts beat video on engagement, comments, clicks and cost per engagement in the same account.
Chapter 03 →Never put a lead form on a video
Documents for content offers, message ads for demos, single image for traffic.
Chapter 05 →Use video to fill pools, then ask for the demo in the inbox
15-second video on website visits → 50%+ viewers + document engagers + website visitors → message ad with a call ask.
Chapter 07 →Don't buy video expecting capture to get cheaper next month
No halo shows up in non-video cost per lead, cost per click or conversion rate. Budget it as its own line.
Chapter 06 →On video views, let LinkedIn bid
Auto 'maximise video views' pays 17% less per thousand than a manual cost-per-view bid; raising a manual bid 150% buys the same view for 90% more.
Chapter 02 →
The panel: where video money goes
Video is 15.7% of panel spend and runs in 62% of accounts. Most of it runs on the objectives that buy attention: video views, engagement and brand awareness are three quarters of it.
| Objective | Share of video spend | What it buys |
|---|---|---|
| Video views | 30% | two-second views and completions |
| Engagement | 27% | views plus reactions and clicks |
| Brand awareness | 22% | impressions |
| Website visits | 10% | landing page clicks |
| Lead gen | 7% | form submissions |
| Website conversions | 5% | tracked conversions |
Full panel, LinkedIn Audience Network excluded, 12 months to 6 Oct 2026: $10.2M of video in $64.8M, 676 of 1,096 advertisers, 4,409 campaigns. A quarter of video spend (24%, $2.4M) is thought leader video. The ten biggest video advertisers are 22% of video spend; every paired result in this report holds with them removed.
| Month | Video share of spend | Advertisers running video |
|---|---|---|
| Dec 2025 | 17.9% | 213 |
| Feb 2026 | 14.4% | 319 |
| Apr 2026 | 15.3% | 360 |
| Jun 2026 | 16.3% | 367 |
| Aug 2026 | 18.0% | 344 |
| Sep 2026 | 16.9% | 289 |
Video has held between 14% and 18% of spend every month since December 2025. The panel grew through the year, so read this as a level, not a trend.
Attention, not action: video against an image
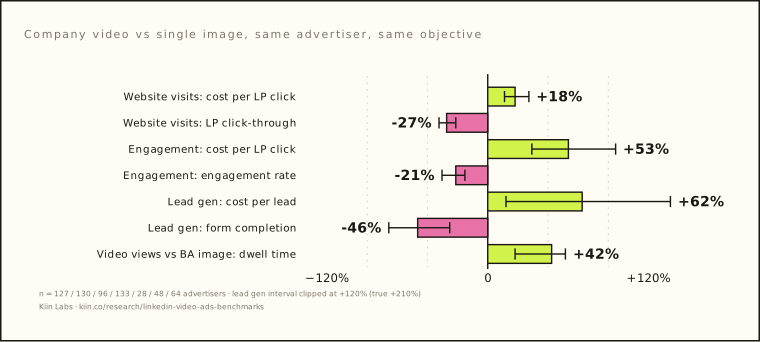
Same advertiser, same objective, video against a single image. On every objective that asks for an action, the video costs more per action. On the one thing it is built for, holding people, it wins.
| Objective | Video vs image, same advertiser | Advertisers | Read |
|---|---|---|---|
| Website visits | Cost per LP click +18% [+11, +27] ✱ · LP CTR −27% ✱ · CPM −9% ns | 127–130 | Same price per impression, fewer clicks |
| Website conversions | Cost per LP click +35% [+22, +73] ✱ · conversions per 1,000 impressions −26% ns | 43 | Same pattern |
| Engagement | Cost per LP click +53% ✱ · engagement rate −21% ✱ · follows −28% ✱ · CPM −12% ✱ | 96–133 | Cheaper impressions, much less response |
| Lead gen | Cost per lead +62% [+12, +210] ✱ · form completion −46% ✱ · form opens −4% ns | 28–65 | People open the form, then don't finish |
| Brand awareness | Cost per LP click +364% ✱ · CPM +25% (borderline) · engagement +5% ns | 45–76 | The worst place for a video that needs clicks |
| Video views vs BA image | Dwell +42% [+18, +51] ✱ · cost per LP click +152% ✱ | 48–64 | What video is for |
Even to a warm audience
The gap is not a cold-audience problem. On retargeting pools, website-visits video against a single image to the same people: click-through −28% ✱, cost per landing page click +15% [+4%, +33%] ✱, 30 advertisers.
Video against a document: two different jobs
On the engagement objective a document gets five times the engagement of a video (video −79% ✱, cost per engagement +225% ✱, 32 to 33 advertisers), but the video sends far more people to the site: click-through +527% ✱, cost per landing page click −91% ✱ (17 to 21). On website visits, video against a document: cost per landing page click −34% ✱ (10 advertisers). Documents build engaged pools; video, when it has to, drives the visit.
The clicks video does get are fine
On traffic objectives, post-click conversions per landing page click are the same for video and image visitors: +9% [−25%, +54%], not significant, 74 advertisers. Video does not bring worse visitors; it brings fewer of them per thousand impressions. The fix is not the landing page; it is either a better click-through or a different format.
View-through flatters video
63% of the conversions LinkedIn credits to company video are view-through (someone saw the ad and converted later without clicking); for single image it is 43%. In the same advertiser, 66% against 52%, higher for video in 70% of accounts. A video conversion report looks better than video's clicks do. Read video conversions as reach that happened to precede a conversion, not as conversions it caused.
The +18% on website visits is the honest number for video traffic: same CPM, a quarter fewer clicks. Everything worse than that is the wrong objective, not the format. Brand awareness on a video that needs clicks is the single most expensive set-up in this report.
Which objective a video should run on, who to show it to, how to bid
The same company video, in the same account, on different objectives. Website visits matches video views on watch-through and costs a seventh as much per click.
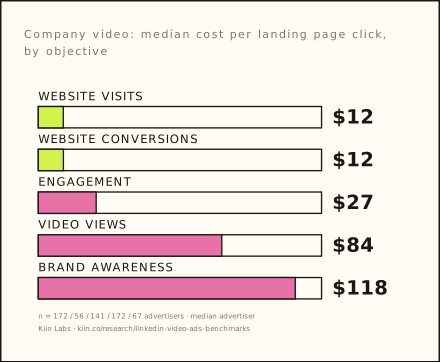
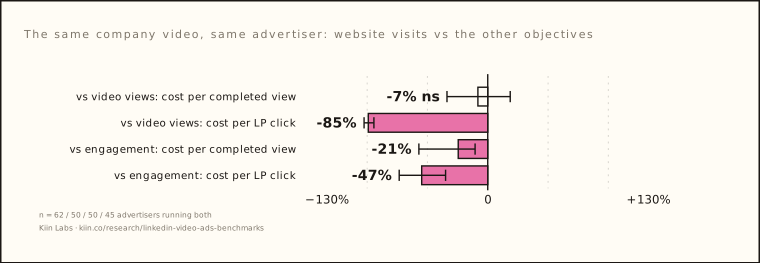
Two more objective results for the same company video. Website conversions adds nothing over website visits: no metric differs (18 advertisers, all not significant), so run video on website visits. Engagement against video views buys the same cost per completed view (+13%, ns) with 4.5x the engagement rate and 77% cheaper landing page clicks (44 to 57 advertisers): if reactions are worth anything to you, engagement gets them on top of the watch-through.
Who to show it to
| Audience, same advertiser | Objective | Result | Advertisers |
|---|---|---|---|
| Retargeting vs cold | Video views | View rate +13% ✱ · engagement +43% ✱ · cost per completed view −13% ns | 26 |
| Retargeting vs cold | Website visits | LP click-through +27% ✱ · cost per LP click −13% ns | 14 |
| Uploaded list vs cold | Video views | Nothing moves (view rate +3%, cost per view +5%, both ns) | 44 |
| Uploaded list vs cold | Engagement | Engagement −19% ✱ · cost per engagement +47% ✱ · CPM +20% ✱ | 39 |
Uploaded lists behave like a cold audience at a higher price. Video to a warm pool gets watched and clicked more.
How to bid
| Bid, same advertiser, video views objective | Result | Advertisers |
|---|---|---|
| Auto 'maximise video views' vs manual cost per view | CPM −17% [−30, −9] ✱ · cost per view −9% ns · cost per completed view −26% ns | 26 |
| Highest vs lowest manual bid (+150%) | Cost per view +90% [+47, +122] ✱ · view rate +4% ✱ | 73 (Sep 2026 study) |
| Max delivery vs manual, engagement objective | Cost per engagement +22% ns | 19 |
The bid-amount result is from Kiin's September 2026 video views study on the previous archive snapshot; the auto-bid result reproduces here. Bidding higher buys the same views at nearly double the price.
A video that has to drive traffic runs on website visits: the same watch-through as video views, a fraction of the cost per click. Video views is for a video whose only job is being watched, with LinkedIn setting the bid. Brand awareness never carries a video.
Thought leader video
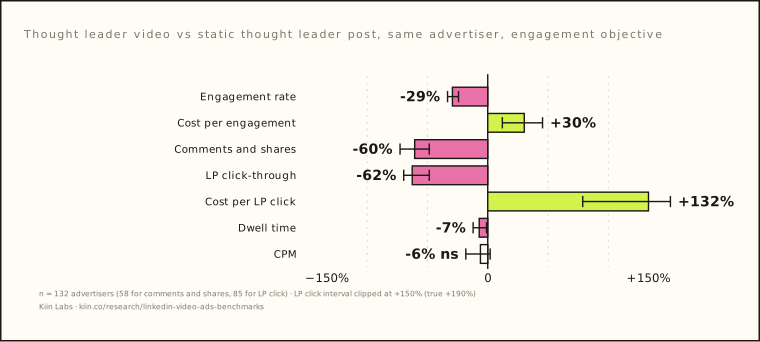
Thought leader video loses to static thought leader posts on everything except price per impression. It only wins against company video, and only on engagement.
| Thought leader video vs … | Objective | Result | Advertisers |
|---|---|---|---|
| Static thought leader post | Brand awareness | Engagement −33% ✱ · cost per engagement +41% ✱ · LP click-through −82% ✱ · dwell −16% ✱ | 36 |
| Company video | Engagement | Engagement +17% ✱ · cost per engagement −20% ns · dwell +7% ✱ | 57 |
| Company video | Brand awareness | Engagement +110% ✱ · cost per engagement −49% ✱ | 25 |
| Company video | Video views | Engagement +113% ✱ but cost per completed view +51% ✱ · completion −34% ✱ | 18 |
| Single image | Engagement | Cost per LP click +147% ✱ · engagement +0% ns · dwell +14% ✱ | 91 |
| Itself on brand awareness vs engagement | — | Engagement −52% ✱ · cost per engagement +96% ✱ · CPM −20% ✱ | 22 |
| Itself on video views vs engagement | — | Cost per completed view −21% ✱ · completion +51% ✱ · engagement −69% ✱ | 13 |
Same direction as Report No. 1 (video thought leader ads $32 per landing page click, 2.4x a static one). A person's face helps a video against a company logo; it does not help a video against the same person's static post.
Thought leaders post static. If a thought leader video exists and the goal is being watched, it runs on video views with LinkedIn bidding, as Report No. 1 says; it never runs on brand awareness and it is never judged on clicks.
What people actually watch: retention, length, shape, copy
Of every 100 times a company video starts playing, 37 become a two-second view, 7 reach a quarter, 3 reach halfway and 1 or 2 reach the end. The first six seconds are the ad.
| Watch time, median advertiser | Seconds per view | Cost per minute watched | Advertisers |
|---|---|---|---|
| Company video · video views | 8.0 | $0.96 | 106 |
| Company video · website visits | 6.7 | $0.93 | 80 |
| Company video · engagement | 7.9 | $0.96 | 66 |
| Company video · brand awareness | 6.9 | $1.28 | 45 |
| Thought leader video · engagement | 7.9 | $1.13 | 104 |
| Thought leader video · brand awareness | 7.4 | $1.88 | 30 |
Advertisers with 500+ views and reported watch time. Website visits is the cheapest way to buy a minute of company-video attention ($0.93); brand awareness and website conversions are the dearest ($1.28 to $1.88).
Length
The median advertiser video is 40 seconds long (p25 25 s, p75 66 s, 1,702 company videos with length from the LinkedIn API). Length does not change what LinkedIn charges or how many people stop: CPM +4%, view rate −1%, cost per view +3%, all not significant, longer vs shorter half of each advertiser's videos. It changes how many get through: completion −55% ✱, cost per completed view +138% ✱.
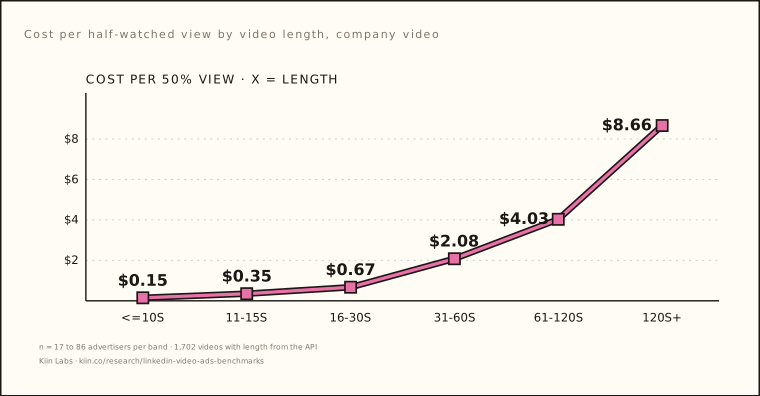
Long videos do earn something back. Over 60 seconds against 30 seconds or less, same advertiser: click-through +60% [+0%, +115%] and engagement +81% ✱ (40 advertisers). People who stay through a long video act on it more often; there are just far fewer of them, and landing page click-through does not move (+6%, ns).
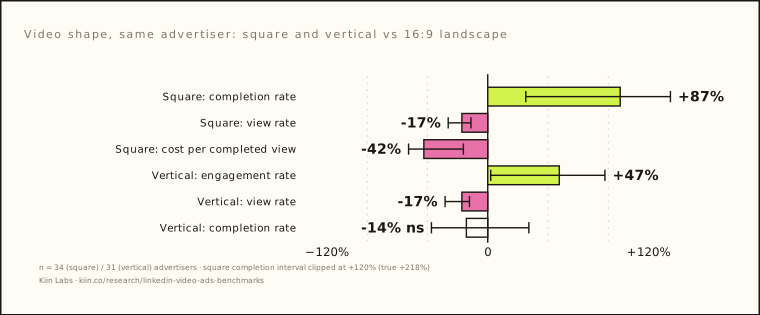
Completion does not predict clicks
Inside a single campaign, comparing its videos with each other, a video's completion rate and its landing page click-through are unrelated (median correlation 0.02, 398 campaigns); view rate is weakly related (0.20). Engagement tracks click-through closely (0.80), but LinkedIn counts clicks inside engagements, so part of that is built in. A video that people finish is not a video that sends people to the site. Lead gen is the exception: there, the share of viewers who reach halfway does track form opens (0.40, 41 campaigns) and leads (0.26, 28 campaigns). If a video has to carry a form, retention is the lever.
Post copy barely matters
Within the same campaign, copy features move video results by 0 to 12%: an emoji costs 12% of landing page click-through ✱, a number adds 7% to engagement ✱ (and costs 6% of completions), a link in the copy adds 10% to click-through ✱. Questions and "you" do nothing. Longer copy hurts: the longer half of each advertiser's video posts gets 17% fewer clicks ✱ (117 advertisers); most video ads carry almost no copy at all (median 0 characters). What the video is about does not matter either: across 4,641 video creatives, customer proof, product, how-to, data and opinion themes all moved engagement and clicks by under 7%, none significant. The video is the ad; the copy is a caption.
Make it 15 seconds, square, and put the message in the first six seconds, because that is all most people see. A long video is fine when the audience is warm and the goal is a click, but it should never be the default.
Video and lead forms
Lead gen forms on video complete at a median 1.7%. People open the form as often as on an image; they don't finish it.
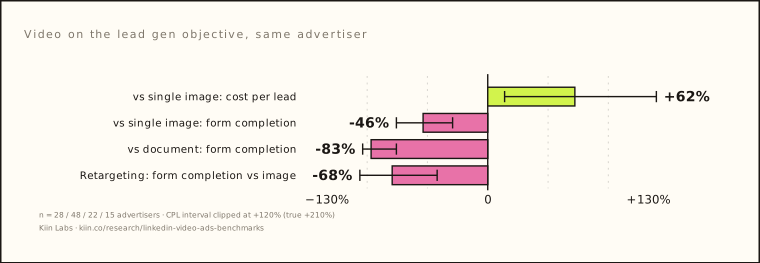
People do respond to a lead gen video; they just don't finish the form. Against a single image on lead gen: engagement rate +28% ✱, comments and shares +53% ✱, cost per engagement −16% ✱, form opens −4% (ns), form completion −46% ✱.
Company video on lead gen: median cost per lead $181 (p25 $56, p75 $663, 36 advertisers), form completion 1.7%, CPM $69, the highest of any video objective. Against website visits for the same video, lead gen pays 82% more per thousand impressions and 169% more per completed view.
Reconciliation with Report No. 4. The demo report shows video demo forms at $291 per demo lead across accounts (15 advertisers), cheaper than single image at $640. That is a cross-account median: the few advertisers who run demo forms on video are not the same as those who run them on images. Inside the same account, video lead gen costs 62% more per lead here and 63% more per demo lead there (not significant, 5 advertisers). Cite the paired figures.
A lead form belongs on a document for a content offer, a message ad for a demo, and a single image for anything else. Video can put people into the pool those forms are sent to; it should not carry the form itself.
The halo test: does video make the rest of the account cheaper?
The case for video is often that it warms the market so everything else converts better. In this data it doesn't, at least not within a month or two.
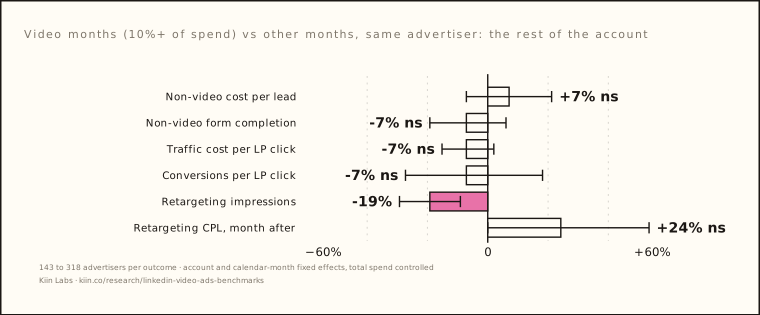
| Outcome, non-video campaigns | Same month | Month after | Month before (placebo) |
|---|---|---|---|
| Cost per lead (lead gen) | +7% [−7, +21] | +2% [−11, +17] | +2% [−9, +15] |
| Form completion | −7% [−19, +6] | +1% [−13, +18] | −3% [−12, +8] |
| Cost per landing page click | −7% [−15, +2] | +5% [−5, +15] | +1% [−7, +10] |
| Landing page click-through | −8% [−18, +3] | −2% [−12, +9] | +0% [−10, +11] |
| Conversions per landing page click | −7% [−27, +18] | +4% [−20, +34] | −10% [−27, +10] |
| Retargeting impressions | −19% [−29, −9] ✱ | +1% [−11, +15] | −0% [−12, +13] |
| Retargeting cost per lead | +7% [−17, +38] | +24% [+0, +53] | −5% [−28, +25] |
The placebo column uses next month's video to 'predict' this month's results; it should show nothing, and it doesn't, so the method is not inventing effects. The one real change: in video months the rest of the account runs fewer retargeting impressions, because budget moved into video. Retargeting cost per lead the month after video is +24% on 59 advertisers, borderline and the wrong direction for a halo.
What this test can and cannot see: it compares months with and without heavy video inside the same advertiser, so a slow brand effect over a year, or an effect on deals outside LinkedIn, is invisible to it. There is no geographic or list hold-out. What it rules out is the common claim that adding video makes next month's lead gen or traffic visibly cheaper.
Buy video for what it does on its own line: attention and pool members. Don't justify it with a capture saving next month; there isn't one to point to.
Video as a pool builder, and what the pool is worth
A 50% view is one of the cheapest actions that puts someone into a retargeting audience. The pool it builds converts in the inbox and is weak in the feed.
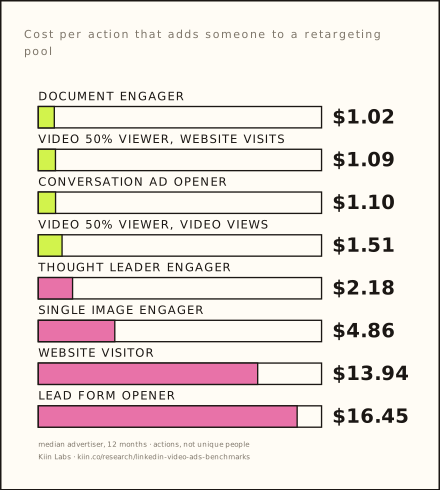
| Same advertiser: a 50% video view vs … | Difference in cost per pool action | Advertisers |
|---|---|---|
| Single image engagement | −62% [−67, −58] ✱ | 426 |
| Website visit (landing page click) | −88% [−90, −87] ✱ | 371 |
| Static thought leader engagement | +11% [−26, +44] ns | 218 |
| Document engagement | +82% [+47, +126] ✱ | 206 |
| Conversation ad open | +106% [+69, +138] ✱ | 188 |
How big the pools get, and how they perform
Median video-viewer audience: 25% viewers 20,700 people, 50% viewers 13,350, 75% viewers 7,255 (318 to 398 campaigns). Retargeted in the feed on their own, video-viewer pools cost $33 per landing page click against $14 for website-visitor pools (42 and 75 advertisers, across accounts). In message and conversation ads they hold up.
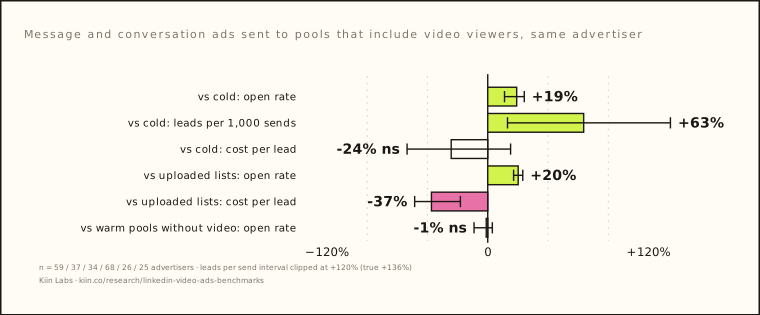
The video job we buy on purpose: a 15-second square video on website visits, which gets the cheapest 50% views and some clicks. Its 50%+ viewers join document engagers and website visitors in one warm pool, and the demo ask goes to that pool by message ad. Never retarget video viewers with a feed lead form.
Benchmarks: video by objective, market and audience size
What a median advertiser pays for company and thought leader video on each objective, with the spread. Use the objective your campaign is on; the numbers differ by up to 10x.
| Company video (advertisers) | CPM | Cost per view | Cost per completed view | LP CTR | Cost per LP click | Engagement rate |
|---|---|---|---|---|---|---|
| Video views (221) | $38 ($18–71) | $0.11 | $2.59 | 0.04% | $84 | 0.49% |
| Website visits (175) | $41 ($24–63) | $0.10 | $2.49 | 0.33% | $11.50 | 1.0% |
| Engagement (181) | $51 ($32–94) | $0.12 | $3.29 | 0.16% | $27 | 2.2% |
| Brand awareness (111) | $44 ($23–70) | $0.13 | $4.29 | 0.03% | $118 | 0.52% |
| Website conversions (56) | $55 ($23–116) | $0.14 | $2.92 | 0.34% | $11.54 | 1.0% |
| Lead gen (87) | $69 ($33–122) | $0.18 | $4.54 | — | — | 1.9% · CPL $181 · completion 1.7% |
Median advertiser with 5,000+ impressions on the objective; CPM interquartile range in brackets. Cost per view is per LinkedIn two-second view.
| Thought leader video (advertisers) | CPM | Cost per view | Cost per completed view | LP CTR | Cost per LP click | Engagement rate | Cost per engagement |
|---|---|---|---|---|---|---|---|
| Engagement (167) | $67 | $0.14 | $4.47 | 0.10% | $46 | 3.4% | $2.27 |
| Brand awareness (61) | $40 | $0.10 | $4.13 | 0.02% | $69 | 1.7% | $2.91 |
| Video views (37) | $66 | $0.15 | $5.84 | 0.04% | $102 | 1.4% | $5.15 |
| Website visits video, by targeted market | CPM | Cost per LP click | Advertisers |
|---|---|---|---|
| Benelux | $27 | $5.54 | 13 |
| Nordics | $31 | $10.78 | 18 |
| Europe, multi-country | $44 | $11.76 | 10 |
| UK | $49 | $13.07 | 10 |
| US | $57 | $14.83 | 47 |
| DACH | $38 | $16.05 | 12 |
| US and Canada | $71 | $21.22 | 24 |
All video on the website visits objective, median advertiser. Audience size barely moves it: $9.35 per click at 300,000+, $10.38 to $12.55 below that.
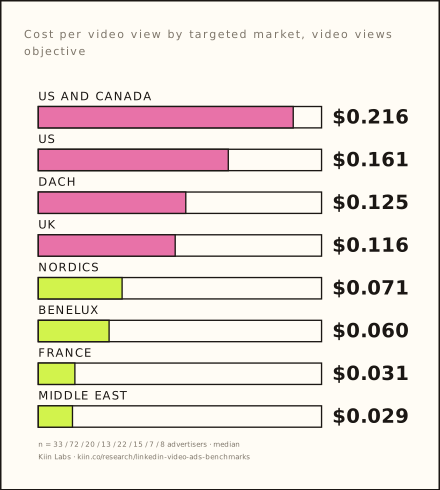
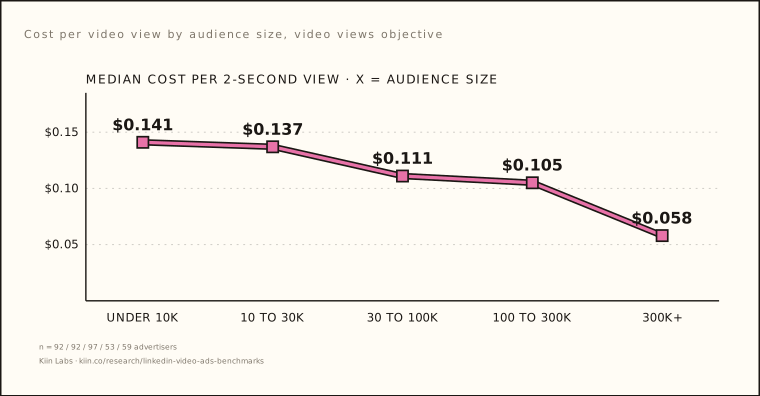
A North American video view costs five to seven times a Benelux or French one, and a 300,000+ audience halves the price of a view against anything under 100,000. Benchmark against your own market and objective, never against a blended 'video CPV'.
Ten numbers to quote, with what they rest on
Each one a full sentence, free to cite with a link. The base line says what it rests on: advertisers, whether it is paired, and whether it is significant.
On LinkedIn, the same advertiser pays 18% more per landing page click with a video than with a single image on the website visits objective.
So: video traffic costs more per click than an image.
LinkedIn video holds people 42% longer than a brand awareness image at the same CPM.
So: video buys attention.
Run on website visits instead of video views, the same LinkedIn video costs the same per completed view and 85% less per landing page click.
So: a video that needs clicks runs on website visits.
Thought leader video gets 29% less engagement and costs 30% more per engagement than a static thought leader post from the same advertiser.
So: thought leaders post static.
A LinkedIn lead form on a video completes at a median 1.7%; against a single image in the same account, cost per lead is 62% higher.
So: don't put a lead form on a video.
Months with heavy LinkedIn video spend do not make the rest of the account cheaper: non-video cost per lead +7%, not significant.
So: budget video on its own line.
A 50% video view on LinkedIn costs $1.09 on the website visits objective, against $13.94 per website visitor.
So: video fills retargeting pools cheaply.
Of every 100 LinkedIn video starts, 37 become a two-second view, 3 reach halfway and 1.4 reach the end.
So: the first six seconds are the ad.
LinkedIn videos of 15 seconds or less cost 54% less per completed view than videos of 16 to 30 seconds from the same advertiser.
So: make it short.
63% of the conversions LinkedIn credits to video are view-through, against 43% for single image.
So: video conversion reports flatter video.
Video myths, with the verdict
| Myth | Verdict | What the data says |
|---|---|---|
| Video is the best-performing format on LinkedIn | Half true | Best for dwell and cheap pool members; dearer than an image on every action metric. Ch. 01. |
| Video views is the right objective for video | Only if watching is the goal | Website visits gets the same cost per completed view and 85% cheaper clicks. Ch. 02. |
| Video thought leader ads beat image ones | False | Engagement −29%, cost per engagement +30%, cost per click +132% vs static, same advertiser. Ch. 03. |
| Video warms the market so capture gets cheaper | Not visible | Non-video cost per lead +7%, cost per click −7%, both ns; placebo-checked. Ch. 06. |
| Longer videos tell the story better | For the few who stay | Completion −55% for the longer half; click-through and engagement rise only among those who stay. Ch. 04. |
| A high completion rate means a good video | Not for clicks | Completion and click-through are unrelated inside a campaign (0.02). Ch. 04. |
| Lead gen forms work on video | False | 1.7% completion; −46% vs image, −83% vs document. Ch. 05. |
| Video is a better carrier than a document | For clicks only | Documents get 5x the engagement; video gets 6x the click-through on the engagement objective. Ch. 01. |
| Video viewers are your warmest audience | As warm as any pool | In the inbox they match other warm pools; in the feed they cost $33 per click vs $14 for site visitors. Ch. 07. |
Terms used in this report
| Term | Meaning |
|---|---|
| View | LinkedIn's video view: two seconds or more with at least half the player on screen. |
| Completed view | LinkedIn's completion count; cost per completed view = spend ÷ completions. |
| 50% view | A view that reached the video's midpoint; the action LinkedIn uses for a 50% viewer retargeting audience. |
| LP click / LP CTR | Landing page clicks: clicks that go to the advertiser's site. Not all clicks. |
| Dwell | LinkedIn's average dwell time on the ad, seconds per impression. |
| Paired within account | The same advertiser running both settings on the same objective; the median of each advertiser's own ratio, with a 95% bootstrap interval. |
| ★ / ✱ / ns | ★ 5+ paired advertisers, ★★ 25+, ★★★ 100+. ✱ the 95% interval excludes zero. ns: it does not. |
Method, robustness, what we can't answer
Method
Data. Kiin research archive (de-identified), LinkedIn Marketing API, 12 months 7 Oct 2025 to 6 Oct 2026, campaign-month grain, every currency converted to USD at the archive's fixed rates. LinkedIn Audience Network excluded. Panel: $64.8M, 1,096 advertisers. Video: $10.2M, 676 advertisers, 4,409 campaigns. Comparisons use campaigns with 2,000+ impressions and $50+ of spend: 3,764 video campaigns, 642 advertisers, inside an 18,216-campaign table.
Classification. Video = LinkedIn's single video format. Thought leader video = a video campaign whose creatives are thought leader ads. Retargeting, list and cold from the campaign's targeting. Length and shape from the LinkedIn API for 6,656 video creatives (1,702 with a duration).
Benchmarks are medians across advertisers with 5,000+ impressions on the cell. Paired comparisons take advertisers running both settings on the same objective with 5,000+ impressions each, compute the ratio per advertiser, and report the median with a 2,000-draw bootstrap interval. The halo test regresses each non-video outcome on a video-month indicator (10%+ of spend) with advertiser and calendar-month fixed effects, log total spend, a lag and a lead (placebo), clustered by advertiser.
Robustness. Every analysis was re-run from the archive; the main tables reproduce exactly. The core paired results were re-tested with independent code, a 10,000-impression floor per side, stricter metric floors and a sign test, and again without the ten biggest video advertisers: all hold. Length, shape, creative-level correlations, copy and pool costs come from API pulls that were not repeated; they are reported from the original run.
No advertiser, campaign, creative or person is identifiable in any table.
What we cannot answer
Whether video influences deals. Nothing after the click or form is in the data. A brand effect on pipeline needs a CRM join and a hold-out, which this panel does not have. The halo test sees one to two months, inside LinkedIn.
Thought leader video length and shape. A person's post cannot be read with advertiser access, so length and shape are company video only.
What the video says. Script, hook, captions and who is on screen are not in the data.
Lead quality on video forms. Demo and content forms are not separated here; Report No. 4 has the demo-only view.
Video-viewer pools by name. Pool sources are read from audience names; most pools mix sources.
Ilic, P. (2026). Video on LinkedIn Ads: 2026 benchmarks. Kiin Labs. kiin.co/research/linkedin-video-ads-benchmarks. Figures are medians across advertiser accounts and paired within-account comparisons, USD, 7 Oct 2025 to 6 Oct 2026, LinkedIn Audience Network excluded. Free to cite with a link.
Frequently asked questions about LinkedIn video ads
How much does a LinkedIn video view cost?
On the video views objective the median advertiser pays $0.11 per two-second view for company video and $0.15 for thought leader video, with a $38 and $66 CPM. A completed view costs $2.59 and $5.84. By market: US $0.16, UK $0.12, DACH $0.13, Nordics $0.07. Audiences over 300,000 pay $0.06.
Are LinkedIn video ads worth it?
For attention and retargeting pools, yes: video holds people 42% longer than an image and a 50% view costs about $1.09. For clicks, leads and demos, no: the same advertiser pays 18% more per landing page click on website visits, 53% more on engagement and 62% more per lead than with a single image.
Which objective should I use for a LinkedIn video ad?
Website visits if the video needs to drive traffic: it gets the same cost per completed view as video views and 85% cheaper landing page clicks. Video views if being watched is the only goal, with LinkedIn's automatic bidding. Never brand awareness for a video that needs clicks: cost per click is 4.6x an image.
How long should a LinkedIn video ad be?
15 seconds or less. Videos of 15 seconds or less cost 54% less per completed view than 16 to 30 seconds from the same advertiser, and only 7% of starts reach a quarter of the way through. The median advertiser video is 40 seconds. Length does not change the CPM or the share of people who stop for two seconds.
Do video thought leader ads work?
Not as well as static ones. Against static thought leader posts from the same advertiser, video gets 29% less engagement, costs 30% more per engagement and 132% more per landing page click. It beats company video on engagement (+17%).
Should I use LinkedIn lead gen forms on video?
No. Lead forms on video complete at a median 1.7%; against a single image the cost per lead is 62% higher and completion 46% lower, and against a document completion is 83% lower. Put content offers on documents and demo asks in message ads.
Does LinkedIn video make my other campaigns cheaper?
Not that we can see. Comparing months with video at 10%+ of spend against months without, in the same advertiser, non-video cost per lead was +7%, cost per landing page click −7% and conversions per click −7%, none significant, with a placebo test showing the same.
Is it worth retargeting LinkedIn video viewers?
In message and conversation ads, yes: pools that include video viewers open 19% more than cold audiences and cost 37% less per lead than uploaded lists, about the same as other warm pools. In the feed on their own, video-viewer pools cost $33 per landing page click against $14 for website visitors.
What is your video budget buying? Kiin runs LinkedIn Ads for sales-led B2B companies and benchmarks every account against the 1,000+ connected to Kiin Intelligence: cost per completed view, cost per click by objective, pool-building cost and what the pool converts at, on every table in this report.