
Selling to businesses that now research and buy online? I’ll benchmark your Google, Meta and LinkedIn ads against our $65M+ panel in a free 30-minute call. Book my free benchmark with Phil →
Ilic, P. (2026). Ecommerce Statistics 2026: Sales, Mobile, Cart Abandonment and B2B. Kiin Labs (incorporating The B2B House). https://kiin.co/research/ecommerce-statistics
- The key ecommerce statistics for 2026
- How big is global ecommerce?
- How much do Americans spend online?
- What share of UK and European shopping is online?
- How much ecommerce happens on mobile?
- What is the average cart abandonment rate?
- How much do social media and AI drive online sales?
- Who are the biggest ecommerce companies?
- How big is B2B ecommerce?
- Do reviews, language and personalisation change sales?
- How profitable is ecommerce?
- What B2B buying online means for marketers
- Figures previously published by The B2B House
Also: stats we no longer use · FAQ · every source
What are the key ecommerce statistics for 2026?
If you only need one table, this is it. Every figure here was checked on the page or document it comes from on 14 November 2026. The sections below give the detail, the trend and the caveats.
| Statistic | Figure | As of | Source |
|---|---|---|---|
| US retail ecommerce sales, seasonally adjusted | $340.2 billion | Apr to Jun 2026 | US Census Bureau |
| Ecommerce share of US retail sales | 17.1% | Apr to Jun 2026 | US Census Bureau |
| Growth in US online retail sales, one year | +12.2% (all retail +6.7%) | Q2 2025 to Q2 2026 | US Census Bureau |
| Share of Great Britain retail sales made online | 28.8% | Sep 2026 | ONS |
| EU internet users (16 to 74) who bought online in the last year | 78% | 2025 | Eurostat |
| China: online retail sales of goods | 9.51 trillion yuan (+3.8%) | Jan to Sep 2026 | National Bureau of Statistics of China |
| Global ecommerce sales, B2B and B2C, 43 economies | almost $27 trillion | 2022 estimate | UNCTAD |
| US B2B ecommerce (manufacturing shipments + wholesale sales) | $8.59 trillion | 2022 | US Census Bureau E-Stats |
| Share of US holiday online spending on smartphones | 56.4% | Nov to Dec 2025 | Adobe |
| Average documented cart abandonment rate | 70.22% | 50 studies, updated Oct 2026 | Baymard Institute |
| Top reason for abandoning checkout | Extra costs too high, 40% | 2025 survey | Baymard Institute |
| Social media share of US holiday online revenue | 4.6% (+40.3% YoY) | Nov to Dec 2025 | Adobe |
| Growth in traffic to US retail sites from generative AI tools | +693.4% | Nov to Dec 2025 | Adobe |
| Amazon net sales, full year | $716.9 billion (+12%) | 2025 | Amazon |
| Amazon Business annualised gross sales | $60 billion+ | Q2 2026 | Amazon |
| B2B buyers who prefer a rep-free buying experience | 67% | Survey Aug to Sep 2025 | Gartner, via Digital Commerce 360 |
| Median cost per demo request lead on LinkedIn | $350 | 2026 | Kiin Labs Report No. 4 |
How big is global ecommerce?
The best official estimate of all online sales, business and consumer together, is almost $27 trillion in 2022. That comes from UNCTAD, the UN's trade and development body, which adds up national statistics from 43 developed and developing economies. It says businesses in those economies sold close to $25 trillion online in 2021 and that sales rose about 10% in 2022 (UNCTAD, June 2024). It also makes the point that matters most for this page: in almost every country it measures, most ecommerce sales are made to other businesses, and the consumer share is usually under a quarter.
UNCTAD's previous global estimate split the total. In 2019, worldwide ecommerce was $26.7 trillion, of which $21.8 trillion, or 82%, was B2B and $4.9 trillion was business-to-consumer (UNCTAD, May 2021). That $4.9 trillion is worth remembering, because it is the same number The B2B House quoted as "global ecommerce sales in 2021". The research-firm figure and the UN figure happen to match, but they describe consumer retail only, not ecommerce as a whole. More on that below.
There is no official, current, worldwide figure for online retail alone. Numbers such as "$6.4 trillion in 2024" or "$7 trillion in 2025" are forecasts from private research firms, built on models rather than counted sales. They are fine as a sense of scale. They are not measurements, and different firms' versions disagree by a trillion dollars or more. For measured figures you have to go country by country, which is what the next sections do.
| Global ecommerce measure | Figure | Year | Source |
|---|---|---|---|
| Ecommerce sales by businesses, 43 economies | almost $27 trillion | 2022 (estimate) | UNCTAD 2024 |
| Same, one year earlier | close to $25 trillion | 2021 | UNCTAD 2024 |
| Growth in transactions on 37 major online platforms during the pandemic | more than 55% | 2019 to 2021 | UNCTAD 2024 |
| Global ecommerce, all | $26.7 trillion | 2019 | UNCTAD 2021 |
| Global B2B ecommerce | $21.8 trillion (82%) | 2019 | UNCTAD 2021 |
| Global B2C ecommerce | $4.9 trillion (+11% on 2018) | 2019 | UNCTAD 2021 |
| Online shoppers buying cross-border | 25% (20% in 2017) | 2019 | UNCTAD 2021 |
| China: online retail sales of goods | 9,506.0 billion yuan (+3.8%) | Jan to Sep 2026 | NBS China |
| China: online sales of goods as share of retail sales of consumer goods | about 25.7% (our calculation) | Jan to Sep 2026 | NBS China (9,506.0 ÷ 37,000.1 billion yuan) |
| China: online retail sales of goods and services | 15,147.1 billion yuan (+4.4%) | Jan to Sep 2026 | NBS China |
Sources: UNCTAD Technical Note on ICT for Development No. 1 (13 June 2024); UNCTAD press release (3 May 2021); National Bureau of Statistics of China (20 October 2026). NBS renamed its "online retail sales of physical goods" indicator to "online retail sales of goods" in 2026 with the same coverage.
China is still the largest single online retail market, but its growth has slowed to low single digits. China's statistics bureau reported online sales of goods of 9.5 trillion yuan in the first nine months of 2026, up 3.8%, against total retail sales of 37.0 trillion yuan up 1.1% (NBS, 20 October 2026). That makes online roughly a quarter of China's retail sales of goods, a share that has been flat for two years. The B2B House's "China accounted for 52.1% of global ecommerce sales" and "livestreaming generated $363 billion" came from research-firm estimates for 2021; we have not found a current official equivalent.
Cite: "Ecommerce sales by businesses across 43 economies reached almost $27 trillion in 2022; in 2019, 82% of global ecommerce was B2B (UNCTAD)." Kiin Labs, kiin.co/research/ecommerce-statistics#global
How much do Americans spend online?
US retail ecommerce sales were $340.2 billion in the second quarter of 2026, 17.1% of total retail sales. That is the US Census Bureau's seasonally adjusted estimate, released on 18 August 2026. Online sales rose 3.8% on the first quarter and 12.2% on a year earlier, while total retail sales rose 6.7% over the same twelve months (US Census Bureau, Quarterly Retail E-Commerce Sales, 2nd Quarter 2026). Before seasonal adjustment the quarter's online sales were $329.5 billion, 16.4% of the total. The Census Bureau publishes the third-quarter 2026 estimate on 19 November 2026; if you are reading this after that date, check the link for the newer figure.
Add the last four quarters together and Americans bought about $1.3 trillion of goods online in the year to June 2026 (our sum of the seasonally adjusted quarters in the table below). The Census definition is broad: it includes orders placed through a website, an app, email or EDI, and it counts the sale even if payment happens offline. It only covers businesses with paid employees, which is why the series was revised down slightly in April 2025, when the bureau stopped including sole traders.
| Quarter | US retail ecommerce (seasonally adjusted) | Share of all retail | Change vs same quarter a year earlier |
|---|---|---|---|
| Q2 2026 (preliminary) | $340.2 billion | 17.1% | +12.2% |
| Q1 2026 (revised) | $327.9 billion | 17.0% | +10.1% |
| Q4 2025 | $318.0 billion | 16.7% | +5.9% |
| Q3 2025 | $310.8 billion | 16.4% | +5.3% |
| Q2 2025 (revised) | $303.3 billion | 16.3% | +5.0% |
| Q4 2025, not seasonally adjusted (holiday quarter) | $365.2 billion | 18.3% | +5.6% |
Source: US Census Bureau, Quarterly Retail E-Commerce Sales, 2nd Quarter 2026 (CB26-133), Table 1, released 18 August 2026. Estimates are adjusted for seasonal variation but not for price changes.
Two things stand out. First, US online growth sped up sharply in 2026, from around 5% a year through 2025 to 10% and then 12% in the first two quarters of 2026, roughly double the growth of retail overall. Second, the share is still well under a fifth. People often assume online is "most" of US retail. It is not. Even in the holiday quarter, when it peaks, it was 18.3% of retail sales in late 2025. Most of what Americans buy, by value, is still bought in a shop, a car dealership or a petrol station.
The holiday season is where the biggest single days happen. Adobe, which measures transactions on a large share of the top US retail sites, counted $257.8 billion of US online spending between 1 November and 31 December 2025, up 6.8%. Cyber Monday was the biggest day of the year at $14.25 billion, up 7.1%, and Cyber Week as a whole brought in $44.2 billion (Adobe, 7 January 2026; Adobe, December 2025).
| US holiday ecommerce, 2025 season | Figure | Change vs 2024 | Source |
|---|---|---|---|
| Online spend, 1 Nov to 31 Dec | $257.8 billion | +6.8% | Adobe |
| Cyber Week | $44.2 billion | +7.7% | Adobe |
| Cyber Monday | $14.25 billion | +7.1% | Adobe |
| Black Friday | $11.8 billion | +9.1% | Adobe |
| Buy Now Pay Later spend in the season | $20 billion | +9.8% | Adobe |
Source: Adobe Analytics data on US online retail spending, published 2 December 2025 and 7 January 2026. Adobe's totals are not comparable with Census figures: they cover the sites Adobe measures, not the whole market.
Cite: "US retail ecommerce sales were $340.2 billion in Q2 2026, 17.1% of all retail sales and up 12.2% year on year (US Census Bureau)." Kiin Labs, kiin.co/research/ecommerce-statistics#us-sales
What share of UK and European shopping is online?
In September 2026, 28.8% of retail sales in Great Britain were made online, down slightly from 28.9% in August. That is from the Office for National Statistics' monthly retail sales bulletin, published 23 October 2026 (ONS). The ONS figure is a share of the value of retail sales, the closest UK equivalent to the US Census share, and it is much higher: on these official measures, Britons buy close to 29% of their retail goods online against 17% for Americans. The UK is one of the most online retail markets in the world, helped by dense populations, short delivery distances and grocers that moved online early.
For business sales, the most recent ONS figures are older. UK non-financial businesses sold £459.2 billion through websites in 2021, up £102.8 billion or 28.8% on 2019, and businesses with 1,000 or more employees made 59.4% of those website sales (ONS Digital Economy Survey 2021, published April 2023). The ONS dropped EDI sales from that headline because of uncertainty in the estimates. The last bulletin that included them put UK businesses' total ecommerce sales at £668.9 billion in 2019, split almost evenly between EDI (£334.0 billion) and websites (£334.9 billion) (ONS, February 2021). Half of UK business ecommerce, in other words, ran over the machine-to-machine ordering links that never appear in a consumer statistic.
Across the EU, 78% of internet users aged 16 to 74 bought something online in 2025, up from 62% in 2015, according to Eurostat's household survey. The highest rate was among 25 to 34 year olds, at 90%. Ireland (87%) and the Netherlands (86%) had the highest shares of people who had bought online in the previous three months, and Romania (+46 points), Cyprus and Czechia saw the biggest rises over the decade (Eurostat, data extracted February 2026).
| UK and EU statistic | Figure | As of | Source |
|---|---|---|---|
| Online share of GB retail sales | 28.8% | Sep 2026 | ONS |
| Online share of GB retail sales, previous month | 28.9% | Aug 2026 | ONS |
| UK business website sales | £459.2 billion | 2021 | ONS |
| Share of UK website sales made by 1,000+ employee businesses | 59.4% | 2021 | ONS |
| UK business ecommerce sales incl. EDI (10+ employees) | £668.9 billion | 2019 | ONS |
| EU internet users who bought online in past 12 months | 78% (62% in 2015) | 2025 | Eurostat |
| EU internet users aged 25 to 34 who bought online | 90% | 2025 | Eurostat |
| Highest share buying online in last 3 months | Ireland 87%, Netherlands 86% | 2025 | Eurostat |
Sources: ONS retail sales bulletin (23 October 2026), ONS Digital Economy Survey 2021 (20 April 2023), ONS E-commerce and ICT activity 2019 (5 February 2021), Eurostat Statistics Explained "E-commerce statistics for individuals" (data extracted February 2026).
Cite: "28.8% of retail sales in Great Britain were made online in September 2026 (ONS); 78% of EU internet users bought online in 2025 (Eurostat)." Kiin Labs, kiin.co/research/ecommerce-statistics#uk-europe
How much ecommerce happens on mobile?
More than half of US online spending now happens on a smartphone: 56.4% of holiday-season online transactions in 2025, up from 54.5% in 2024 (Adobe, January 2026). Mobile's share is highest on days when people are not at a desk. On Christmas Day 2025 it was 66.5% and on Thanksgiving 61.6%, the first time Thanksgiving passed 60%. On Cyber Monday, a working day, it was 57.5% (Adobe, December 2025).
That is the most reliable current measurement of mobile's share of US ecommerce, and it is lower than the forecasts that circulated a few years ago. The B2B House quoted a projection that "mobile commerce is projected to account for 72.9% of total ecommerce sales by 2023". That forecast, which came from a research firm and was widely shared, did not come true in the US: the measured share in the 2025 holiday season was 56.4%. More on that below. The US Census Bureau does not split ecommerce by device, so there is no official mobile figure.
| Mobile share of US online spending | Share | Period | Source |
|---|---|---|---|
| Holiday season (1 Nov to 31 Dec) | 56.4% | 2025 | Adobe |
| Holiday season, previous year | 54.5% | 2024 | Adobe |
| Christmas Day | 66.5% | 2025 | Adobe holiday release |
| Thanksgiving Day | 61.6% | 2025 | Adobe holiday release |
| Cyber Monday | 57.5% | 2025 | Adobe |
Source: Adobe Analytics, US online retail, 2025 holiday season. "Mobile" means smartphones; tablets are counted with desktop.
Speed still matters most on mobile, but the famous "53%" figure is from 2016. Google's research team found in 2016 that 53% of mobile site visits were abandoned if a page took longer than three seconds to load, from a study of more than 10,000 mobile web domains (Think with Google). It is a real finding with a real source, but it was measured on 3G and 4G connections a decade ago. Google has not republished it with new data. Use it as "Google found in 2016", not as a 2026 fact. The general point, that slow mobile pages lose buyers, is supported by every newer study we have seen.
Mobile also changes what happens after the sale. Adobe found that only 38.8% of holiday returns were started on a mobile device, well below mobile's share of purchases, which suggests people buy on a phone and handle the admin on a computer (Adobe, 2025 holiday release). B2B buying shows the same pattern in reverse: buyers discover and research on phones, then complete large orders on desktop, often inside procurement systems. In the Kiin panel the large majority of LinkedIn ad impressions are served on mobile, so B2B ad creative has to work on a phone screen first even when the purchase happens at a desk.
Cite: "56.4% of US holiday online spending in 2025 happened on smartphones, up from 54.5% in 2024 (Adobe)." Kiin Labs, kiin.co/research/ecommerce-statistics#mobile
What is the average cart abandonment rate?
The average online shopping cart abandonment rate is 70.22%. That is Baymard Institute's documented average, the unweighted mean of 50 studies published between 2006 and 2025, last updated on 28 October 2026 (Baymard Institute). Put simply, about seven in ten carts are left without an order. The figure The B2B House used, 69.8%, was Baymard's average a few updates ago; the number has barely moved in years, which is itself the finding. Despite a decade of checkout tools, the share of carts that never convert is stubbornly stable.
Part of that is unavoidable. In Baymard's survey of US online shoppers, 42% of those who abandoned said they were "just browsing" or not ready to buy. Baymard's list of reasons excludes that group and asks the rest why they left during checkout. Extra costs are the clear leader.
| Reason for abandoning an order during checkout (US adults) | Share |
|---|---|
| Extra costs too high (shipping, tax, fees) | 40% |
| Delivery was too slow | 20% |
| Didn't trust the site with credit card information | 19% |
| The site wanted me to create an account | 18% |
| Too long or complicated checkout process | 17% |
| Website had errors or crashed | 17% |
| Returns policy wasn't satisfactory | 13% |
| Couldn't see or calculate total order cost up front | 12% |
| Credit card was declined | 10% |
| Not enough payment methods | 9% |
| Unsure why | 7% |
Source: Baymard Institute, Cart Abandonment Rate statistics, last updated 28 October 2026. Shares exclude the 42% who were just browsing. Shoppers could choose more than one reason.
Three of the top five reasons are about surprises: costs that appear late, delivery that is slower than expected, and an account wall. All three are design choices rather than market conditions, which is why Baymard's broader research argues that most large retailers can recover a meaningful share of abandoned orders through checkout design alone. Baymard says mobile generally carries a higher abandonment risk than desktop but does not publish a separate mobile rate on this page. The old "85.65% mobile abandonment" figure The B2B House quoted came from SaleCycle data for 2020; we have not found a current update from SaleCycle.
B2B checkouts have the same problems with extra steps. A B2B buyer who cannot see a price, has to request a quote, or must create an account before learning whether a product fits is the B2B version of the 18% who quit at an account wall. Gartner's research on rep-free buying, covered in section 09, is in large part a list of the same frictions.
Cite: "The average documented online cart abandonment rate is 70.22% (Baymard Institute, 50 studies, October 2026); 40% of US shoppers who abandon at checkout cite extra costs." Kiin Labs, kiin.co/research/ecommerce-statistics#cart-abandonment
Who are the biggest ecommerce companies?
Amazon is the largest ecommerce company outside China, with net sales of $716.9 billion in 2025, up 12% (Amazon Q4 2025 results). That total includes AWS, its cloud business ($128.7 billion in 2025), as well as advertising and subscriptions, so it is not all retail. In the July to September 2026 quarter Amazon's net sales were $201.9 billion, up 12% (13% excluding currency), with North America up 6% to $112.9 billion and International up 5% to $43.1 billion. Its operating margin of 13.9% was its highest ever (Amazon, 29 October 2026).
The B2B House's "Amazon accounted for 38% of all online retail sales in the United States" came from an eMarketer estimate for 2020. Amazon does not publish its US share of ecommerce and the Census Bureau does not publish company shares, so there is no primary source for a current figure. We have not replaced it.
The fastest-growing large platforms are the ones that serve other merchants. Shopify processed $119.1 billion of gross merchandise volume in the July to September 2026 quarter, up 29% (30% in constant currency), on revenue of $3.74 billion, up 32%. On its earnings call it said B2B GMV, merchants selling to other businesses through Shopify, grew 74% (Shopify Q3 2026 results, as reported by PPC Land; Shopify investor relations). Walmart's global ecommerce sales grew 23% in its quarter to 31 July 2026, and its global advertising business grew 38% (Walmart, 20 August 2026).
| Company | Figure | Period | Source |
|---|---|---|---|
| Amazon, net sales | $716.9 billion (+12%) | 2025 | Amazon |
| Amazon, net sales | $201.9 billion (+12%) | Jul to Sep 2026 | Amazon |
| Amazon, North America segment | $112.9 billion (+6%) | Jul to Sep 2026 | Amazon |
| Amazon Business, annualised gross sales | $60 billion+ (11M+ organisations) | Q2 2026 | Amazon |
| Shopify, gross merchandise volume | $119.1 billion (+29%) | Jul to Sep 2026 | Shopify, via PPC Land |
| Shopify, B2B GMV growth | +74% | Jul to Sep 2026 | Shopify earnings call, via PPC Land |
| Walmart, global ecommerce growth | +23% (Walmart US +24%) | May to Jul 2026 | Walmart |
| Walmart, global advertising growth | +38% (Walmart Connect US +43%) | May to Jul 2026 | Walmart |
| eBay, gross merchandise volume | $23.2 billion (+15%) | Jul to Sep 2026 | eBay Q3 2026 release |
| eBay, active buyers | 147 million (136M excl. Depop and Tise) | Sep 2026 | eBay Q3 2026 release |
| Etsy, marketplace gross merchandise sales | $2.65 billion (+8.8%) | Jul to Sep 2026 | Etsy Q3 2026, via Value Added Resource |
Sources: company earnings releases for the quarters shown. Gross merchandise volume (GMV) is the value of goods sold through a platform, not the platform's revenue. Shopify, Etsy and part of eBay figures were confirmed through trade coverage of the releases; see sources.
Notice the advertising lines. Walmart's ad business grew faster than its ecommerce sales, and Amazon's chief executive cited advertising "growing 22%" alongside its Q4 2025 results. Retail media, ads sold by retailers on their own sites, is now one of the biggest ad channels in the world, and it exists because buying moved online. The same thing is happening in B2B: the platforms where business buyers research and buy are becoming ad channels too.
Cite: "Amazon's net sales were $716.9 billion in 2025; Amazon Business passed $60 billion in annualised gross sales in Q2 2026 (Amazon)." Kiin Labs, kiin.co/research/ecommerce-statistics#marketplaces
How big is B2B ecommerce?
B2B ecommerce is most of ecommerce. In the US, manufacturers shipped $4.83 trillion of goods through ecommerce in 2022 and merchant wholesalers sold $3.76 trillion online, together $8.59 trillion, against $997.5 billion for retail. Those are the US Census Bureau's latest E-Stats figures, published March 2025 (US Census Bureau, E-Commerce Activity Across Sectors: 2021 and 2022). Add service industries ($1.77 trillion) and US ecommerce across the four sectors was $11.36 trillion. Manufacturing and wholesale, which are almost entirely sales to other businesses, were about 76% of it (our calculation from the Census figures). Retail ecommerce, the number most "ecommerce statistics" pages are about, was under 9%.
| US ecommerce by sector | 2022 | 2021 | Change | Share of 2022 total |
|---|---|---|---|---|
| Manufacturing (ecommerce shipments) | $4,825.9 billion | $4,230.8 billion | +14.1% | 42.5% |
| Merchant wholesale trade (ecommerce sales) | $3,760.2 billion | $3,280.0 billion | +14.6% | 33.1% |
| Service industries (ecommerce revenue) | $1,773.9 billion | $1,649.6 billion | +7.5% | 15.6% |
| Retail trade (ecommerce sales) | $997.5 billion | $936.6 billion | +6.5% | 8.8% |
| Total, four sectors | $11,357.5 billion | $10,097.0 billion | +12.5% | 100% |
Source: US Census Bureau, 2022 E-Stats, "E-Commerce Activity Across Sectors: 2021 and 2022" (25 March 2025). Totals, changes and shares are our calculations from the published sector figures. Merchant wholesale includes manufacturers' sales branches and offices; the Census Bureau notes a 40.4% response rate for that estimate and advises caution. Not adjusted for price changes.
How much of each sector is online? The Census Bureau stopped publishing a full E-Stats report with shares after the 2019 data year. In 2019, ecommerce was 67.8% of all US manufacturing shipments and 33.3% of merchant wholesale sales, against 10.7% of retail sales and 7.6% of services revenue (US Census Bureau, E-Stats 2019, August 2021). Much of the manufacturing figure is EDI: large companies ordering parts and materials from each other through connected systems. That is ecommerce by definition, but it is not what most marketers picture. The part that changes marketing is the newer layer on top: business buyers using websites, marketplaces and portals the way consumers do.
| Ecommerce share of each US sector | 2019 | 2018 |
|---|---|---|
| Manufacturing shipments | 67.8% | 67.4% |
| Merchant wholesale sales | 33.3% | 32.4% |
| Retail sales | 10.7% | 9.6% |
| Selected services revenue | 7.6% | 7.1% |
Source: US Census Bureau, E-Stats 2019: Measuring the Electronic Economy, released 5 August 2021. This is the latest year with published shares; later E-Stats releases publish values only.
How B2B buyers want to buy
Most B2B buyers now say they would rather not deal with a salesperson at all. In a Gartner survey of 632 B2B buyers in August and September 2024, 61% said they preferred a rep-free buying experience overall; 73% said they actively avoid suppliers who send irrelevant outreach; and 69% reported inconsistencies between what a supplier's website said and what its salespeople said (Gartner, 25 June 2025). A year later the preference had grown: in Gartner's August to September 2025 survey of 646 buyers, 67% favoured a rep-free experience and 45% said they had used AI tools during a recent purchase (Digital Commerce 360, reporting Gartner, March 2026). Gartner's May 2026 release added that 69% of B2B buyers turn to sales reps to check what AI tools have told them (Gartner, 20 May 2026).
Gartner's wording is careful and worth keeping: buyers prefer self-service for gathering general information, and still want a seller's input for judgement calls such as whether a product fits their company. "Rep-free" is a preference, not a prediction that sales teams disappear.
McKinsey's B2B Pulse survey shows the same shift from the supplier side. Its 2024 edition, nearly 4,000 B2B decision makers in 13 countries, found a "rule of thirds": at any stage of the buying journey, roughly a third of customers want in-person interaction, a third remote, and a third digital self-serve. B2B buyers now use around ten channels in a buying journey, double the five McKinsey recorded in 2016, and comfort with large remote or self-serve orders has jumped, notably for orders above $500,000 (McKinsey, "Five fundamental truths", 2024). Digital Commerce 360's report of the survey puts the share of B2B buyers willing to spend more than $500,000 in a single self-serve or remote transaction at 39%, up from 28% two years earlier (Digital Commerce 360, September 2024).
| B2B buying statistic | Figure | Date | Source |
|---|---|---|---|
| B2B buyers preferring a rep-free buying experience | 67% | Survey Aug to Sep 2025 (n=646) | Gartner, via Digital Commerce 360 |
| Same, previous survey | 61% | Survey Aug to Sep 2024 (n=632) | Gartner |
| B2B buyers who used AI tools in a recent purchase | 45% | Survey Aug to Sep 2025 | Gartner, via Digital Commerce 360 |
| B2B buyers who turn to reps to validate AI-generated insights | 69% | May 2026 release | Gartner |
| B2B buyers who avoid suppliers sending irrelevant outreach | 73% | Survey Aug to Sep 2024 | Gartner |
| Channels used in a B2B buying journey | about 10 (5 in 2016) | 2024 | McKinsey B2B Pulse |
| Preferred mode at each buying stage | ⅓ in person, ⅓ remote, ⅓ self-serve | 2024 | McKinsey B2B Pulse |
| Buyers willing to spend $500,000+ in one remote or self-serve order | 39% (28% two years earlier) | 2024 | McKinsey B2B Pulse, via Digital Commerce 360 |
| Amazon Business, annualised gross sales | $60 billion+ ($35B in Dec 2025 update) | Q2 2026 | Amazon |
| Organisations buying on Amazon Business | 11 million+ (1.8M added in H1 2026) | Jul 2026 | Amazon |
| Shopify B2B GMV growth | +74% | Jul to Sep 2026 | Shopify, via PPC Land |
Sources: Gartner press releases (25 June 2025, 20 May 2026; direct page access was blocked on 14 Nov 2026, figures confirmed in Gartner's indexed release text and trade coverage); McKinsey B2B Pulse 2024; Digital Commerce 360; Amazon (21 July 2026); Shopify Q3 2026. The Amazon Business $35 billion comparison is Amazon's earlier disclosure as reported in coverage of the July 2026 update.
Amazon Business is the clearest single sign of B2B buying moving to marketplaces. Amazon says its business marketplace passed $60 billion in annualised gross sales in the second quarter of 2026 and serves more than 11 million organisations, with 1.8 million joining in the first half of 2026 alone (Amazon, updated 21 July 2026). Amazon is careful to say gross sales are the value of purchases on the marketplace, not Amazon's revenue. Shopify's B2B GMV growth of 74% points the same way from the merchant side: manufacturers and wholesalers are building self-serve stores for business customers.
The B2B House page did not have a B2B ecommerce section. One site that linked to it, writing about B2B ecommerce, quoted "mobile commerce accounts for 79% of B2B ecommerce sales" and credited The B2B House. That figure was never about B2B: the original line was an eMarketer estimate that 79% of ecommerce in China was mobile in 2021. Details below.
Cite: "US manufacturers and wholesalers sold $8.59 trillion through ecommerce in 2022, about 76% of all US ecommerce; retail was under 9% (US Census Bureau E-Stats). 67% of B2B buyers prefer a rep-free experience (Gartner, 2025 survey)." Kiin Labs, kiin.co/research/ecommerce-statistics#b2b-ecommerce
Do reviews, language and personalisation change sales?
Yes, and the best-sourced numbers on this are some of the oldest ones still in circulation. Several of the most-linked figures from The B2B House page sit in this section. Here is what each one actually rests on.
Reviews
97% of US consumers read reviews for local businesses, and 49% trust online reviews about as much as recommendations from people they know. Those are from BrightLocal's 2026 Local Consumer Review Survey of 1,002 US adults, published 11 February 2026. The share who always read reviews before choosing a business rose to 41%, from 29% in 2025 (BrightLocal). The figure The B2B House carried, "91% of consumers aged 18 to 34 trust online reviews as much as personal recommendations", came from an earlier BrightLocal survey; BrightLocal's own data shows trust in reviews has fallen since, as fake reviews became a known problem. Quote 49% for 2026.
The purchase likelihood for a product with five reviews is 270% greater than for one with no reviews. This is from Northwestern University's Spiegel Research Center, first published in 2017, and it still stands on Spiegel's site. For higher-priced products the effect was larger, with conversion up 380%, and purchase likelihood peaked at average ratings between 4.0 and 4.7 stars rather than at a perfect 5 (Spiegel Research Center). Note the exact wording: it compares five reviews to zero. It is not "displaying reviews increases conversion by 270%" for any site that already has some reviews.
Language and localisation
76% of online shoppers prefer to buy products with information in their own language, and 40% will never buy from websites in other languages. That is CSA Research's "Can't Read, Won't Buy" study of 8,709 consumers in 29 countries, published 7 July 2020. The same study found 65% prefer content in their language even if it is poor quality, and 73% want at least product reviews in their language (CSA Research). The B2B House's "75% prefer to buy in their native language" was the 2014 edition of the same research; 76% is the update.
"Websites with localized content are 2.67 times more likely to generate sales" is a different story. It is one of the most-linked figures on the old page, but it does not appear in CSA Research's published findings and we could not trace it to any study. We recommend quoting the 76% and 40% figures instead. Details below.
Personalisation
80% of consumers said they are more likely to make a purchase when brands offer personalised experiences. That is from Epsilon's survey of 1,000 US consumers aged 18 to 64, published 9 January 2018 (Epsilon). The B2B House quoted it as 84%; Epsilon's figure is 80%. It is a stated preference from a 2017 survey, not a measured sales effect, so quote it as such.
| Statistic | Figure | Date | Source |
|---|---|---|---|
| US consumers who read reviews for local businesses | 97% | 2026 | BrightLocal |
| Who always read reviews before choosing | 41% (29% in 2025) | 2026 | BrightLocal |
| Who trust reviews about as much as personal recommendations | 49% | 2026 | BrightLocal |
| Purchase likelihood, five reviews vs none | +270% | 2017 | Spiegel Research Center |
| Same, higher-priced products | +380% | 2017 | Spiegel Research Center |
| Shoppers preferring product information in their own language | 76% | 2020 | CSA Research |
| Who never buy from sites in other languages | 40% | 2020 | CSA Research |
| Consumers more likely to buy with personalised experiences | 80% | 2018 | Epsilon |
Sources: BrightLocal (11 Feb 2026), Spiegel Research Center (2017), CSA Research (7 Jul 2020), Epsilon (9 Jan 2018).
For B2B buyers the review equivalents are G2, Capterra, TrustRadius, analyst reports and peers on LinkedIn. The mechanics are the same: buyers who are increasingly happy to buy without a salesperson rely more on what other buyers say. If you sell to businesses, your reviews, case studies and the people who post about your product are part of your ecommerce experience whether or not you sell online.
Cite: "Purchase likelihood for a product with five reviews is 270% greater than with none (Spiegel Research Center); 76% of shoppers prefer product information in their own language (CSA Research, 2020)." Kiin Labs, kiin.co/research/ecommerce-statistics#reviews-language
How profitable is ecommerce?
Most retailers, online or not, make single-digit margins. NYU Stern professor Aswath Damodaran's January 2026 data on US listed companies puts the net margin of general retailers at 5.61% and their pre-tax operating margin at 6.80%, against 9.74% and 12.82% for the whole market (Damodaran Online, Margins by Sector (US), January 2026). Damodaran does not publish a separate online retail category. At the top end, Amazon reported an operating margin of 13.9% in the July to September 2026 quarter, its highest ever, but much of that profit comes from AWS and advertising rather than selling goods (Amazon).
| Margin measure (US listed companies) | Retail (General) | Total market |
|---|---|---|
| Number of firms | 23 | 5,994 |
| Gross margin | 33.18% | 37.76% |
| Pre-tax operating margin | 6.80% | 12.82% |
| Net margin | 5.61% | 9.74% |
Source: Aswath Damodaran, NYU Stern, Margins by Sector (US), data as of January 2026. Unadjusted operating margins shown.
That matters because one of the most-linked figures from The B2B House was "the average profit margin for ecommerce businesses is around 20% globally", alongside regional figures (17% US, 18% Europe, 22% Asia-Pacific) and "10 to 15% in electronics, 20 to 30% in fashion". None of these could be traced to the sources they were credited to, and a 20% average net margin is roughly four times what listed general retailers actually earn. They may describe gross margins on particular products, which are a different thing. We list them in stats we no longer recommend, and the original figures stay in the archive.
The same goes for the startup failure rates on the old page ("90% of ecommerce startups fail within 120 days", "80% in Europe within five years"). None traced to its credited source. If you need a business survival figure, the US Bureau of Labor Statistics' Business Employment Dynamics data on establishment survival is the primary source to use; it does not separate ecommerce businesses.
Cite: "US general retailers earn a net margin of 5.61% (Damodaran, NYU Stern, January 2026); the widely quoted 20% average ecommerce profit margin has no traceable source." Kiin Labs, kiin.co/research/ecommerce-statistics#margins
What does B2B buying moving online mean for marketers?
The numbers above say the same thing three ways: most ecommerce is B2B, B2B buyers prefer to buy without a salesperson, and the places they research and buy are online. In the US, three quarters of ecommerce by value is manufacturers and wholesalers selling to other businesses. Two thirds of B2B buyers say they would rather not talk to a rep. Amazon Business added 1.8 million organisations in six months. If you sell to businesses, your buyer has probably made up most of their mind before they fill in a form.
That changes what B2B advertising is for. When buyers research alone across ten channels, the job of paid media is to be present, credible and remembered during that research, then easy to act on when the buyer is ready. In practice, for the sales-led B2B companies we work with, it splits into three jobs:
- Capture people already searching. Self-serve buyers start with search, and increasingly with AI answers built on search. Google Ads on high-intent terms, plus retargeting of anyone who has visited your pricing or product pages, is the part of the budget closest to the order.
- Reach the buying committee before they search. B2B purchases involve several people, most of whom never visit your site until late. LinkedIn Ads is the only major platform where you can target by company, job title and seniority, which is why it carries the bulk of B2B demand creation. Our LinkedIn Ads benchmarks, from a panel of 1,000+ advertiser accounts and $65M+ of spend, put the median CPM at $36.23 and the median cost per demo request lead at $350 (top quarter under $161), against $164 for content leads such as guide downloads.
- Stay in front of them cheaply. Meta Ads costs far less per impression than LinkedIn and works well for retargeting known accounts and website visitors, and for B2B products bought by small businesses and founders who scroll Instagram like everyone else.
The ecommerce numbers also explain why the old B2B playbook of gating everything behind a form and passing it to sales is weakening. Gartner's buyers prefer to gather information without a rep and only want one for judgement calls. That favours ungated content, clear public pricing where you can, reviews and proof from peers, and ads that send people to useful pages rather than to a demo form on the first click. It does not mean demo requests stop mattering: they are still where most B2B revenue starts. It means the path to them is longer and mostly self-directed.
For the wider picture of B2B marketing budgets, channels and buyer behaviour, see our sibling page, B2B marketing statistics 2026. For LinkedIn-specific numbers, see 150 LinkedIn Ads statistics and LinkedIn statistics 2026.
Cite: "The median LinkedIn advertiser pays $36.23 CPM and $350 per demo request lead (Kiin Labs panel, 1,000+ accounts, $65M+ spend, 2026)." Kiin Labs, kiin.co/research/ecommerce-statistics#b2b-marketers
Figures previously published by The B2B House
The B2B House's "E-commerce Statistics, Trends, and Insights for 2024" was linked to by more than 40 websites, including a peer-reviewed marketing journal. The B2B House is now part of Kiin, so the figures it published stay here, exactly as published, so every link to them still makes sense. Next to each one is what we know in 2026.
Two things to know before you use them:
- They are old. The guide was titled for 2024, but nearly every figure was from 2019 to 2021, and several were forecasts for years that have now passed.
- Many have no traceable source. The guide credited a source in brackets after each figure but rarely linked to it. Where we found the original, we give it. Where we could not, we say so rather than invent a replacement.
"Global ecommerce sales reached $4.9 trillion in 2021, expected to grow to $6.4 trillion by 2024"
As published: In 2021, global e-commerce sales reached a staggering $4.9 trillion, and this figure is expected to grow to $6.4 trillion by 2024 (Statista). Also: e-commerce sales accounted for 21.3% of total global retail sales in 2021 (Statista); approximately 2.14 billion people worldwide purchased goods and services online in 2021 (Statista).
2026: These were research-firm estimates and forecasts for global consumer retail ecommerce, not all ecommerce. The measured official figure is UNCTAD's: business ecommerce sales of almost $27 trillion in 2022 across 43 economies, most of it B2B (UNCTAD 2024). UNCTAD's own 2019 estimate of global B2C ecommerce was also $4.9 trillion. There is no official measured figure for global online retail in 2024 to check the $6.4 trillion forecast against; national figures are in section 02 to section 04.
"53% of mobile users abandon a site that takes longer than 3 seconds to load"
As published: According to a study by Google, 53% of mobile users will abandon a site if it takes longer than 3 seconds to load.
2026: A real Google finding, from 2016: 53% of mobile site visits were abandoned if pages took longer than three seconds to load, in a study of more than 10,000 mobile domains on 3G and 4G (Think with Google). Google has not updated it. Quote it as "Google, 2016". See section 05.
"The average online shopping cart abandonment rate is 69.8%"
As published: The average online shopping cart abandonment rate is 69.8% (Baymard Institute). Mobile cart abandonment rates were 85.65% in 2020, higher than the average rate of 69.8% across all devices (SaleCycle). Approximately 30% of abandoned shopping carts can be recovered with targeted discount offers (Baymard Institute).
2026: Baymard's documented average is now 70.22%, from 50 studies, updated 28 October 2026 (Baymard Institute). The top checkout reason is extra costs (40%). We found no current SaleCycle mobile figure, and the "30% recovered with discount offers" line does not appear in Baymard's published research; we no longer use it. See section 06.
"Facebook ads have a 9.21% conversion rate on average for ecommerce businesses"
As published: Facebook ads have a 9.21% conversion rate on average for e-commerce businesses (WordStream).
2026: Misattributed. 9.21% was WordStream's average Facebook conversion rate across all industries in its older benchmarks, mostly lead generation, not an ecommerce figure. WordStream's newer benchmark reports are split by campaign objective and industry and give lower numbers; we could not open the 2025 report directly to confirm a retail figure. For a current view of Meta ad performance in B2B, see Kiin's Meta Ads page.
"79% of ecommerce in China was mobile" (quoted elsewhere as "79% of B2B ecommerce sales")
As published: In 2021, mobile commerce accounted for 79% of e-commerce sales in China (eMarketer). Also: China accounted for 52.1% of global e-commerce sales in 2021; China's cross-border e-commerce sales reached $164 billion in 2021; livestreaming e-commerce in China generated $363 billion in 2021.
2026: The 79% was an eMarketer estimate for China, not for B2B. At least one site quotes it as "mobile commerce accounts for 79% of B2B e-commerce sales", which is a misreading. China's statistics bureau does not publish a mobile share. What it does publish: online retail sales of goods of 9.51 trillion yuan in January to September 2026, up 3.8%, about a quarter of retail sales of goods (NBS China). We have no current primary source for the 52.1%, $164 billion or $363 billion figures.
"Product page content can increase conversion rates by up to 20%"
As published: Product page content can increase e-commerce conversion rates by up to 20% when it includes detailed product descriptions, images, and videos (BigCommerce).
2026: No traceable source. We could not find this figure in BigCommerce's published material. The direction is supported by stronger evidence: in Baymard's checkout research 12% of abandoners left because they could not see the total cost up front, and Spiegel found five reviews raise purchase likelihood by 270% against none. Quote those instead (section 06, section 10).
"Shoppable Instagram posts generate an 89% increase in engagement"
As published: Shoppable Instagram posts generate an 89% increase in engagement compared to non-shoppable posts (Smartly.io). Also: Instagram Checkout users are 70% more likely to complete their purchase (Facebook); 70% of shopping enthusiasts turned to Instagram for product discovery in 2021 (Facebook); 55% of online shoppers made a purchase after seeing a product on a Facebook Story (Facebook).
2026: No current source for any of these. The best measured figure for social commerce is Adobe's: social media drove 4.6% of US holiday online revenue in 2025, and affiliates including influencers 20.4% (Adobe). See section 07.
"77% of online shoppers read reviews before making a purchase"
As published: 77% of online shoppers read product reviews before making a purchase (KPMG). 77% of online shoppers read reviews before making a purchase decision (BrightLocal). 72% of customers won't take action until they've read reviews (Testimonial Engine).
2026: BrightLocal's 2026 survey: 97% of US consumers read reviews for local businesses, and 41% always do before choosing (BrightLocal, February 2026). The KPMG and Testimonial Engine figures could not be traced. See section 10.
"91% of consumers aged 18 to 34 trust online reviews as much as personal recommendations"
As published: Approximately 91% of consumers aged 18-34 trust online reviews as much as personal recommendations (BrightLocal). A single negative review can drive away 22% of potential customers, while three negative reviews can increase that number to 59% (ReviewTrackers).
2026: Trust has fallen. In BrightLocal's 2026 survey, 49% of US consumers trust online reviews about as much as recommendations from people they know (BrightLocal). The 91% was from an earlier BrightLocal survey of a younger age group. We did not find a current ReviewTrackers source for the 22% and 59% figures.
"Displaying reviews can increase conversion rates by up to 270%"
As published: Displaying reviews on an e-commerce site can increase conversion rates by up to 270% (Spiegel Research Center).
2026: Still the source, with a narrower meaning: the purchase likelihood for a product with five reviews is 270% greater than for one with no reviews, and 380% for higher-priced products (Spiegel Research Center, 2017). Use the five-versus-zero wording.
"Websites with localized content are 2.67 times more likely to generate sales"
As published: Websites with localized content are 2.67 times more likely to generate sales (Common Sense Advisory). Also: in a survey of 3,000 global consumers, 30% abandoned their shopping carts due to content translation issues (Smartling); 65% of multinational enterprises believe localization is essential for increasing revenues (SDL).
2026: We could not find 2.67x in any CSA Research (formerly Common Sense Advisory) publication, and it is not in CSA's 2020 "Can't Read, Won't Buy" findings. Quote CSA's measured figures instead: 76% of online shoppers prefer product information in their own language and 40% never buy from sites in other languages (CSA Research, July 2020). The Smartling and SDL figures could not be traced either. Some sites now quote the 2.67x as "3x more likely to convert international leads", which is a further step from any source.
"75% of online shoppers prefer to buy products in their native language"
As published: 75% of online shoppers prefer to buy products in their native language (CSA Research).
2026: Updated by the same researcher: 76% prefer to buy products with information in their native language, 65% prefer content in their language even if it is poor quality, and 73% want product reviews in their language (CSA Research, 8,709 consumers in 29 countries, 2020). No newer edition has been published.
"63% of shoppers begin their product searches online"
As published: 63% of shoppers begin their product searches online before making a purchase (Retail Dive). Also: 49% of users say they use Google to discover or find a new item or product (Think with Google); 81% of online shoppers conduct research before making a purchase (GE Capital Retail Bank).
2026: We could not trace the 63% to a Retail Dive study, and the GE Capital figure dates from 2013. The current direction is clear from measured data: traffic to US retail sites from generative AI tools rose 693.4% in the 2025 holiday season (Adobe), and 45% of US consumers used AI tools to find a local business in 2026 (BrightLocal). For B2B, 45% of buyers used AI tools in a recent purchase (Gartner, 2025 survey). See section 09.
"84% of consumers are more likely to shop with brands that offer personalized experiences"
As published: 84% of consumers are more likely to shop with brands that offer personalized experiences (Epsilon).
2026: Epsilon's published figure is 80%, not 84%: "80% of consumers are more likely to make a purchase when brands offer personalized experiences", from a survey of 1,000 US consumers published 9 January 2018 (Epsilon). There is no newer edition.
"The average ecommerce profit margin is around 20%" and "electronics operates on 10 to 15% margins"
As published: The average profit margin for e-commerce businesses is around 20% globally (Digital Commerce 360). E-commerce businesses in the US report an average profit margin of 17% (CFO Magazine). In Europe approximately 18%; Asia-Pacific around 22%; Latin America around 16%; Middle East and Africa 15% (Statista). The average profit margin for e-commerce businesses in the fashion industry is 20-30%, while for electronics, it's around 10-15% (McKinsey).
2026: None of these could be traced to the source credited. Measured margins are much lower: US general retailers had a net margin of 5.61% and a pre-tax operating margin of 6.80% in Damodaran's January 2026 data (NYU Stern). We no longer recommend the 20% figure or the regional and category figures. See section 11.
"Ecommerce businesses saw a 6% increase in operating costs due to inflation in 2021" (McKinsey)
As published: According to a study by McKinsey & Company, e-commerce businesses have experienced an average increase of 6% in operating costs due to inflationary pressures in 2021. Also: global inflation increased from 3.2% in 2020 to 4.4% in 2021 (IMF); global shipping costs increased by 80% in 2021 compared to 2019 (UNCTAD); currency fluctuations increased cross-border e-commerce transaction costs by an average of 5% in 2021 (EY).
2026: We could not find the 6% figure in any McKinsey publication, or the 5% figure in EY's. We could not match the "80%" shipping cost figure to a specific UNCTAD table either. These were 2021 conditions and are not useful as current statistics.
"90% of ecommerce startups fail within 120 days"
As published: Approximately 90% of e-commerce startups fail within their first 120 days (Failory). In Europe, around 80% of e-commerce businesses fail within the first five years (European Commission). In Latin America, 60% within the first three years (América Economía). In North America, around 70% within the first five years (Forbes). In Asia, nearly 60% within five years (Tech in Asia).
2026: None of these traced to an original study, and "90% within 120 days" in particular has no data behind it that we could find. Several startup-statistics pages still cite these figures with The B2B House as their source. For business survival rates, use official data such as the US Bureau of Labor Statistics' Business Employment Dynamics, which does not separate ecommerce firms.
Discounts and promotions: "23% average holiday discount", "flash sales increase revenue by up to 35%"
As published: E-commerce businesses offered an average discount of 23% on products during the holiday season in 2020 (Adobe Digital Insights). Flash sales can increase e-commerce revenues by up to 35% (BigCommerce). In 2020, over 62% of e-commerce marketers used email marketing to promote discounts and sales (Statista). In 2020, free shipping was the most popular online shopping promotion, with 74% of consumers ranking it as the most important promotion (National Retail Federation). 49% of consumers say they're more likely to shop online when free shipping is offered (Statista).
2026: The most useful current figure is Baymard's: 40% of US shoppers who abandon at checkout do so because extra costs such as shipping were too high, and 20% because delivery was too slow (Baymard, October 2026). Free and fast delivery still matters more than discounts. The flash-sale figure could not be traced. Adobe's 2025 holiday data is in section 03.
Other figures from the original guide
As published: Amazon accounted for 38% of US online retail sales in 2020 (eMarketer); Amazon's 2020 net revenue was $386 billion; Alibaba GMV $1.2 trillion (2020); Walmart US ecommerce $64.9 billion (2021); Shopify supports 1.7 million businesses in 175 countries; eBay GMV $100 billion (2020); Etsy GMS $10.3 billion (2020); JD.com revenue $114.3 billion (2020); Coupang revenue $12 billion (2020); average ecommerce conversion rate 2.58% (IRP Commerce); 24% of ecommerce sales through social media (Hootsuite); 35% of ecommerce transactions through social media in 2021 (eMarketer); video on landing pages increases conversion by 86% (Eyeview); email ROI of 122% (DMA); 54% bought from a chatbot (Drift); 90% say UGC influenced a purchase (TurnTo); 86% of buyers will pay more for a great customer experience (SuperOffice); 89% of companies compete primarily on customer experience (Gartner); content marketing gives six times higher conversion (Aberdeen); US adults 18 to 29: 79% shop online vs 57% of 65+ (Pew); 88% of EU internet users aged 25 to 34 bought online (Eurostat).
2026: Company figures are updated in section 08: Amazon $716.9 billion net sales in 2025; eBay GMV $23.2 billion in Q3 2026 alone; Etsy GMS $2.65 billion in Q3 2026. Eurostat now reports 90% of EU internet users aged 25 to 34 bought online in 2025 (Eurostat). We could not find a current Pew release with the age split The B2B House quoted. Social commerce measured by Adobe is 4.6% of US holiday online revenue, not 24% or 35%. The remaining figures have no current primary source; we keep them here only as the original guide published them.
Ecommerce stats we no longer recommend using
A good statistics page should also say what not to quote. These figures are still widely repeated, including in AI answers, but have no current primary source or have been overtaken:
- "Global ecommerce will reach $6.4 trillion by 2024." A research-firm forecast for consumer retail only. All ecommerce, measured, was almost $27 trillion in 2022 (UNCTAD). Details.
- "72.9% of ecommerce will be mobile by 2023." A forecast that did not come true in the US: 56.4% in the 2025 holiday season (Adobe). Details.
- "Websites with localized content are 2.67x more likely to generate sales." Not found in any CSA Research publication. Details.
- "The average ecommerce profit margin is 20%." Untraceable, and about four times measured retail net margins. Details.
- "90% of ecommerce startups fail within 120 days." No underlying data. Details.
- "Facebook ads convert at 9.21% for ecommerce." An old all-industry average, not an ecommerce one. Details.
- "Mobile commerce is 79% of B2B ecommerce." A misreading of a 2021 estimate for China. Details.
- "24% (or 35%) of ecommerce happens through social media." Measured US social referrals were 4.6% of holiday online revenue in 2025. Details.
- "Shoppable Instagram posts get 89% more engagement" and "Instagram Checkout users are 70% more likely to buy." No current primary source for either. Details.
- "84% of consumers want personalisation." The source, Epsilon, says 80%, from a 2017 survey. Details.
- "30% of abandoned carts can be recovered with discount offers" and "product page content lifts conversion by up to 20%." Neither appears in the research credited.
The original B2B House guide, archived in full
The B2B House is now part of Kiin. So that every link to its guide still makes sense, the complete original is kept below, section by section, exactly as it was last published (only typos fixed). Figures in it are from the dates its authors gave; the sections above give the current numbers and sources. Open any section to read it.
Global e-commerce statistics, trends, and insights
(Section heading only in the original guide.)
In 2021, global e-commerce sales reached a staggering $4.9 trillion, and this figure is expected to grow to $6.4 trillion by 2024 (Statista).
It’s clear that e-commerce is booming and isn’t slowing down anytime soon. As a brand, you should ensure your online presence is strong and user-friendly. A well-designed website and seamless shopping experience will help you capture a piece of this growing market.
Approximately 2.14 billion people worldwide purchased goods and services online in 2021 (Statista).
With such a vast pool of potential customers, it’s essential for brands to optimize their online marketing strategies. This means understanding your target audience, personalizing your marketing efforts, and providing value to keep them coming back for more.
Mobile e-commerce accounted for 54.8% of total e-commerce sales in 2021 (Statista).
It’s more important than ever for brands to have a mobile-friendly website and shopping experience. Ensuring your site is easy to navigate on all devices will help you appeal to mobile shoppers and increase your chances of success.
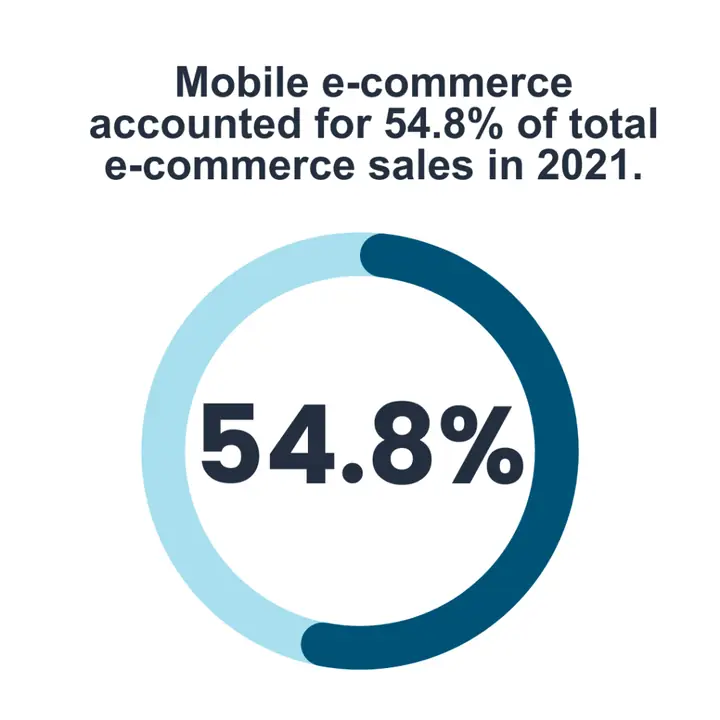
Mobile e-commerce accounted for 54.8% of total e-commerce sales.
The average online shopping cart abandonment rate is 69.8% (Baymard Institute).
Brands need to address the reasons behind cart abandonment. This may include offering a guest checkout option, streamlining the checkout process, or providing real-time customer support to address concerns and questions.
In 2020, Amazon accounted for 38% of all online retail sales in the United States (eMarketer).
If you’re not already selling on Amazon, it might be time to consider it. By joining the platform, you can tap into their vast customer base and take advantage of their established reputation and trust.
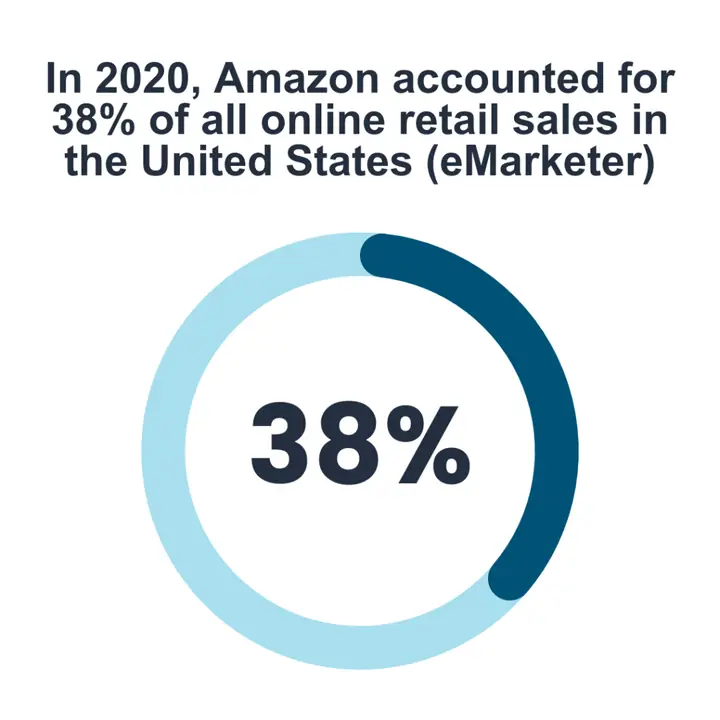
Amazon accounted for 38% of all online retail sales in the United States
49% of consumers say they’re more likely to shop online when free shipping is offered (Statista).
Offering free shipping can be a powerful incentive for customers to complete their purchase. Consider incorporating this into your pricing strategy or offering it as a limited-time promotion.
77% of online shoppers read product reviews before making a purchase (KPMG).
Make sure to encourage and showcase customer reviews on your website. This not only builds trust but also helps potential customers make informed decisions about your products.
The global online fashion market is projected to grow to $1.002 trillion by 2025 (Statista).
If you’re in the fashion industry, this is your time to shine! Invest in high-quality product photography and compelling product descriptions to stand out from the competition and grab a share of this growing market.
By 2025, the global online grocery market is expected to reach $334 billion (Statista).
As more people turn to online grocery shopping for convenience and safety, there’s a huge opportunity for growth in this sector. Offer a user-friendly website, fast delivery, and a wide selection of products to attract online grocery shoppers.
In 2020, the global online travel market was valued at $765 billion (Statista).
While the travel industry took a hit due to the pandemic, online travel bookings are expected to bounce back. Brands should focus on offering competitive pricing, easy booking processes, and flexible cancellation policies to attract customers.
In 2021, 62% of consumers used their smartphones to search for a local business (BrightLocal).
To capitalize on local searches, brands should ensure their online presence is optimized for local SEO, including accurate and up-to-date contact information, business hours, and location data.
24% of e-commerce sales are generated through social media platforms (Hootsuite).
Social media is a powerful tool for driving e-commerce sales. Make sure your brand is active on relevant platforms and that you’re leveraging their advertising and shopping features to reach new customers and drive sales.
In 2021, 57% of online shoppers made a purchase from an overseas retailer (Nielsen).
With the growing trend of cross-border e-commerce, brands should consider offering international shipping options and localizing their website for different languages and currencies to reach a broader audience.
The average e-commerce conversion rate is around 2.58% (IRP Commerce).
To increase conversion rates, brands should focus on improving website usability, offering personalized shopping experiences, and implementing retargeting strategies to re-engage potential customers who didn’t complete a purchase.
In 2020, 30% of online shoppers cited environmental concerns as a reason for reducing their online shopping frequency (Econsultancy).
Brands should prioritize eco-friendly packaging, sustainable products, and carbon-neutral shipping options to cater to environmentally conscious consumers. By promoting these initiatives, you can not only appeal to a growing market segment but also do your part to protect our planet.
Key Global Ecommerce Trends to Watch in 2023
(Section heading only in the original guide.)
According to the International Monetary Fund (IMF), global inflation increased from 3.2% in 2020 to 4.4% in 2021.
This surge in global inflation has a direct impact on e-commerce businesses as they face increased costs of goods and services. Brands should look for ways to optimize their supply chain and streamline operations to minimize the impact of inflation on their profit margins. Being proactive and adaptive will ensure you stay competitive in the market.
The United Nations Conference on Trade and Development (UNCTAD) reported that global shipping costs increased by 80% in 2021 compared to 2019 levels.
Higher shipping costs can put pressure on e-commerce businesses and their customers. To combat this, brands should explore alternative shipping methods, negotiate better rates with carriers, or consider passing on some of the costs to customers through strategic pricing adjustments. It’s important to strike a balance between maintaining profitability and keeping customers happy with affordable shipping options.
According to a study by McKinsey & Company, e-commerce businesses have experienced an average increase of 6% in operating costs due to inflationary pressures in 2021.
This increase in operating costs directly impacts the profitability of e-commerce businesses. To counteract these inflationary pressures, brands should focus on improving operational efficiency and reducing overhead expenses. This could include automating processes, renegotiating supplier contracts, and optimizing inventory management. By keeping costs under control, e-commerce businesses can maintain their competitive edge and continue to thrive in a challenging economic climate.
A report by EY indicates that currency fluctuations, driven by global inflation, have resulted in an average increase of 5% in cross-border e-commerce transaction costs in 2021.
Currency fluctuations can significantly impact the profitability of e-commerce businesses engaged in cross-border transactions. To mitigate the risks associated with currency fluctuations, brands should consider implementing dynamic currency conversion tools or partnering with payment providers offering competitive exchange rates. By staying proactive in managing currency risks, e-commerce businesses can protect their bottom line and continue to provide attractive prices to customers around the world.
Mobile Commerce and the importance of Mobile optimization for e-commerce
(Section heading only in the original guide.)
Mobile commerce is projected to account for 72.9% of total e-commerce sales by 2023 (Statista).
This trend highlights the importance of having a mobile-friendly online store. Brands should invest in responsive website design and mobile apps to offer an exceptional shopping experience for customers on the go. A smooth, user-friendly mobile experience is key to capitalizing on this growing market segment.
The global mobile payment transaction value reached $1.3 trillion in 2020 and is expected to grow to $2.7 trillion by 2023 (Finaria).
The rise of mobile payments indicates a shift in consumer preferences. Brands should ensure they support popular mobile payment options like Apple Pay, Google Pay, and PayPal to offer a seamless and secure checkout process for their customers, ultimately improving conversion rates.
In 2020, 52% of consumers used a mobile device to make at least one purchase, up from 45% in 2019 (PYMNTS.com).
As mobile commerce becomes more prevalent, it’s essential for brands to optimize their online presence for mobile users. This includes offering fast-loading pages, simplified navigation, and a frictionless checkout process that caters to the growing number of mobile shoppers.
In a survey by Adobe, 61% of smartphone users said they were more likely to purchase from mobile sites and apps that provided personalized recommendations.
Personalization is crucial in the mobile commerce space. Brands should leverage customer data to offer tailored product recommendations, promotions, and content. By delivering a personalized shopping experience, you can increase customer engagement and drive more sales from mobile users.
Mobile cart abandonment rates were 85.65% in 2020, higher than the average rate of 69.8% across all devices (SaleCycle).
To address high mobile cart abandonment rates, brands should focus on simplifying the mobile checkout process, offering guest checkout options, and providing mobile-friendly customer support. By tackling these pain points, businesses can improve mobile conversion rates and capitalize on the growing mobile commerce market.
By 2022, the number of mobile commerce users is expected to surpass 3 billion globally (eMarketer).
This massive audience highlights the importance of catering to mobile users in the e-commerce landscape. Brands should ensure their websites, marketing materials, and online content are optimized for mobile devices to tap into this growing market and provide an enjoyable user experience for their customers.
In 2021, 70% of mobile users reported making at least one in-app purchase (AppsFlyer).
The rise of in-app purchases underscores the value of offering a dedicated mobile app for your e-commerce business. By developing an app, brands can provide a more convenient and immersive shopping experience, driving customer loyalty and encouraging repeat purchases.
According to a study by Google, 53% of mobile users will abandon a site if it takes longer than 3 seconds to load.
Speed is crucial for mobile users, and slow-loading websites can lead to lost sales. Brands should focus on optimizing their websites for faster load times on mobile devices, including compressing images, leveraging browser caching, and minimizing the use of heavy scripts. A faster, more responsive site can help retain mobile users and ultimately boost conversions.
Impact of social media, videos, and new marketing channels on e-commerce.
(Section heading only in the original guide.)
Businesses using video on their landing pages have seen an 86% increase in conversion rates (Eyeview Digital).
This statistic highlights the power of video marketing in driving e-commerce sales. Brands should incorporate product videos, demonstrations, and customer testimonials into their websites to engage visitors and encourage them to make a purchase.
E-commerce businesses that use email marketing have an average ROI of 122% (DMA).
Email marketing is an effective channel for increasing e-commerce revenue. Brands should invest in personalized, segmented, and automated email campaigns to engage customers, promote offers, and drive repeat purchases.
Pinterest ads drive 2.3 times more conversions than the average social media ad (Pinterest).
Given the high conversion rate of Pinterest ads, e-commerce businesses should consider incorporating Pinterest into their marketing strategy. Leverage shoppable pins and promoted pins to showcase products and attract potential customers.
In 2021, 35% of all e-commerce transactions were made through social media platforms (Emarketer).
The growing trend of social commerce highlights the need for brands to embrace platforms like Facebook, Instagram, and Pinterest for selling products. Integrate social media shopping features and create engaging content to tap into this rapidly expanding market.
Shoppable Instagram posts generate an 89% increase in engagement compared to non-shoppable posts (Smartly.io).
To maximize e-commerce sales, brands should take advantage of Instagram’s shoppable post feature. This allows customers to directly purchase products through the app, creating a seamless and frictionless shopping experience.
54% of consumers have made a purchase directly from a chatbot (Drift).
Chatbots can play a significant role in driving e-commerce sales. Brands should implement chatbot technology to assist customers, provide product recommendations, and facilitate transactions, ultimately boosting sales and improving customer satisfaction.
Companies using affiliate marketing generate 30% of their revenue from this channel (Forrester Research).
Affiliate marketing can be a powerful driver of e-commerce growth. Brands should consider launching affiliate programs to leverage the reach and influence of industry partners and influencers, driving referral traffic and sales.
In 2020, 60% of global consumers said they discovered new brands through YouTube ads (YouTube).
YouTube advertising can be an effective way to reach new customers and increase e-commerce sales. Brands should create engaging video ads and target their campaigns to reach the right audience on the platform.
Voice shopping is expected to reach $40 billion by 2022 in the U.S. and the U.K. (OC&C Strategy Consultants).
With voice shopping on the rise, e-commerce brands should optimize their websites and content for voice search to stay ahead of the competition. Implement structured data, use natural language, and ensure your products are compatible with popular voice assistants like Alexa and Google Assistant.
49% of users say they use Google to discover or find a new item or product (Think with Google).
To capitalize on this trend, e-commerce brands should optimize their websites for search engine visibility. Invest in SEO strategies, create high-quality content, and use structured data to improve organic search rankings and increase online sales.
90% of consumers said that user-generated content (UGC) influenced their decision to make a purchase (TurnTo Networks).
E-commerce brands should leverage UGC in their marketing efforts, such as featuring customer reviews, photos, and videos on their websites and social media channels. This helps build trust, authenticity, and encourages more sales.
Augmented reality (AR) advertising has a 70% higher memory response than non-AR ads (Nielsen).
Incorporating AR technology into your e-commerce marketing strategy can lead to increased engagement and sales. Brands should explore AR features like virtual try-ons, product demonstrations, and interactive ads to
Facebook ads have a 9.21% conversion rate on average for e-commerce businesses (WordStream).
With such a high conversion rate, e-commerce brands should invest in Facebook advertising to drive sales. Optimize ad targeting, use eye-catching visuals, and create compelling calls-to-action to maximize the impact of your Facebook ad campaigns.
In 2021, 70% of shopping enthusiasts turned to Instagram for product discovery (Facebook).
Given Instagram’s popularity for product discovery, e-commerce brands should maintain an active presence and leverage shoppable posts, Instagram Stories, and Reels to showcase their products and engage potential customers.
YouTube users are 1.9 times more likely to make a purchase after watching a video ad (Think with Google).
E-commerce brands should incorporate YouTube video ads into their marketing strategy. Create engaging, informative, and entertaining video content to capture user attention and drive sales.
In 2020, TikTok reported an average 25% higher user engagement rate for branded content compared to other platforms (TikTok).
E-commerce brands should consider incorporating TikTok into their marketing efforts. Create short, engaging, and entertaining videos that showcase your products and resonate with your target audience to increase brand awareness and drive sales.
60% of consumers have made a purchase via a social media platform’s “Buy” button (Sumo).
The increasing popularity of social commerce highlights the importance of integrating “Buy” buttons on social media platforms. E-commerce brands should adopt this feature to offer a seamless shopping experience and drive sales directly from social media.
In 2021, 55% of online shoppers said they made a purchase after seeing a product on a Facebook Story (Facebook).
Leverage Facebook Stories to showcase your products and offers, as they are an effective channel for driving e-commerce sales. Create engaging, interactive, and time-sensitive content to encourage users to take action and make a purchase.
Instagram Checkout users are 70% more likely to complete their purchase compared to those directed to an external website (Facebook).
E-commerce brands should take advantage of Instagram Checkout to streamline the shopping experience for users. By providing a seamless and frictionless purchase process, you can increase conversions and boost sales.
YouTube’s “TrueView for Shopping” ad format has led to a 3x increase in conversion rates for e-commerce advertisers (Think with Google).
E-commerce brands should explore YouTube’s “TrueView for Shopping” ad format to drive sales. By linking products directly within video ads, you can create a seamless shopping experience that increases conversions and ROI.
80% of TikTok users have discovered a new product or brand on the platform (GlobalWebIndex).
With TikTok being an effective platform for product discovery, e-commerce brands should create engaging, native content that resonates with their target audience. Leverage TikTok’s unique features and trends to showcase your products and drive sales.
In 2021, Facebook Messenger’s “Click to Messenger” ads generated 3.5 times higher conversion rates compared to traditional website ads (Facebook).
E-commerce brands should consider using Facebook Messenger ads to engage customers and drive sales. By offering personalized, one-on-one interactions through Messenger, you can provide a tailored shopping experience that leads to higher conversion rates.
Impact of China and APAC on ecommerce globally
(Section heading only in the original guide.)
In 2021, China accounted for 52.1% of global e-commerce sales (eMarketer).
China’s massive share of the global e-commerce market highlights the importance of considering this region for expansion. Brands should research local consumer preferences, adapt their product offerings, and tailor their marketing strategies to cater to the Chinese market.
The APAC region is expected to account for 65.2% of the world’s e-commerce sales by 2024 (Statista).
The growing influence of the APAC region in the global e-commerce landscape underscores the need for businesses to expand their presence in these markets. Develop localized strategies, forge partnerships with regional platforms, and understand local consumer behavior to tap into this burgeoning market.
In 2021, mobile commerce accounted for 79% of e-commerce sales in China (eMarketer).
The dominance of mobile commerce in China highlights the importance of optimizing e-commerce experiences for mobile devices. Brands should ensure their websites and apps are mobile-friendly and provide seamless shopping experiences for Chinese consumers.
China’s cross-border e-commerce sales reached $164 billion in 2021, a 30% year-over-year growth (eMarketer).
The rapid growth of cross-border e-commerce in China signals a significant opportunity for international brands. Leverage popular cross-border platforms, offer localized payment options, and navigate customs regulations to capitalize on this trend.
In 2021, Southeast Asia’s e-commerce market was valued at $53 billion, up from $5 billion in 2015 (Google, Temasek, and Bain & Company).
The rapid growth of e-commerce in Southeast Asia offers ample opportunities for brands to expand their presence in the region. Understand local market dynamics, cater to diverse consumer preferences, and partner with regional platforms to succeed in this fast-growing market.
India is projected to have 300 million online shoppers by 2025, nearly double the number in 2018 (Bain & Company).
The expanding e-commerce market in India presents significant opportunities for brands. Customize product offerings, adapt pricing strategies, and invest in local partnerships to cater to the unique needs of Indian consumers and capitalize on this growth.
In 2021, online marketplaces accounted for 62% of e-commerce sales in the APAC region (Digital Commerce 360).
The popularity of online marketplaces in the APAC region highlights the importance of partnering with these platforms for e-commerce businesses. Build relationships with leading marketplaces, optimize product listings, and leverage platform-specific marketing tools to increase visibility and drive sales.
In 2021, livestreaming e-commerce in China generated $363 billion in sales (iiMedia Research).
The booming livestreaming e-commerce trend in China demonstrates the potential of this marketing channel. Embrace livestreaming to showcase products, offer exclusive promotions, and engage with Chinese consumers in real-time.
In 2021, mobile wallets were the preferred payment method for 44% of e-commerce transactions in the APAC region (Worldpay Global Payments Report).
Given the preference for mobile wallets in the APAC region, brands should offer popular local payment options, such as Alipay, WeChat Pay, and Paytm, to provide a convenient and seamless checkout experience for customers.
67% of online shoppers in the APAC region cited free shipping as the most critical factor influencing their purchase decision (PwC).
Offering free shipping can have a significant impact on e-commerce sales in the APAC region. Brands should explore ways to provide free or discounted shipping options, which can help attract customers and increase conversion rates.
• H3: 6. The Need for Localized Content and Language
Localization of content and language
(Section heading only in the original guide.)
75% of online shoppers prefer to buy products in their native language (CSA Research).
To cater to these consumer preferences, e-commerce brands should invest in localization efforts. Translate and adapt your website, product descriptions, and customer support content into the languages of your target markets to create a more personalized and familiar shopping experience.
Websites with localized content are 2.67 times more likely to generate sales (Common Sense Advisory).
By localizing content, e-commerce businesses can significantly increase their chances of driving sales. Brands should ensure their marketing materials, website content, and customer communications resonate with local consumers to better connect with their target audience and boost conversions.
In a survey of 3,000 global consumers, 30% abandoned their shopping carts due to content translation issues (Smartling).
Poorly translated content can lead to lost sales. E-commerce brands should invest in high-quality translation services and use native speakers to review and refine content to ensure accuracy, cultural relevance, and an improved user experience.
65% of multinational enterprises believe localization is essential for increasing revenues (SDL).
The majority of multinational enterprises recognize the importance of localization in driving revenue growth. E-commerce brands should prioritize localization efforts, including language translation, adapting visuals, and adjusting product offerings, to meet the specific needs of their target markets and drive global sales.
E-commerce sales and shopping behavior trends
(Section heading only in the original guide.)
63% of shoppers begin their product searches online before making a purchase (Retail Dive).
Considering the prevalence of online product searches, e-commerce brands should optimize their websites and product pages for search engines. Implement SEO best practices to increase visibility, drive organic traffic, and ultimately improve sales.
In 2021, e-commerce sales accounted for 21.3% of total global retail sales (Statista).
As e-commerce continues to grow its share of the retail market, brands should prioritize their online presence and invest in creating seamless, user-friendly shopping experiences that cater to evolving consumer preferences.
84% of consumers are more likely to shop with brands that offer personalized experiences (Epsilon).
E-commerce businesses should invest in personalization technology to deliver tailored shopping experiences. Use customer data to provide relevant product recommendations, personalized offers, and customized content to increase customer loyalty and drive sales.
Nearly 50% of online shoppers have made a purchase based on a recommendation from a social media influencer (GlobalWebIndex).
The impact of influencer marketing on e-commerce sales is significant. Brands should collaborate with influencers who resonate with their target audience to create authentic content that showcases their products and drives purchasing decisions.
77% of online shoppers read reviews before making a purchase decision (BrightLocal).
Given the influence of reviews on purchasing decisions, e-commerce brands should prioritize collecting and displaying customer reviews. Encourage customers to share their experiences, and use their feedback to continuously improve your products and services.
What is the success rate of e-commerce businesses?
(Section heading only in the original guide.)
Approximately 90% of e-commerce startups fail within their first 120 days (Failory).
The high failure rate of e-commerce startups highlights the importance of developing a strong business plan, conducting market research, and refining your product offerings. Focus on providing exceptional customer service, optimizing marketing strategies, and continuously improving the user experience to increase your chances of success.
In Europe, around 80% of e-commerce businesses fail within the first five years (European Commission).
The high failure rate of e-commerce businesses in Europe emphasizes the importance of understanding local market dynamics, consumer behavior, and regulations. To succeed, brands should create region-specific strategies, build relationships with local partners, and invest in targeted marketing efforts.
In Latin America, 60% of e-commerce startups fail within the first three years of operation (América Economía).
The challenging e-commerce landscape in Latin America highlights the need for businesses to adapt to the unique demands of the region. Brands should focus on optimizing logistics, offering local payment options, and understanding cultural nuances to increase their chances of success in this fast-growing market.
In North America, around 70% of e-commerce startups fail within the first five years (Forbes).
The failure rate of e-commerce businesses in North America underscores the importance of differentiating your brand in a competitive market. To increase the chances of success, focus on providing exceptional customer service, implementing effective marketing strategies, and continuously refining your product offerings based on customer feedback.
In Asia, nearly 60% of e-commerce startups fail within their first five years (Tech in Asia).
With a high failure rate for e-commerce startups in Asia, it’s crucial for businesses to understand the diverse markets within the region. Brands should invest in localization efforts, forge strategic partnerships with local platforms, and adapt their marketing and product strategies to cater to the unique needs of consumers in various Asian countries.
What is the demographic of e-commerce audiences
(Section heading only in the original guide.)
In the US, 79% of adults aged 18-29 shop online, compared to 57% of adults aged 65 and older (Pew Research Center).
This age disparity in online shopping indicates the importance of tailoring marketing strategies to different age groups. E-commerce brands should create targeted campaigns and utilize platforms popular among their target demographics to effectively engage with potential customers across age groups.
In Asia, 65% of online shoppers are aged 16-34 (GlobalWebIndex).
With a younger demographic dominating the online shopping landscape in Asia, brands should prioritize mobile optimization, social media engagement, and influencer collaborations to effectively connect with this audience and drive sales.
In Europe, 88% of internet users aged 25-34 have made an online purchase (Eurostat).
Considering the high online shopping adoption rate among this age group in Europe, e-commerce brands should focus on creating targeted marketing campaigns that resonate with this demographic, leveraging platforms and channels popular among them to boost engagement and conversions.
In Latin America, women make up 53.6% of online shoppers, while men account for 46.4% (Statista).
The gender distribution of online shoppers in Latin America highlights the importance of crafting marketing strategies that appeal to both men and women. Brands should ensure their product offerings, marketing materials, and website designs cater to the preferences of both genders to maximize their reach.
In the Middle East, 48% of online shoppers are aged 26-35 (Statista).
Given the significant proportion of online shoppers in the Middle East within this age group, e-commerce brands should tailor their marketing efforts to cater to their needs and preferences. Utilize platforms popular among this demographic and offer products that align with their interests to drive sales in the region.
Which countries are the top in e-commerce adoption
(Section heading only in the original guide.)
China’s e-commerce market reached $1.94 trillion in 2019, representing a CAGR of 35% from 2014 to 2019 (eMarketer).
China’s massive and fast-growing e-commerce market offers significant opportunities for businesses. To succeed in this competitive landscape, brands should understand local consumer behavior, adapt marketing strategies to cater to Chinese consumers, and collaborate with popular e-commerce platforms like Alibaba and JD.com.
The e-commerce market in Nigeria grew at a CAGR of 25.8% between 2014 and 2019 (Statista).
Nigeria’s rapidly growing e-commerce market presents opportunities for businesses looking to expand in Africa. Brands should prioritize understanding the unique characteristics of the Nigerian market, addressing logistics challenges, and offering localized payment options to cater to the preferences of Nigerian consumers.
Australia’s e-commerce market has grown at a CAGR of 17.2% between 2015 and 2020 (Statista).
As e-commerce adoption continues to grow rapidly in Australia, brands should focus on understanding the preferences of Australian consumers, creating tailored marketing campaigns, and offering efficient shipping and return options to meet their expectations.
In South Korea, e-commerce sales grew at a CAGR of 18.7% between 2015 and 2020 (Statista).
South Korea’s fast-growing e-commerce market offers significant opportunities for businesses looking to enter the Asian market. To succeed, brands should understand the unique characteristics of the South Korean market, adapt their marketing strategies to local preferences, and collaborate with popular e-commerce platforms in the country.
Turkey’s e-commerce market has grown at a CAGR of 34% between 2014 and 2019 (Statista).
The rapid growth of e-commerce in Turkey presents an opportunity for businesses looking to expand their reach in the European market. Brands should prioritize understanding the unique consumer behavior in Turkey, investing in targeted marketing efforts, and offering tailored products and services that cater to the market’s preferences.
Indonesia leads the way in e-commerce growth in Southeast Asia, with a CAGR of 49% from 2015 to 2019 (eMarketer).
Indonesia’s rapid e-commerce growth presents a wealth of opportunities for businesses looking to expand in the Southeast Asian market. Brands should invest in understanding the unique characteristics of the Indonesian market, localizing content, and building partnerships with local platforms to capitalize on this growth.
India’s e-commerce market is expected to grow at a CAGR of 27% between 2019 and 2024, reaching $99 billion (PwC).
With India’s fast-growing e-commerce market, brands should focus on understanding the diverse needs of Indian consumers, navigating local regulations, and offering tailored products and services that cater to the market’s preferences.
Mexico’s e-commerce market grew at a CAGR of 28.3% from 2015 to 2020 (Statista).
The rapid adoption of e-commerce in Mexico presents an opportunity for businesses to tap into this emerging market. Brands should prioritize understanding the unique consumer behavior in Mexico, optimizing logistics, and offering localized payment options to successfully capture market share in this growing e-commerce landscape.
Who are the biggest e-commerce companies
(Section heading only in the original guide.)
In 2020, Amazon’s net revenue reached $386 billion, making it the largest e-commerce retailer in the world (Statista).
Amazon’s dominance in the e-commerce market highlights the importance of having a presence on this platform. Brands should optimize their product listings, invest in Amazon advertising, and ensure they meet Amazon’s fulfillment and customer service standards to capitalize on the vast customer base.
In 2020, Alibaba had a gross merchandise volume (GMV) of $1.2 trillion (Alibaba Group).
Alibaba’s massive GMV signifies the company’s dominance in the Chinese e-commerce market. Brands looking to enter or expand in China should consider partnering with Alibaba to leverage its extensive customer base, logistics network, and marketing resources.
In 2021, Walmart’s e-commerce sales in the US reached $64.9 billion (Statista).
Walmart’s strong e-commerce presence in the US underscores the importance of diversifying sales channels. Brands should consider partnering with Walmart to tap into its loyal customer base and take advantage of the company’s brick-and-mortar presence for an omnichannel approach.
Shopify’s platform supports over 1.7 million businesses in more than 175 countries (Shopify).
Shopify’s widespread adoption emphasizes the importance of user-friendly e-commerce platforms for small and medium-sized businesses. Brands looking to establish an online presence should consider leveraging platforms like Shopify for a seamless and customizable e-commerce solution.
In 2020, eBay’s GMV reached $100 billion (Statista).
eBay’s significant GMV highlights the potential of online marketplaces for product exposure and sales. Brands should explore listing their products on eBay and similar platforms to reach a broader audience and take advantage of the platform’s built-in marketing and promotional tools.
In 2020, JD.com’s net revenue reached $114.3 billion, making it the second-largest e-commerce company in China (Statista).
JD.com’s substantial net revenue highlights its significant presence in the Chinese e-commerce market. Brands targeting China should consider partnering with JD.com to access its vast customer base, comprehensive logistics network, and innovative marketing strategies.
In 2020, Etsy’s annual gross merchandise sales amounted to $10.3 billion (Etsy).
Etsy’s impressive sales figures demonstrate the growing popularity of niche marketplaces focused on handmade and vintage items. Brands offering unique, artisanal, or customized products should consider utilizing platforms like Etsy to reach an engaged and targeted audience seeking distinctive products.
In 2020, Coupang, South Korea’s largest e-commerce company, generated $12 billion in revenue (Coupang).
Coupang’s success in South Korea’s e-commerce market highlights the potential of regional online marketplaces. Brands targeting the South Korean market should explore partnering with Coupang to leverage its extensive customer base, rapid delivery infrastructure, and localized marketing expertise.
What is the average profitability of e-commerce businesses?
(Section heading only in the original guide.)
The average profit margin for e-commerce businesses is around 20% globally (Digital Commerce 360).
The global average profit margin highlights the importance of optimizing e-commerce operations. Brands should focus on improving product sourcing, pricing strategies, and cost-efficient marketing to enhance their profitability in the competitive online landscape.
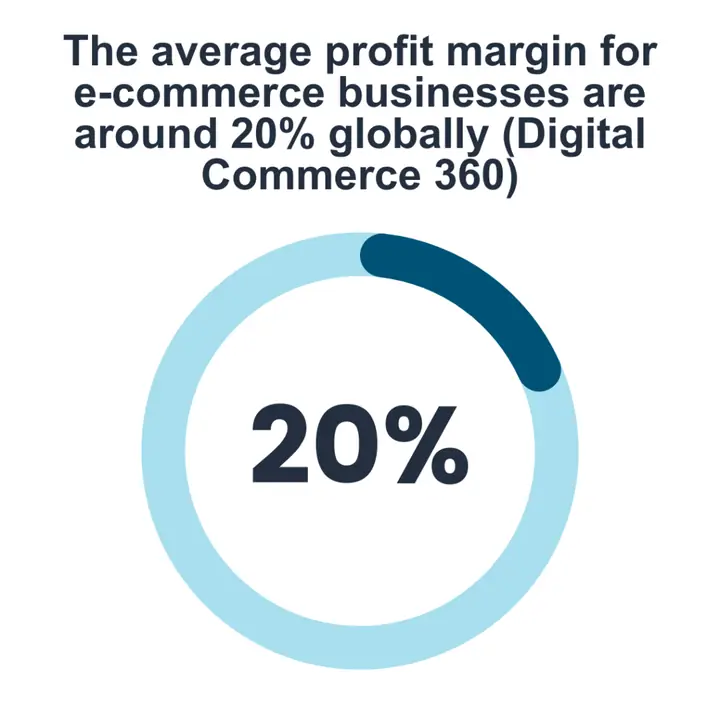
Average profit margin and revenue of e-commerce businesses
E-commerce businesses in the US report an average profit margin of 17% (CFO Magazine).
Given the average profit margin in the US, brands should concentrate on maximizing customer lifetime value, optimizing marketing costs, and implementing efficient fulfillment strategies to sustain and increase their profitability.
In Europe, the average profit margin for e-commerce businesses is approximately 18% (Statista).
European e-commerce brands should focus on regional market nuances, localization, and efficient supply chain management to improve their profit margins and stay competitive in the market.
The average profit margin for e-commerce businesses in the Asia-Pacific region is around 22% (Statista).
Higher average profit margins in the Asia-Pacific region indicate the potential for growth and expansion. Brands should explore untapped markets in the region, optimize logistics, and adapt their marketing strategies to cater to local preferences to maximize profitability.
The average profit margin for e-commerce businesses in Latin America is around 16% (Statista).
With slightly lower profit margins in Latin America, e-commerce brands should focus on overcoming regional challenges like logistics, payment methods, and infrastructure to improve their profitability and gain a competitive edge.
In the Middle East and Africa, e-commerce businesses report an average profit margin of 15% (Statista).
Given the lower average profit margin in the Middle East and Africa, brands should prioritize understanding the unique characteristics of local markets, addressing logistics challenges, and adopting localized payment solutions to enhance their profitability.
The average profit margin for e-commerce businesses in the fashion industry is 20-30%, while for electronics, it’s around 10-15% (McKinsey).
The significant variance in profit margins across industries emphasizes the importance of adapting strategies to the specific industry. Brands should focus on industry-specific marketing, sourcing, and pricing strategies to optimize their profit margins and stay competitive in their respective markets.
Discounts and promotion trends and statistics for e-commerce
(Section heading only in the original guide.)
E-commerce businesses offered an average discount of 23% on products during the holiday season in 2020 (Adobe Digital Insights).
The prevalence of holiday discounts emphasizes the importance of offering seasonal promotions to stay competitive. Brands should strategize their promotional campaigns and optimize pricing to attract customers without sacrificing profitability during peak shopping periods.
Flash sales can increase e-commerce revenues by up to 35% (BigCommerce).
Flash sales can drive significant revenue growth for e-commerce businesses. Brands should consider incorporating time-sensitive discounts and limited-time offers into their promotional strategy to create urgency, attract new customers, and encourage impulse purchases.
In 2020, over 62% of e-commerce marketers used email marketing to promote discounts and sales (Statista).
The widespread use of email marketing for promotions underlines its effectiveness in reaching customers. Brands should build and maintain a strong email list to engage their audience, share exclusive discounts, and nurture customer relationships.
Approximately 30% of abandoned shopping carts can be recovered with targeted discount offers (Baymard Institute).
Targeted discount offers can be a powerful tool in combating cart abandonment. Brands should consider implementing personalized discounts and timely follow-up emails to encourage customers to complete their purchases and improve conversion rates.
In 2020, free shipping was the most popular online shopping promotion, with 74% of consumers ranking it as the most important promotion (National Retail Federation).
Free shipping is a significant driver of online sales. Brands should evaluate their shipping strategies and costs to offer free shipping whenever possible, making their products more appealing and potentially increasing conversion rates.
Customer reviews trends and statistics for e-commerce
(Section heading only in the original guide.)
Approximately 91% of consumers aged 18-34 trust online reviews as much as personal recommendations (BrightLocal).
The trust young consumers place in online reviews highlights their significance in driving sales. Brands should prioritize encouraging satisfied customers to leave reviews and address negative feedback to maintain a positive online reputation.
A single negative review can drive away 22% of potential customers, while three negative reviews can increase that number to 59% (ReviewTrackers).
The impact of negative reviews on consumer behavior underlines the importance of addressing customer concerns. Brands should actively monitor and respond to negative feedback, working to resolve issues and demonstrate their commitment to customer satisfaction.
Displaying reviews on an e-commerce site can increase conversion rates by up to 270% (Spiegel Research Center).
The potential increase in conversion rates from displaying reviews highlights their power in influencing customer decisions. Brands should prominently display reviews on their website to foster trust and encourage potential buyers to complete their purchases.
72% of customers won’t take action until they’ve read reviews (Testimonial Engine).
The reliance of customers on reviews before making a purchase decision emphasizes their critical role in e-commerce. Brands should focus on building a strong base of positive reviews by offering exceptional products and customer service to increase the likelihood of converting prospective customers.
Content marketing for e-Commerce businesses: Statistics and trends
(Section heading only in the original guide.)
E-commerce companies that use content marketing experience six times higher conversion rates than those that don’t (Aberdeen Group).
The significant impact of content marketing on conversion rates highlights its importance in e-commerce success. Brands should create compelling, customer-centric content to educate, entertain, and engage their audience, ultimately leading to higher conversions.
60% of consumers feel more positive about a brand after consuming content from it (Content Marketing Institute).
The positive influence of content on consumer perception emphasizes its role in building brand loyalty. Brands should focus on delivering valuable, relevant content that showcases their expertise and fosters positive associations with their brand.
81% of online shoppers conduct research before making a purchase, and e-commerce businesses that provide valuable content can increase the likelihood of being discovered during this research process (GE Capital Retail Bank).
The importance of research in the buyer’s journey highlights the need for e-commerce businesses to invest in content marketing. Brands should create informative, relevant content to help potential customers during their research, positioning themselves as a trusted resource and increasing the likelihood of a purchase.
Product page content can increase e-commerce conversion rates by up to 20% when it includes detailed product descriptions, images, and videos (BigCommerce).
The impact of product page content on conversion rates emphasizes its significance for e-commerce businesses. Brands should focus on creating comprehensive, engaging product pages with high-quality images, videos, and in-depth descriptions to help customers make informed decisions and drive conversions
74% of companies indicate that content marketing increased their e-commerce marketing leads, both in quality and quantity (Curata).
The increase in e-commerce marketing leads due to content marketing underlines its effectiveness as a strategy for online businesses. Brands should develop a content marketing plan that attracts and engages their target audience, ultimately increasing lead generation and contributing to business growth.
Customer experience in e-Commerce: Statistics and trends
(Section heading only in the original guide.)
86% of buyers are willing to pay more for a great customer experience (SuperOffice).
The importance of customer experience in purchasing decisions underscores its value in e-commerce. Brands should prioritize delivering exceptional customer experiences by streamlining the buying process, providing excellent support, and personalizing interactions to increase customer satisfaction and drive sales.
A moderate increase in customer experience generates an average revenue increase of $823 million over three years for a company with $1 billion in annual revenues (Temkin Group).
The revenue growth potential of improved customer experience highlights its significance for e-commerce businesses. Brands should invest in optimizing their customer experience, focusing on areas like website usability, customer support, and personalization to maximize returns.
89% of companies compete primarily on the basis of customer experience, up from 36% in 2010 (Gartner).
The increasing emphasis on customer experience as a competitive differentiator demonstrates its importance in the e-commerce landscape. Brands should continually assess and improve their customer experience to stay ahead of the competition and maintain customer loyalty.
By 2023, it is predicted that 60% of companies with digital commerce will have incorporated AI to support customer experience (Gartner).
The growing adoption of AI in e-commerce customer experience indicates its potential to revolutionize the industry. Brands should explore AI-powered solutions, such as chatbots and personalized recommendations, to enhance customer experience and capitalize on this emerging trend.
Conclusion
In conclusion, the numerous statistics outlined above reveal the multifaceted nature of the e-commerce landscape and the many factors that contribute to its growth and success. From the rapid adoption of mobile commerce and the impact of social media platforms to the significance of localization, content marketing, and customer experience, it’s clear that businesses must adopt a holistic approach to stay competitive in the e-commerce industry.
A thorough understanding of these statistics can help businesses develop targeted marketing strategies that resonate with their audience, ultimately generating more leads, revenue, and profits. For instance, by investing in mobile optimization and capitalizing on the power of social media, businesses can reach a larger audience and drive traffic to their websites. Likewise, localization efforts and engaging content marketing can help businesses connect with customers on a deeper level and influence their purchasing decisions.
Moreover, a focus on providing an exceptional customer experience can set a business apart from its competitors, increasing customer loyalty and willingness to pay for products and services. Implementing AI-powered solutions can further enhance customer experience and streamline the buying process. Lastly, optimizing product pages with comprehensive descriptions, images, and videos can lead to higher conversion rates.
By paying attention to these trends and adapting accordingly, e-commerce businesses can navigate the ever-changing online landscape, boost their performance, and ensure long-term success in the competitive world of e-commerce. For more marketing statistics, check out our video marketing statistics, B2B marketing statistics article, TikTok statistics article, and LinkedIn marketing statistics article.
Ecommerce statistics: frequently asked questions
How big is the ecommerce market in 2026?
The most complete official figure is UNCTAD's: businesses in 43 economies sold almost $27 trillion online in 2022, business and consumer sales combined, and most of it was B2B. For the US, the Census Bureau puts retail ecommerce at $340.2 billion in the second quarter of 2026, about $1.3 trillion over the four quarters to June 2026. Global online retail figures for 2026 are forecasts from private research firms, not measurements.
What percentage of US retail sales are online?
17.1% in the second quarter of 2026, seasonally adjusted, up from 16.3% a year earlier (US Census Bureau, 18 August 2026). In the holiday quarter, before seasonal adjustment, the share peaks: 18.3% in October to December 2025.
What percentage of UK retail sales are online?
28.8% of retail sales in Great Britain were made online in September 2026, down from 28.9% in August (ONS, 23 October 2026). That is one of the highest online shares of any large economy.
What is the average cart abandonment rate?
70.22%, the average of 50 studies compiled by Baymard Institute, last updated 28 October 2026. Among US shoppers who abandon during checkout, the most common reason is extra costs such as shipping, taxes and fees (40%), followed by slow delivery (20%) and not trusting the site with card details (19%).
What share of ecommerce is on mobile?
In the US, 56.4% of online spending in the 2025 holiday season happened on smartphones, up from 54.5% in 2024, and 66.5% on Christmas Day (Adobe). There is no official government figure for mobile's share. The often-quoted forecast that 72.9% of ecommerce would be mobile by 2023 did not come true in the US.
How big is B2B ecommerce compared with B2C?
Much bigger. In the US in 2022, manufacturers shipped $4.83 trillion of goods through ecommerce and merchant wholesalers sold $3.76 trillion online, together about 76% of US ecommerce, against $997.5 billion for retail (US Census Bureau E-Stats). Globally, UNCTAD estimated B2B was 82% of ecommerce in 2019.
Do B2B buyers prefer to buy online?
Increasingly, yes. In Gartner's 2025 survey of 646 B2B buyers, 67% said they prefer a rep-free buying experience, up from 61% a year earlier, and 45% had used AI tools in a recent purchase. McKinsey's 2024 B2B Pulse found buyers use about ten channels per purchase and split roughly evenly between preferring in-person, remote and self-serve at each stage.
How much of online shopping comes from social media?
Less than often claimed. Adobe measured social media referrals at 4.6% of US online holiday revenue in 2025, up 40.3% on 2024. Affiliates and partners, which include influencers, drove 20.4%. Figures such as "24%" or "35% of ecommerce happens on social media" have no traceable primary source.
What is Amazon's revenue?
Amazon's net sales were $716.9 billion in 2025, up 12%, and $201.9 billion in the July to September 2026 quarter, up 12% (Amazon). Those totals include AWS, advertising and subscriptions. Amazon Business, its B2B marketplace, passed $60 billion in annualised gross sales in the second quarter of 2026.
Is it true that websites with localized content are 2.67 times more likely to generate sales?
We could not find a source for it. It is usually credited to Common Sense Advisory (now CSA Research), but it does not appear in CSA's published findings. CSA's 2020 study of 8,709 consumers found 76% prefer to buy products with information in their own language and 40% never buy from sites in other languages; quote those instead.
What happened to The B2B House ecommerce statistics page?
The B2B House is now part of Kiin. Its ecommerce statistics are on this page, with every figure it published kept in the section "Figures previously published by The B2B House", next to the 2026 figure and its source.
How we built this page, and every source
We started from every statistic in The B2B House guide and every claim that other sites link to it for (we checked its backlinks one by one using Ahrefs). For each, we looked for the newest figure from the original publisher first: national statistics offices (US Census Bureau, ONS, Eurostat, NBS China), UNCTAD, company earnings releases, and the research organisations that originally ran each study (Baymard, Spiegel Research Center, CSA Research, Epsilon, BrightLocal, Adobe, Gartner, McKinsey). We opened each source page or document on 14 November 2026 and copied the figure from it. Where a source page blocked automated access (Gartner, McKinsey, WordStream), we confirmed the figure through the source's indexed text and named trade coverage, and say so. Where there is no update we say so and keep the old figure with its date. Calculations marked "our calculation" are simple sums or ratios of published figures. Kiin's own advertising figures come from the Kiin Labs panel, described in our method note. Corrections: [email protected].
- US Census Bureau, Quarterly Retail E-Commerce Sales, 2nd Quarter 2026 (CB26-133), 18 Aug 2026
- US Census Bureau, E-Commerce Activity Across Sectors: 2021 and 2022 (2022 E-Stats), 25 Mar 2025
- US Census Bureau, E-Stats 2022: Measuring the Electronic Economy
- US Census Bureau, E-Stats 2019 release, 5 Aug 2021
- UNCTAD, Business e-commerce sales and the role of online platforms, 13 Jun 2024
- UNCTAD, Global e-commerce jumps to $26.7 trillion, 3 May 2021
- National Bureau of Statistics of China, Total Retail Sales of Consumer Goods, January to September 2026
- ONS, Retail sales, Great Britain: September 2026, 23 Oct 2026
- ONS, Digital Economy Survey: 2021, 20 Apr 2023
- ONS, E-commerce and ICT activity, UK: 2019, 5 Feb 2021
- Eurostat, E-commerce statistics for individuals (data extracted Feb 2026)
- Adobe, Holiday Shopping Season Drove a Record $257.8 Billion Online, 7 Jan 2026
- Adobe, Cyber Monday Hits Record $14.25 Billion, Dec 2025
- Adobe, 2025 holiday shopping season release (PDF), 7 Jan 2026
- Baymard Institute, Cart Abandonment Rate statistics, updated 28 Oct 2026
- Think with Google, mobile site load time statistics (2016 study)
- Amazon, Q4 2025 and full-year results
- Amazon, Q3 2026 results, 29 Oct 2026
- Amazon, What is Amazon Business (updated 21 Jul 2026)
- Shopify investor relations and PPC Land, Shopify Q3 2026 results, 3 Nov 2026
- Walmart, Q2 FY27 earnings, 20 Aug 2026
- eBay, Third Quarter 2026 Results, 28 Oct 2026
- Value Added Resource, Etsy Q3 2026 earnings
- Gartner, 61% of B2B Buyers Prefer a Rep-Free Buying Experience, 25 Jun 2025
- Gartner, 69% of B2B Buyers Turn to Sales Reps to Validate AI-Generated Insights, 20 May 2026
- Digital Commerce 360, Gartner: B2B buyers and rep-free purchasing, 17 Mar 2026
- McKinsey, Five fundamental truths: How B2B winners keep growing (B2B Pulse 2024)
- Digital Commerce 360, More B2B buyers willing to spend big per online order, 12 Sep 2024
- BrightLocal, Local Consumer Review Survey 2026, 11 Feb 2026
- Spiegel Research Center, How Online Reviews Influence Sales (2017)
- CSA Research, Consumers Prefer their Own Language, 7 Jul 2020
- Epsilon, 80% of consumers more likely to purchase with personalised experiences, 9 Jan 2018
- Aswath Damodaran, NYU Stern, Margins by Sector (US), January 2026
- Kiin Labs, LinkedIn Ads Benchmarks 2026, 150 LinkedIn Ads Statistics and Report No. 4, cost per demo
Ilic, P. (2026). Ecommerce Statistics 2026: Sales, Mobile, Cart Abandonment and B2B. Kiin Labs (incorporating The B2B House). kiin.co/research/ecommerce-statistics. Free to cite with a link.
Your buyers are researching online. Are your ads there? Send read access to your LinkedIn, Google or Meta ad accounts and we'll show you where you sit against 1,000+ connected accounts, content and demo, on every metric. Free, read-only, one page.
How much do social media and AI drive online sales?
Social media drove 4.6% of US online holiday revenue in 2025, up 40.3% on 2024. That is Adobe's measurement of revenue from visits that arrived from social platforms, published January 2026. On Cyber Monday alone the share was 3.6%, up from 2.3% the year before (Adobe, January 2026; Adobe, December 2025). That is far below the "24% of ecommerce sales are generated through social media" and "35% of all ecommerce transactions were made through social media" claims The B2B House carried. Neither has a traceable primary source, and both are inconsistent with every measured figure we can find.
The bigger channel is affiliates and partners, which include influencers: 20.4% of holiday online revenue, up 15.9% (Adobe). Much of what people call "social commerce" shows up here: a creator posts, the follower clicks a tracked link, and the sale is credited to the affiliate rather than to the social platform. If you add social referrals and affiliate revenue together, about a quarter of US holiday online revenue came through people and posts rather than search, email or direct visits.
Generative AI is the fastest-growing source of shopping traffic, from a small base. Adobe measured traffic from generative AI tools to US retail sites up 693.4% in the 2025 holiday season, and 670% on Cyber Monday (Adobe). Adobe also notes the base is still modest. Shopify said orders coming from AI searches grew 3.3 times year on year in its July to September 2026 quarter, without giving the base (Shopify Q3 2026 results, as reported by PPC Land). And in BrightLocal's 2026 survey of US consumers, 45% had used ChatGPT or another AI tool to find a local business, up from 6% a year earlier (BrightLocal, February 2026).
Sources: Adobe Analytics (2 December 2025, 7 January 2026); Shopify Q3 2026 results (3 November 2026) as reported by PPC Land; BrightLocal Local Consumer Review Survey 2026 (11 February 2026, 1,002 US adults).
What about platform-specific claims like "Pinterest ads drive 2.3x more conversions", "shoppable Instagram posts get 89% more engagement" or "Instagram Checkout users are 70% more likely to buy"? We could not trace any of these to a current primary source. Several came from vendor blog posts that no longer exist. They are listed in stats we no longer recommend.
Cite: "Social media drove 4.6% of US holiday online revenue in 2025 and affiliates including influencers 20.4%; traffic from generative AI tools rose 693.4% (Adobe)." Kiin Labs, kiin.co/research/ecommerce-statistics#social-ai