
Spending part of that budget on LinkedIn, Google or Meta to reach B2B buyers? I’ll benchmark your paid media against our $65M+ LinkedIn panel in a free 30-minute call. Book my free benchmark with Phil →
Ilic, P. (2026). Digital Ad Spend Statistics 2026: How Much Is Spent on Ads, and Where? Kiin Labs (incorporating The B2B House). https://kiin.co/research/digital-ad-spend-statistics
- The key digital ad spend statistics for 2026
- How much is spent on advertising worldwide?
- How much of all ad spend is digital?
- Where does the money go: social, search, retail media, TV?
- Which countries spend the most on advertising?
- How big is US digital advertising? (IAB/PwC)
- How much do Google, Meta, Amazon and Microsoft earn from ads?
- How much of the market do the biggest platforms take?
- How big is retail media?
- How much is spent on connected TV and streaming?
- How much do B2B companies spend on digital ads, and where?
- Figures previously published by The B2B House
Also: stats we no longer use · FAQ · every source
What are the key digital ad spend statistics for 2026?
If you only need one table, this is it. Every figure here was checked on the page it comes from on 14 November 2026. The sections below give the detail, the trend and the caveats.
| Statistic | Figure | As of | Source |
|---|---|---|---|
| Global ad spend, 2026 forecast | $1.34 trillion (+11.9%) | Oct 2026 | WARC Q3 2026 |
| Global ad revenue, 2026 forecast (excl. US political) | $1.3 trillion (+8.9%) | Jun 2026 | WPP Media |
| Global ad spend, 2027 forecast | $1.46 trillion (+8.4%) | Oct 2026 | WARC |
| Digital share of global ad spend, 2026 | 68.7% | Dec 2025 | dentsu |
| Social media ad spend worldwide, 2026 | $394.6 billion (+21.3%) | Oct 2026 | WARC |
| Search ad spend worldwide, 2026 | $295.7 billion (+14.2%) | Oct 2026 | WARC via PPC Land |
| Retail media worldwide, 2026 | $202.1 billion (+14.3%) | Oct 2026 | WARC via PPC Land |
| US internet ad revenue, 2025 | $294.6 billion (+13.9%) | Apr 2026 | IAB/PwC |
| US ad spend growth, 2026 forecast | +12.3% | Sep 2026 | IAB Outlook |
| Google advertising revenue, 2025 | $294.7 billion (+11.4%) | FY2025 | Alphabet 10-K |
| Meta advertising revenue, 2025 | $196.2 billion (+22.1%) | FY2025 | Meta |
| Amazon advertising revenue, 2025 | $68.6 billion (+22.1%) | FY2025 | Amazon 10-K |
| Alphabet, Amazon and Meta share of global ad spend outside China | 59.7% ($659.6 billion) | 2026 | WARC via The Desk |
| US connected TV ad spend, 2026 | $29.3 billion | May 2026 | IAB via MarTech |
| LinkedIn's share of B2B ad budgets | 41% | 2025 data | Dreamdata 2026 |
| LinkedIn Marketing Solutions revenue growth | +16% year on year | Apr to Jun 2026 | |
| Median LinkedIn CPM (feed ads) | $36.23 | Sep 2025 to Sep 2026 | Kiin panel |
Cite: "Global ad spend is forecast to reach $1.34 trillion in 2026, up 11.9% (WARC), and US internet ad revenue was $294.6 billion in 2025 (IAB/PwC)." Kiin Labs, kiin.co/research/digital-ad-spend-statistics#key-statistics
How much is spent on advertising worldwide in 2026?
Global advertising spend is forecast to reach $1.34 trillion in 2026, up 11.9% on 2025, according to WARC's October 2026 forecast. That is the newest of the major forecasts and the most bullish. WARC says it follows growth of 10.0% in both 2024 and 2025, and expects growth to slow to 8.4% in 2027 ($1.46 trillion) and 7.9% in 2028 ($1.57 trillion) (WARC Media, Global Ad Spend Outlook Q3 2026).
WPP Media, the agency group formerly known as GroupM, published its midyear "This Year Next Year" forecast on 16 June 2026. It expects global ad revenue, excluding US political advertising, to grow 8.9% to $1.3 trillion in 2026, up from the 7.1% it forecast in December 2025, and says ad revenue has reached its highest share of GDP since 1999 (WPP Media, 16 June 2026). Both forecasters credit the same thing: the AI investment cycle, which is lifting the big platforms' ad products and the companies that advertise on them.
| Forecaster | Published | 2025 | 2026 | 2027 |
|---|---|---|---|---|
| WARC Media (Q3 update) | Oct 2026 | +10.0% | $1.34T, +11.9% | $1.46T, +8.4% |
| WPP Media, This Year Next Year (midyear) | 16 Jun 2026 | passed $1T, +5.8% | $1.3T, +8.9% | |
| WARC Media (Q4 2025 update) | 11 Dec 2025 | $1.19T, +8.9% | $1.30T, +9.1% | $1.40T, +7.9% |
| dentsu, Global Ad Spend Forecasts | 3 Dec 2025 | passes $1T, +5.1% | ||
| Magna (IPG Mediabrands), summer update | 16 Jun 2025 | $979B, +4.9% | passes $1T, +6.3% |
Sources: WARC Q3 2026; WPP Media midyear 2026 (2025 growth of 5.8% as reported by Mi3); WARC, 11 Dec 2025; dentsu, 3 Dec 2025; Magna via Marketing Dive, 17 Jun 2025.
Why do totals for the same year range from about $1.0 trillion to $1.34 trillion? Definitions. WARC counts more retail media and more spend by small advertisers on marketplaces. Magna and dentsu counted "media owner" revenue more narrowly. WPP Media excludes US political ads. And each revises its history as companies report, so a 2025 figure published in mid-2025 is not comparable with one published in late 2026. The safe reading is the direction, which every forecaster agrees on: the global ad market passed $1 trillion in 2025 or 2026 and is growing faster than the world economy.
A note on Magna. Magna was IPG Mediabrands' forecasting unit and the benchmark many analysts used, including the analysts The B2B House quoted. Its June 2025 update put 2025 media-owner revenue at $979 billion and forecast 6.3% growth in 2026. We could not find a Magna global forecast published after December 2025, and its forecast pages are no longer online, so we use WARC and WPP Media as the current references and keep Magna's last published figures with their dates.
Cite: "Global ad spend is forecast to grow 11.9% to $1.34 trillion in 2026 and 8.4% to $1.46 trillion in 2027 (WARC, October 2026)." Kiin Labs, kiin.co/research/digital-ad-spend-statistics#global-ad-spend
Where does the money go: social, search, retail media or TV?
Social media is now the largest advertising channel in the world: WARC forecasts $394.6 billion of social ad spend in 2026, up 21.3%, against $295.7 billion for search, $202.1 billion for retail media and $176.2 billion for TV. Social alone is 29.4% of all ad spend. WARC expects it to pass $500 billion in 2028. Its full channel table, published with the October 2026 forecast, is below.
| Channel (WARC definition) | 2026 spend | 2026 growth | 2027 growth |
|---|---|---|---|
| Social media | $394.6B | +21.3% | +14.6% |
| Search | $295.7B | +14.2% | +8.8% |
| Video (all) | $231.4B | +2.9% | +0.7% |
| of which TV | $176.2B | +1.2% | −1.8% |
| of which online video | $55.2B | +8.8% | +8.8% |
| Retail media | $202.1B | +14.3% | +10.8% |
| Out of home | $63.3B | +8.1% | +6.3% |
| Publishing (news and magazine brands) | $44.4B | −2.4% | −0.9% |
| Audio (radio and online audio) | $41.9B | +2.5% | +1.2% |
| Online display | $35.5B | −2.5% | −1.5% |
| Online classified | $31.1B | +4.1% | +5.2% |
| Cinema | $3.0B | +6.0% | +5.4% |
| Total | $1,343.0B | +11.9% | +8.4% |
Source: WARC Media, Global Ad Spend Forecast Q3 2026, October 2026, channel table as published by PPC Land; headline figures confirmed on WARC. Also from the same forecast: video on demand +15.1% to $48.4B and digital out of home +13.7% to $21.7B (The Desk).
Three things stand out. First, social, search and retail media take 66.4% of everything, and on PPC Land's working from WARC's table they account for roughly nine in ten of the new dollars added in 2026. Second, retail media is now bigger than TV in WARC's numbers, $202.1 billion against $176.2 billion. Third, open-web display is shrinking, down 2.5%, as budgets move into walled platforms that can tie an ad to a sale.
WPP Media's channel view
WPP Media cuts the market differently but tells the same story. It forecasts social at $465.2 billion in 2026, up 12.8%, or 37.2% of all advertising, slowing to 8.4% in 2027 and single digits after that. It puts traditional search at $267.2 billion, up 8.4%, and says traditional plus generative search will be 21.8% of total ad revenue in 2026 (Mi3; WPP Media). WPP's social figure is larger than WARC's because the two group formats such as short video and creator content differently.
| Channel (WPP Media definition) | 2026 | Growth |
|---|---|---|
| Social | $465.2B (37.2% of total) | +12.8%; +8.4% in 2027 |
| Traditional search | $267.2B | +8.4% |
| Generative (AI) search | $5.1B, 1.9% of search | forecast $32B in 2028, $100B+ by 2030 |
| Commerce (about 97% retail media) | $199.6B | +9.3% to $218.2B in 2027 |
| Streaming TV | $53.8B | +17.2% |
| Content-driven advertising (all) | $720.2B | +8.2% |
Sources: WPP Media, 16 June 2026 (generative search, content-driven); channel detail as reported by Mi3 and MediaCat. The full WPP Media report is available to WPP clients only.
AI search: the newest ad channel
The newest line in any forecast is advertising inside AI answers. WPP Media expects generative search to earn $5.1 billion in 2026 and to exceed $100 billion by 2030, which would make it the fastest channel ever to reach that size (WPP Media). Mi3, reporting the same forecast, adds that this is 1.9% of the search category in 2026 and 39.2% by 2030, and quotes WPP's warning that a meaningful share of searches now end in zero-click answers. Google's own results show the shift has not hurt its search ad revenue yet: Search and other advertising grew 12% in July to September 2026 (section 07).
Cite: "Social media is the largest ad channel: $394.6 billion in 2026, up 21.3%, ahead of search ($295.7 billion) and retail media ($202.1 billion) (WARC, October 2026)." Kiin Labs, kiin.co/research/digital-ad-spend-statistics#channels
Which countries spend the most on advertising?
The United States is by far the largest ad market, worth $421.1 billion in 2025 and 35.3% of the world total, followed by China ($200.1 billion, 16.8%) and the UK ($58.1 billion). Those are WARC's figures from December 2025, the latest country-level numbers WARC has published openly (WARC, 11 December 2025). The ten largest markets account for 70.4% of global ad spend.
| Market | Ad spend 2025 | Growth 2025 | Growth 2026 (forecast) |
|---|---|---|---|
| United States | $421.1B (35.3% of world) | +8.9% | +7.0% (WARC Dec 2025); +11.9% (WPP Media Jun 2026) |
| China | $200.1B (16.8%) | +6.9% | +8.9% |
| United Kingdom | $58.1B | +9.3% | +8.5% |
| Japan | $39.0B | +4.6% | |
| Germany | $34.4B | +9.3% | +8.3% |
| France | $21.9B | +8.9% | +7.2% |
| Canada | $17.9B | +2.3% | +4.6% |
| India | $13.8B | +4.6% | +8.0% |
| Italy | $12.4B | +7.4% | +6.8% |
| Spain | $10.7B | +9.8% | +8.7% |
| Mexico | $7.5B | −8.8% | +6.6% |
| Brazil | +10.7% |
Source: WARC Global Ad Forecast, Q4 2025 update, 11 Dec 2025. These are total ad spend (all media), not digital only. US 2026 growth from WPP Media: WPP Media midyear 2026.
The US forecast has been raised more than any other in 2026. WPP Media moved its US growth forecast from 7.4% to 11.9% in June, and the IAB raised its own US forecast to 12.3% in September (section 06). The reason is the same AI investment cycle: US technology companies are both the biggest ad sellers and, increasingly, among the biggest buyers.
The fastest-growing markets
The B2B House's 2023 tables showed Latin America and India leading digital growth. That is still broadly true for total ad spend in 2026. dentsu's December 2025 forecast has Brazil growing fastest among major markets at 9.1%, then India at 8.6%, China 6.1%, the UK 5.7%, Canada 5.4% and the US 5.0%, with Asia Pacific (5.4%) the fastest region and the Americas reaching $460.5 billion (dentsu). WARC also has Brazil among the fastest, at 10.7% in 2026, helped by the FIFA World Cup being broadcast in a favourable time zone.
| Market or region | 2026 ad spend growth (dentsu) |
|---|---|
| Brazil | 9.1% |
| India | 8.6% |
| China | 6.1% |
| United Kingdom | 5.7% |
| Canada | 5.4% |
| United States | 5.0% |
| Asia Pacific (region) | 5.4% |
| Americas (region) | 5.2%, to $460.5B |
| EMEA (region) | 4.2% |
Source: dentsu Global Ad Spend Forecasts, 3 Dec 2025. dentsu's growth rates are lower than WARC's for the same markets because it measures a narrower market and published earlier.
Two points from the old guide no longer hold. China, which The B2B House described as stalling at 3.7% growth in 2022, is forecast by WARC to grow 8.9% in 2026. And the UK, which the old guide showed shrinking 4.9% in US dollars in 2022 because of a weak pound, has been the world's third-largest ad market since overtaking Japan in 2022, and grew 9.3% in 2025 (WARC). In Europe overall, WPP Media forecasts 6.9% growth in 2026, behind the US.
Cite: "The US ad market was $421.1 billion in 2025, 35.3% of the world total; China was $200.1 billion and the UK $58.1 billion (WARC, December 2025)." Kiin Labs, kiin.co/research/digital-ad-spend-statistics#countries
How big is US digital advertising? (IAB/PwC 2026)
US internet advertising revenue reached a record $294.6 billion in 2025, up 13.9% from $258.6 billion in 2024. That is from the 30th IAB/PwC Internet Advertising Revenue Report, published on 16 April 2026 (IAB, April 2026). Unlike the global forecasts above, this is measured revenue: PwC surveys the companies that sell digital ads in the US and adds up what they actually took in.
The headline inside the report: social media overtook search. Social ad revenue grew 32.6% to $117.7 billion, while search, including AI search, grew 11% to $114.2 billion. A year earlier search was $102.9 billion and social $88.8 billion.
| US internet ad revenue, by format | 2025 | Growth | Share of total | 2024 |
|---|---|---|---|---|
| Total | $294.6B | +13.9% | 100% | $258.6B (+14.9%) |
| Social media | $117.7B | +32.6% | 40.0% | $88.8B |
| Search (incl. AI search) | $114.2B | +11.0% | 38.8% | $102.9B |
| Display (banner and similar) | $81.6B | 27.7% | ||
| Digital video (incl. CTV, social video) | $78.0B | +25.4% | 26.5% | $62.1B |
| Commerce (retail) media | $63.4B | +18.0% | 21.5% | $53.7B |
| Podcast | $2.9B | 1.0% | $2.43B | |
| Programmatic (a buying method across formats) | $162.4B | +20.5% | ||
| Creator advertising | $37B | forecast $44B in 2026 |
Sources: IAB/PwC Internet Advertising Revenue Report, Full Year 2025 (16 Apr 2026); 2024 column from IAB/PwC Full Year 2024 (17 Apr 2025). Formats overlap (a social video ad counts in social and in video; commerce media spans search and display), so shares add up to more than 100%.
Search's slowdown, from 15.9% growth in 2024 to 11% in 2025, is the change to watch. Search is still growing faster than the economy, but social, video and commerce media all grew faster. Video's growth accelerated from 19.2% to 25.4%, helped by connected TV and short-form video.
US ad spend outlook for 2026
The IAB's September 2026 survey of more than 200 brand and agency decision makers raised its forecast for total US ad spend growth in 2026 to 12.3%, from 9.5% in January (IAB, 10 September 2026). Social media and CTV are again expected to grow fastest; linear TV is the only channel expected to shrink.
| US channel | 2026 growth (Sep forecast) | January forecast |
|---|---|---|
| Total US ad spend | +12.3% | +9.5% |
| Social media | +16.5% | +14.6% |
| Connected TV (CTV) | +15.6% | +13.8% |
| Commerce media | +13.6% | +12.1% |
| Digital video excl. CTV | +9.4% | +9.6% |
| Podcasts | +8.7% | +8.6% |
| Paid search | +8.1% | +8.2% |
| Digital out of home | +7.0% | +7.4% |
| Linear TV | −1.5% | −1.7% |
Source: IAB 2026 Outlook Study, September update, 200+ US brand and agency ad investment decision makers.
The B2B House's guide quoted a forecast of $278.59 billion of US digital ad spending in 2023, rising to $347.88 billion in 2025. The IAB measured $294.6 billion for 2025. The two are not like for like (the old figure was an eMarketer forecast with its own definitions), but the comparison is a useful reminder: use measured revenue for any year that has already happened, and forecasts only for the future.
Cite: "US internet ad revenue was $294.6 billion in 2025, up 13.9%; social media ($117.7 billion) overtook search ($114.2 billion) (IAB/PwC, April 2026)." Kiin Labs, kiin.co/research/digital-ad-spend-statistics#us-digital
How much do Google, Meta, Amazon and Microsoft earn from advertising?
Google earned $294.7 billion from advertising in 2025, Meta $196.2 billion and Amazon $68.6 billion. Together that is $559.5 billion of ad revenue from three companies in one year. These are reported figures from each company's annual results, not estimates, so they are the most reliable numbers on this page.
| Company: advertising revenue | 2025 | 2024 | Growth | Source |
|---|---|---|---|---|
| Google (Alphabet), total advertising | $294.7B | $264.6B | +11.4% | Alphabet 10-K 2025 |
| Google Search & other | $224.5B | $198.1B | +13.4% | Alphabet 10-K |
| YouTube ads | $40.4B | $36.1B | +11.7% | Alphabet 10-K |
| Google Network | $29.8B | $30.4B | −1.9% | Alphabet 10-K |
| Meta (Facebook, Instagram, WhatsApp, Threads) | $196.2B | $160.6B | +22.1% | Meta Q4 2025 |
| Amazon, advertising services | $68.6B | $56.2B | +22.1% | Amazon 10-K 2025 |
| Microsoft, search advertising (Bing, Copilot, Edge, News) | $15.2B (FY to Jun 2026) | $13.9B | +9% (+12% ex TAC) | Microsoft 10-K 2026 |
| LinkedIn, total revenue (ads, Premium, hiring) | $19.8B (FY to Jun 2026) | $17.8B | +11% | Microsoft 10-K 2026 |
Amazon's advertising revenue was $46.9B in 2023, so it has grown by almost half in two years. Microsoft's fiscal year ends 30 June. "Ex TAC" means excluding traffic acquisition costs, the payments Microsoft makes to partners that send it searches. Microsoft and LinkedIn do not publish LinkedIn's advertising revenue on its own.
The latest quarter: July to September 2026
The most recent results, for the quarter ended 30 September 2026, show Meta growing more than twice as fast as Google, and Amazon slowing for a calendar reason.
| Ad revenue, Q3 2026 (Jul to Sep) | Q3 2026 | Q3 2025 | Growth | Source |
|---|---|---|---|---|
| Google advertising, total | $82.0B | $74.2B | +10.6% | Alphabet, 28 Oct 2026 |
| Google Search & other | $63.4B | $56.6B | +12.0% | Alphabet |
| YouTube ads | $11.2B | $10.3B | +9.2% | Alphabet |
| Google Network | $7.5B | $7.4B | +1.4% | Alphabet |
| Meta advertising | $63.1B | $50.1B | +25.9% | Meta, 21 Oct 2026 |
| Amazon advertising services | $19.6B | $17.7B | +11% (+12% ex FX) | Amazon, 29 Oct 2026 |
| Microsoft search and advertising (new definition) | $6.6B | $5.9B | +10% (+12% ex TAC) | Microsoft, 28 Oct 2026 |
| Reddit, total revenue (mostly ads) | $895M | +53% | ||
| Snap, total revenue | $1.72B | $1.51B | +14% | Snap |
| Pinterest, total revenue | $1.17B | $1.05B | +12% |
All figures as reported by each company for the three months ended 30 September 2026. Microsoft reorganised its reporting from fiscal 2027; trade coverage reports the new "search and advertising" line now includes LinkedIn's ad revenue (PPC Land), so it is not comparable with the old search line.
Meta's growth comes from price as much as volume. In July to September 2026 the number of ads Meta showed rose 10%, and the average price per ad rose 14% (Meta). Across 2025 impressions rose 12% and price per ad 9%. Meanwhile Meta's daily audience grew 3% to 3.64 billion people. In other words, advertisers are paying noticeably more for each Meta ad than a year ago. For B2B advertisers that is the context for any comparison of Meta's cost with LinkedIn's.
Amazon's slowdown is about the calendar. Amazon moved Prime Day into its second quarter in 2026, which pulled ad revenue out of the third; it says the quarter was affected by timing anomalies primarily related to Prime Day and expects ad revenue to grow in the high teens in October to December 2026 (Amazon). Over the four quarters to September 2026, Amazon's advertising revenue was $78.0 billion (sum of the quarterly figures in its Q3 2026 release).
Google Search is still accelerating. Search and other advertising grew 12% in the quarter, faster than in 2025's full year, even as AI answers take more queries. YouTube ads grew 9.2%, and Google Network, the ads Google sells on other websites, barely grew, consistent with WARC's forecast of a shrinking open-web display market.
Cite: "In 2025 Google earned $294.7 billion from advertising, Meta $196.2 billion and Amazon $68.6 billion (company filings)." Kiin Labs, kiin.co/research/digital-ad-spend-statistics#platforms
How much of the ad market do the biggest platforms take?
Alphabet, Amazon and Meta are forecast to take 59.7% of global ad spend outside China in 2026, worth $659.6 billion, rising to 61.5% ($804.1 billion) by 2028. That is WARC's October 2026 estimate (WARC via The Desk). WPP Media's figure is almost the same: the top three sellers outside China hold 57.6% of the market (WPP Media, June 2026), and the five largest sellers worldwide, Google, Meta, ByteDance, Amazon and Alibaba, about 58% (MediaCat, reporting WPP Media).
| Concentration measure | Figure | Year | Source |
|---|---|---|---|
| Alphabet + Amazon + Meta, share of global ad spend excl. China | 59.7% ($659.6B) | 2026 | WARC, Oct 2026 |
| Same, forecast | 61.5% ($804.1B) | 2028 | WARC, Oct 2026 |
| Same, earlier estimate | 56.1% ($556.6B) | 2025 | WARC, Dec 2025 |
| Top three sellers outside China (Alphabet, Meta, Amazon) | 57.6% | 2026 | WPP Media |
| Top five sellers worldwide (incl. ByteDance, Alibaba) | about 58% | 2026 | WPP Media via MediaCat |
| TikTok ad revenue, forecast | $45.2B by 2027 | 2027 | WARC, Dec 2025 |
| TikTok US ad revenue | about $12B | 2025 | WARC, Dec 2025 |
The B2B House's 2023 guide argued that "the duopoly" of Google and Meta had peaked in 2021, when they briefly took more than half of global digital ad revenue, and that ByteDance, Amazon and Apple would erode it. That has not happened. Google and Meta together earned $490.9 billion from ads in 2025, and Meta's ad revenue grew 22% that year. What changed is that the duopoly became a triopoly: Amazon's ad business, $68.6 billion in 2025, makes Alphabet, Meta and Amazon the group forecasters now track together. WARC expects the three to absorb the vast majority of new global ad spend through 2027.
TikTok is the main challenger, but at WARC's forecast of $45.2 billion by 2027 it would be less than a fifth of Meta's expected ad revenue at that time.
Cite: "Alphabet, Amazon and Meta take 59.7% of global ad spend outside China in 2026, $659.6 billion (WARC, October 2026)." Kiin Labs, kiin.co/research/digital-ad-spend-statistics#concentration
How big is retail media in 2026?
Retail media, ads sold by retailers and marketplaces on their own sites and with their own shopper data, is forecast at $202.1 billion worldwide in 2026, up 14.3%, which makes it bigger than television. That is WARC's October 2026 figure; retail media is 15.0% of all ad spend (WARC via PPC Land). WPP Media's estimate is similar: global commerce advertising of $199.6 billion in 2026, about 97% of it retail media, growing 9.3% to $218.2 billion in 2027 (MediaCat, reporting WPP Media).
| Retail media statistic | Figure | Year | Source |
|---|---|---|---|
| Global retail media ad spend | $202.1B (+14.3%) | 2026 | WARC |
| Global retail media, 2027 growth | +10.8% | 2027 | WARC |
| Global commerce advertising | $199.6B; $218.2B in 2027 | 2026 | WPP Media |
| Retail media's share of global ad spend | 15.0% | 2026 | WARC |
| Retail media growth, fastest digital channel | +14.1% | 2026 | dentsu |
| Retail media networks, global sales | $163B | 2025 | Magna |
| Retailer search ads (sponsored product listings) | $140B (+12%) | 2025 | Magna |
| US commerce media revenue | $63.4B (+18.0%) | 2025 | IAB/PwC |
| US commerce media growth, forecast | +13.6% | 2026 | IAB |
| Amazon advertising revenue | $68.6B | 2025 | Amazon 10-K |
Amazon's $68.6 billion of 2025 ad revenue is equivalent to about a third of WARC's 2026 retail media total, so one company sets the pace for the whole channel. China is the world's largest retail media market by a wide margin, but WPP Media expects its growth to slow to 3% in 2026. For B2B marketers retail media matters mainly as a reason ad prices elsewhere keep rising: consumer brands' budgets are being pulled into retail media and social, and every auction they enter moves prices for everyone else.
Cite: "Retail media is forecast at $202.1 billion worldwide in 2026, up 14.3%, larger than TV at $176.2 billion (WARC, October 2026)." Kiin Labs, kiin.co/research/digital-ad-spend-statistics#retail-media
How much is spent on connected TV and streaming ads?
US connected TV (CTV) ad spend is projected at $29.3 billion in 2026, part of $81.9 billion of US digital video advertising, up 11%. Those are the IAB's 2026 Digital Video Ad Spend and Strategy figures (IAB, 5 May 2026; segment figures as reported by MarTech). For the first time, digital video will take more than 60% of all US TV and video ad spend.
| Connected TV and streaming statistic | Figure | Year | Source |
|---|---|---|---|
| US digital video ad spend | $81.9B (+11%) | 2026 | IAB via MarTech |
| US CTV ad spend | $29.3B | 2026 | IAB via MarTech |
| US social video ad spend | $31.9B | 2026 | IAB via MarTech |
| US CTV growth, updated forecast | +15.6% | 2026 | IAB, Sep 2026 |
| US linear TV ad spend growth | −1.5% | 2026 | IAB, Sep 2026 |
| Global streaming TV ad revenue | $53.8B (+17.2%) | 2026 | WPP Media via Mi3 |
| Global video on demand ad spend | $48.4B (+15.1%) | 2026 | WARC via The Desk |
| Global TV ad spend | $176.2B (+1.2%; −1.8% in 2027) | 2026 | WARC via PPC Land |
| YouTube ad revenue | $40.4B | 2025 | Alphabet 10-K |
| Premium long-form CTV, global | $23B of a $155B long-form video market | 2025 | Magna |
TV as a whole is flat: WARC has it up 1.2% in 2026, a year with the Olympics, the FIFA World Cup and US midterm elections, and down 1.8% in 2027 when none of those recur. The growth is in streaming. For B2B advertisers, CTV is still a brand channel rather than a demand channel. The video growth that matters more to B2B is on LinkedIn itself, where paid video revenue grew 25% year on year in July to September 2026 and creator-led ads grew 63% (LinkedIn).
Cite: "US connected TV ad spend is projected at $29.3 billion in 2026, within $81.9 billion of digital video (IAB)." Kiin Labs, kiin.co/research/digital-ad-spend-statistics#ctv
How much do B2B companies spend on digital ads, and where?
LinkedIn takes 41% of B2B companies' total ad budgets, up two points in a year, according to Dreamdata's 2026 benchmarks. Dreamdata, a B2B attribution company, measured this across its customers' 2025 data (more than 66 million sessions and 3.5 million customer journeys), and found budgets for non-branded search falling from 37% in 2024 to 33% in 2025 (Dreamdata, March 2026). The global figures above are dominated by consumer brands; B2B advertising follows a different pattern, with most of the money going to LinkedIn and Google, and a smaller share to Meta.
| B2B digital advertising statistic | Figure | Year | Source |
|---|---|---|---|
| LinkedIn's share of total B2B ad budgets | 41% (+2 points) | 2025 data | Dreamdata 2026 |
| Non-branded search share of B2B ad budgets | 33% (from 37%) | 2025 vs 2024 | Dreamdata 2026 |
| Return on ad spend: LinkedIn / Google Search / Meta | 121% / 67% / 51% | 2025 data | Dreamdata 2026 |
| Average time from first LinkedIn ad impression to revenue | 281 days | 2025 data | Dreamdata 2026 |
| LinkedIn Marketing Solutions revenue growth | +16% year on year, 7th straight double-digit quarter | Apr to Jun 2026 | |
| LinkedIn Marketing Solutions annual revenue | passed $5B for the first time | FY2022 | LinkedIn, Jul 2022 |
| LinkedIn paid video / creator-led ads growth | +25% / +63% year on year | Jul to Sep 2026 | |
| LinkedIn total revenue | $19.8B (+11%) | FY2026 | Microsoft 10-K |
| Median LinkedIn CPM, feed ads | $36.23 | Sep 2025 to Sep 2026 | Kiin panel |
| Median LinkedIn cost per lead, content offer | $164 | 2026 | Kiin Report No. 3 |
| Median LinkedIn cost per demo request lead (top quarter) | $350 ($161) | 2026 | Kiin Report No. 4 |
Dreamdata's figures describe its own customers, mostly B2B software companies, and its return on ad spend is multi-touch attributed revenue, an association rather than proof the ads caused the deals. Kiin figures: Kiin Labs panel of 1,000+ B2B advertiser accounts and $65M+ of LinkedIn ad spend, medians across accounts, USD.
LinkedIn does not publish its ad revenue. The last disclosed number is that LinkedIn Marketing Solutions passed $5 billion in annual revenue in Microsoft's fiscal 2022 (LinkedIn). LinkedIn says it has now grown at double digits for seven straight quarters, including 16% in April to June 2026, so it is a much larger business today, but any precise current figure you see is an estimate. The old B2B House guide's "LinkedIn ad revenues of $8.96 billion in 2024" was an eMarketer forecast, not a reported number.
What B2B advertisers actually pay on LinkedIn
If 41% of a B2B ad budget goes to LinkedIn, the useful question is what it buys. In the Kiin Labs panel (more than 1,000 B2B advertiser accounts and $65M+ of LinkedIn spend, September 2025 to September 2026) the median advertiser pays $36.23 per 1,000 impressions, $164 per content lead and $350 per demo request lead, with the best quarter of accounts paying $161 or less per demo request. Those are medians across accounts, not LinkedIn's own figures; LinkedIn does not publish average costs. The full breakdown by country, objective and format is in our LinkedIn Ads benchmarks, and the plain-English version of what a campaign costs is in how much LinkedIn ads cost in 2026.
That price is the reason B2B budgets are rarely all LinkedIn. LinkedIn is the only major platform where you can target by job title, seniority and company at scale, so it is where B2B advertisers build demand with the buying committee. Search is where they capture the demand that already exists; our Google Ads work for B2B SaaS concentrates on high-intent queries and is judged on pipeline, not form fills. Meta and Reddit are where they keep the same buyers warm for a fraction of LinkedIn's CPM; see our approach to Meta Ads for B2B and to Reddit Ads for technical buyers. Running all four from one plan is what our LinkedIn Ads agency does for sales-led B2B companies.
Two trends on this page matter most for B2B. First, Meta's average price per ad rose 14% in a year and the three largest platforms are absorbing most new ad dollars, so prices on the major platforms are rising; benchmark your own numbers rather than relying on last year's. Second, Dreamdata finds it takes 281 days on average from a first LinkedIn impression to revenue, so judge B2B ad spend on pipeline over quarters, not cost per lead over weeks.
Cite: "LinkedIn takes 41% of B2B ad budgets (Dreamdata 2026); the median LinkedIn advertiser pays $36.23 CPM and $350 per demo request lead (Kiin Labs panel, 1,000+ accounts, $65M+ spend)." Kiin Labs, kiin.co/research/digital-ad-spend-statistics#b2b
Figures previously published by The B2B House
The B2B House's "Digital Ad Spend: Statistics and Trends (2024 Update)" is cited by Clutch, Seeking Alpha, Vendasta, academic papers and others. The B2B House is now part of Kiin, so the figures it published stay here, exactly as published, so every link to them still makes sense. Next to each one is what we know in 2026.
Three things to know before you use them:
- They were forecasts. Despite the "2024 Update" title, the guide's numbers came from eMarketer's (then Insider Intelligence's) worldwide forecast of late 2022, with predictions for 2023 to 2026. Most of those years have now happened, so the forecasts can be checked.
- They were eMarketer's, not The B2B House's. The guide said "our forecast" and "our method", but the method it described (43,000 data points from 600 sources) is eMarketer's. We credit eMarketer here.
- Company figures were estimates. eMarketer's company ad revenues are its own estimates, often net of payments to partners, so they differ from what companies report. Use reported revenue from section 07 for anything after 2022.
"Total ad spending will reach $1 trillion for the first time in 2024"
As published: total media ad spending would grow 6.9% in 2023 and was "still on track to reach $1 trillion for the first time in 2024". Growth in 2022 was cut from 10.6% to 5.1%. Other sites cite the page for "in 2024, global ad spend reached $1.1 trillion". Source: eMarketer forecast, late 2022.
2026: It depends on whose definition you use. WARC says the market was $1.19 trillion in 2025 (WARC, Dec 2025) and forecasts $1.34 trillion in 2026, up 11.9% (WARC, Oct 2026). WPP Media says the $1 trillion mark was passed in 2025 and forecasts $1.3 trillion in 2026; dentsu and Magna put the first $1 trillion year at 2026. Every source agrees the market is now above $1 trillion. Section 02.
"Digital ad spending will make up over two-thirds of all ad spending for the first time"
As published: "This year, digital ad spending will make up over two-thirds of all ad spending for the first time" (written for 2023). Cited elsewhere as "nearly 70% of ad spending is allocated to digital advertising" and "more than two-thirds going to digital formats for the first time". Traditional media: $303 billion in 2023, growth of 0.1%. Source: eMarketer.
2026: True and still rising slowly. dentsu forecasts digital at 68.7% of global ad spend in 2026 (dentsu); Magna put digital pure players at about 73% of ad sales in 2025, with traditional media owners at $264 billion, down 3% (Magna). Section 03.
"Digital ad spending will reach $835.82 billion in 2026"
As published: worldwide digital ad spending of $567.49 billion in 2022, $626.86 billion in 2023, $695.96 billion in 2024, $765.98 billion in 2025 and $835.82 billion in 2026; growth of 8.6% in 2022, 10.5% in 2023, 11.0% in 2024, 10.1% in 2025 and 9.1% in 2026. One linking site also gives a "72.5%" digital share, which does not appear on the original page. Source: eMarketer.
2026: None of the forecasters we use publishes a like-for-like "worldwide digital" total openly any more; they publish channels. The closest measures: digital pure players took $715 billion in 2025 (Magna), and social, search and retail media alone are forecast at $892.4 billion in 2026 (WARC: $394.6B + $295.7B + $202.1B, section 04). We do not recommend quoting $835.82 billion or 72.5% as 2026 facts.
"Latin America will dominate the top 10 countries for digital ad growth"
As published: of the top 10 countries ranked by digital ad spending growth in 2023, Latin American countries would take most places, with five in the top six; Latin America +14.0% in 2023; India +16.5%; Peru +20.0%, Argentina +19.2%, Chile +17.0%, Colombia +16.0%, Mexico +14.5%, Brazil +11.3%; India to join the top 10 ad markets in 2023. Source: eMarketer.
2026: Still broadly true for total ad spend. dentsu ranks Brazil (9.1%) and India (8.6%) as the fastest-growing major markets in 2026 (dentsu); WARC has Brazil +10.7% in 2026 and India +8.0%, but Mexico fell 8.8% in 2025 (WARC). India's total ad market was $13.8 billion in 2025. Growth rates now are roughly half the 2023 forecasts. Section 05.
"North America is 46.4% of digital ad spending, Asia Pacific 32.6%"
As published: North America's digital ad spending would reach $290.78 billion in 2023, 46.4% of the world; Asia Pacific 32.6% ($204.23 billion); Europe 14.5%; Latin America 2.9%. US digital ad spending $278.59 billion in 2023; China $140.10 billion; UK $33.21 billion. Source: eMarketer.
2026: No current regional digital split is published openly. For total ad spend, the US is 35.3% of the world ($421.1 billion) and China 16.8% ($200.1 billion) in 2025 (WARC). For US digital specifically, measured revenue was $294.6 billion in 2025 (IAB/PwC). Section 06.
Search: "search grew faster than display for the first time" and Google's 59.5% of search
As published: in 2022 search ad spending grew faster than display for the first time since 2013; worldwide search ad spending $247.59 billion in 2023 and $274.18 billion in 2024; Google 59.5% of search ad spending, Baidu 2.9%, Microsoft 2.7%. One site cites the page for search being "nearly 40% of digital revenue" in the US. Source: eMarketer.
2026: WARC forecasts global search at $295.7 billion in 2026, up 14.2%; WPP Media puts traditional search at $267.2 billion plus $5.1 billion of AI search. In the US, search was $114.2 billion, 38.8% of internet ad revenue in 2025, and was overtaken by social for the first time (IAB/PwC). Google Search & other ad revenue was $224.5 billion in 2025 (Alphabet); Microsoft's search advertising was $15.2 billion in its year to June 2026 (Microsoft). Section 04.
"The duopoly is a thing of the past": Google and Meta's share
As published: Meta and Google briefly took more than 50% of global digital ad revenue in 2021, which would likely mark "the pinnacle of their combined supremacy"; three challengers (Amazon, ByteDance, Alibaba) would take 20.2% by 2023; Meta's ad revenue fell 2.0% in 2022. Other sites cite the page for Google at 28.9% and Meta at 19.4% of global digital ad revenue in 2024, figures that are not on the original page. Source: eMarketer.
2026: The duopoly became a triopoly. Alphabet, Amazon and Meta take 59.7% of global ad spend outside China in 2026, $659.6 billion, rising to 61.5% by 2028 (WARC); WPP Media says 57.6% (WPP Media). Meta's ad revenue grew 22% in 2025 to $196.2 billion. We found no current primary source for the 28.9% / 19.4% split. Section 08.
Company ad revenues: Google $168.44B, Meta $112.68B, Amazon $37.99B (2022)
As published: 2022 net ad revenues of Google $168.44 billion, Meta $112.68 billion, Alibaba $41.01 billion, Amazon $37.99 billion, ByteDance $29.07 billion, Microsoft $12.23 billion, LinkedIn $5.99 billion, Apple $7.06 billion; forecasts for 2024 of Google $201.05 billion, Meta $134.72 billion, Amazon $55.99 billion, LinkedIn $8.96 billion; Google to be the first ad company to reach $200 billion by 2024. Source: eMarketer estimates.
2026: Reported figures: Google advertising $294.7 billion in 2025 and $264.6 billion in 2024 (reported revenue is gross of partner payments, so it is higher than eMarketer's net estimates), Meta $196.2 billion in 2025 and $160.6 billion in 2024, well above the $134.72 billion forecast, and Amazon $68.6 billion in 2025 and $56.2 billion in 2024, close to the forecast. LinkedIn does not report ad revenue; its Marketing Solutions business passed $5 billion in fiscal 2022 and grew 16% in the June 2026 quarter. Section 07.
TikTok: "$9.89 billion in 2022, up 155%"
As published: TikTok's global ad revenue grew 155.0% in 2022 to $9.89 billion and would reach $14.15 billion in 2023 and $18.49 billion in 2024; ByteDance (TikTok and Douyin) $29.07 billion in 2022. Source: eMarketer.
2026: ByteDance is private and does not publish ad revenue. WARC estimates TikTok's US ad revenue at about $12 billion in 2025 and forecasts TikTok to reach $45.2 billion globally by 2027, less than a fifth of Meta's expected ad revenue (WARC). ByteDance is one of the five largest ad sellers worldwide in WPP Media's ranking.
Europe and currency: "UK ad spending fell 4.9% in US dollars"
As published: UK ad spending declined 4.9% in US dollars in 2022 but rose by £3.33 billion in sterling; Germany fell 11.7% in dollars but rose €733.5 million; Western Europe digital −4.6% in 2022. Source: eMarketer.
2026: The currency effect has reversed. WARC values the UK ad market at $58.1 billion in 2025, up 9.3%, with 8.5% forecast for 2026; Germany $34.4 billion (+9.3%), France $21.9 billion (+8.9%), Italy $12.4 billion (+7.4%), Spain $10.7 billion (+9.8%) (WARC). WPP Media forecasts Europe at 6.9% in 2026. Section 05.
China: "no double-digit digital growth through 2026"
As published: China's ad outlays rose 3.7% in 2022 with a 6.5% rebound in 2023; no double-digit digital growth through 2026; China digital ad spending $140.10 billion in 2023, rising to $180.17 billion in 2026. Source: eMarketer.
2026: Right so far. WARC puts China's total ad market at $200.1 billion in 2025, up 6.9%, forecasting 8.9% in 2026 (WARC); dentsu forecasts 6.1%. Neither is double-digit. WPP Media expects growth in Chinese retail media, the world's largest, to slow to 3% in 2026.
Growth rates: "digital ad growth will stay around 10% for five years"
As published: in the ten years before 2022 digital ad spending grew an average of 20% a year; it would stay "around 10%" for the next five years; 2022 would be "the lowest point" of a new period of slower growth; 2021 growth was the fastest on record. Source: eMarketer.
2026: Broadly right. WARC says the total market grew 10.0% in 2024 and 2025 and forecasts 11.9% in 2026 and 8.4% in 2027 (WARC). US internet ad revenue grew 14.9% in 2024 and 13.9% in 2025 (IAB/PwC). The digital channels doing the growing are social (+21.3%), search (+14.2%) and retail media (+14.3%).
Other figures from the original guide
As published: Spotify ad revenue to pass $2 billion in 2023 and reach $2.53 billion in 2024; Kuaishou to pass $10 billion in 2023; Apple ad revenue $10.69 billion in 2024; Twitter $4.67 billion in 2022; Reddit $0.38 billion in 2022; Snapchat $3.97 billion; Pinterest $2.74 billion; Microsoft (LinkedIn) display ad spending $4.51 billion in 2022; traditional media to be 67.6% of India's ad spending in 2023. Source: eMarketer estimates.
2026: For the listed public companies, reported revenue is the better number. In July to September 2026 alone, Reddit's revenue was $895 million, up 53% (Reddit), Snap's $1.72 billion (+14%) and Pinterest's $1.17 billion (+12%). X (formerly Twitter) is private and no longer reports. We keep the remaining figures here only as the original guide published them.
Digital ad spend stats we no longer recommend using
A good statistics page should also say what not to quote. These figures are still widely repeated, including in AI answers, but are out of date or have no primary source:
- "Digital ad spending will reach $835 billion in 2026." A 2022 eMarketer forecast for a measure the forecasters we use no longer publish openly. Details.
- "72.5% of ad investment is digital." Not on the original page and not traceable to a primary source. Use dentsu's 68.7% (2026) or Magna's 73% (2025). Details.
- "Google has 28.9% and Meta 19.4% of global digital ad revenue." Not on the original page; no primary source found. Use WARC's 59.7% for Alphabet, Amazon and Meta combined. Details.
- "The Google and Meta duopoly is over." Their combined ad revenue reached $490.9 billion in 2025 and the top three's share is still rising.
- "LinkedIn's ad revenue is $X billion." LinkedIn has not disclosed ad revenue since passing $5 billion in fiscal 2022. Any later figure is an estimate.
- "Our forecast is based on 43,000 data points from 600 sources." That describes eMarketer's method, not The B2B House's.
- "Global ad spend was $1.1 trillion in 2024." Forecasters' totals for 2024 differ by definition, and several put the first $1 trillion year at 2025 or 2026. Quote a named source and its year.
The original B2B House guide, archived in full
The B2B House is now part of Kiin. So that every link to its guide still makes sense, the complete original is kept below, section by section, exactly as it was last published (only typos fixed). Figures in it are from the dates its authors gave; the sections above give the current numbers and sources. Open any section to read it.
Global Forecast of digital ad spending
Our newly updated global forecast says that the total amount spent on advertising in the media will increase by 6.9% from 2022 to 2023. This is less than what we thought before, but it’s still an enormous improvement over what happened in 2022. We now think that people spent $37 billion less on ads last year than we thought they would when we made our March forecast.
We cut our estimate for the growth of ad spending around the world in 2022 from 10.6% to 5.1%. This is a low growth rate compared to the past, but it is better than the 0.0% growth caused by a pandemic in 2020 and about the same as growth rates from a decade ago. Also, we expect growth to be higher than it was in 2022 for the next few years.
We think that 2022 will be the lowest point of the new period of slower growth. In 2023, advertisers will spend nearly $60 billion more than they did in 2022, and total spending is still on track to reach $1 trillion for the first time in 2024, the same year that was expected before.
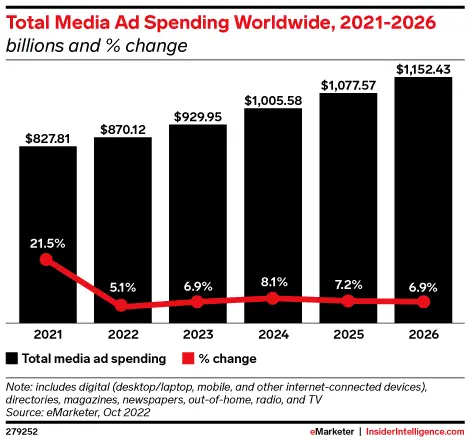
Total Media Ad Spending Worldwide, 2021-2026
Nearly every ad spending measure we keep track of grew at its fastest rate ever in 2021. (we began our global forecasting in 2011). Because of this, the 16.4% drop in growth in 2022 surprised many people in the industry.
Traditional and Digital ad spending forecast
Even worse, traditional advertising spending (on TV, newspapers, radio, magazines, and out-of-home) went from going up by 9.8% in 2021 to going down by 0.9% in 2022. Even in 2023, traditional will not come back in a big way.
The news isn’t as bad for spending on digital ads. Even though many people in the industry were surprised by the sharp drop in growth from 2021 to 2022, spending on digital ads still went up by 8.6% worldwide in 2022. That number is much lower than we expected (15.6% was our previous guess), but it’s not a disaster. And we expect growth to pick up a little over the next few years to reach the low double-digit range.
Even though digital ad spending will continue to grow faster than the market, it has entered a new period of slower growth. In the 10 years before 2022, the world’s spending on digital ads grew by an average of 20% per year. This number will stay around 10% for the next five years.
In 2023, they will spend nearly $60 billion on new ads around the world will be digital. This increase of $59.37 billion is good news for digital publishers and ad agencies all over the world. Digital advertising isn’t falling off a cliff; its rate of growth is just slowing down to what will be the new average.
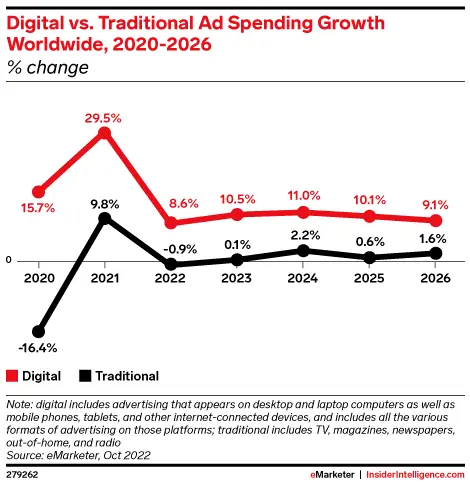
Digital vs traditional ad spending growth worldwide, 2020-2026 graph
This year, digital ad spending will make up over two-thirds of all ad spending for the first time. This is a big step for an industry that is still shaky.
| Metric | Geography | Data Type | Unit | 2020 | 2021 | 2022 | 2023 | 2024 | 2025 | 2026 |
| Traditional media ad spending | worldwide | USD | Billions | $278 | $305 | $303 | $303 | $310 | $312 | $317 |
| Traditional media ad spending growth | worldwide | % change | Percent | -16.4% | 9.8% | -0.9% | 0.1% | 2.2% | 0.6% | 1.6% |
| Digital ad spending growth | worldwide | % change | Percent | 15.7% | 29.5% | 8.6% | 10.5% | 11.0% | 10.1% | 9.1% |
Table of traditional and digital ad spending growth
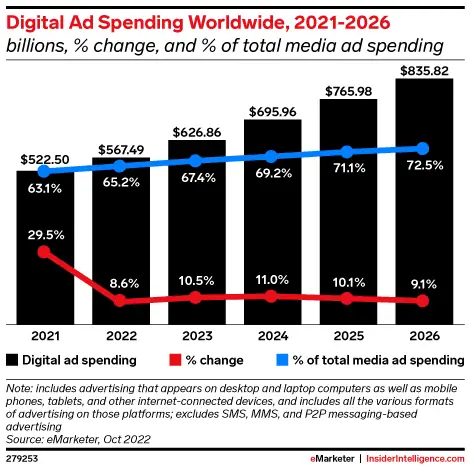
Digital ad spending worldwide, % change, and % of total media ad spending, 2021-2026
Digital ad spend growth by countries and regions
The drop in spending on digital ads in 2022 was different in each market, and the rise in spending in 2023 will be the same. Some countries and regions are slowing down quickly, while others are slowing down more slowly. We didn’t expect 2022 to be as hard for Western Europe and China as it was. Latin America still grew a lot, even though the final numbers will be lower than we had thought. Western Europe should be in a better place by 2023, but China won’t change much.
Our regional and national comparisons have shown that China and Western Europe have not met our expectations, while Latin America and India continue to perform well.
In 2023, we project only five countries to exhibit double-digit growth rates for total media ad spending. Among these nations, India stands out as the sole large market for achieving this feat. Digital advertising is experiencing double-digit growth rates in 14 countries, including the United States. While the industry faces challenges, the digital advertising sector remains resilient.
We have forecasted that Latin America countries will dominate the top 10 digital ad growth in 2023. Whilst Brazil stands alone as the sole nation in the region to feature among the world’s top 10 in digital expenditure, the entire region is currently undergoing a significant surge in advertising. Our projections show that 5 Latin America countries under our watch will secure a spot in the top six global leaders for digital growth. We expect the entire region to experience a 14.0% surge in digital ad spending.
We expect a moderate deceleration compared to the previous two years, however, it will not be a significant disruption. While inflation may be a contributing factor to certain national growth figures in the region, it is important to note that most of these increases are indeed authentic. The organic growth phase in Latin America is still ongoing.
India presents a significant opportunity for growth beyond the Latin America market. India’s digital ad spending growth momentum is expected to be sustained for several more years, similar to its peers south of the US border. By 2023, India is poised to join the ranks of the top 10 global ad markets, marking a significant milestone for the country’s advertising industry.
The Indian digital advertising sector presents a vast potential for expansion, given that conventional advertising expenses are projected to make up 67.6% of the nation’s overall ad expenditures by 2023. This ratio is in stark contrast to the worldwide average.
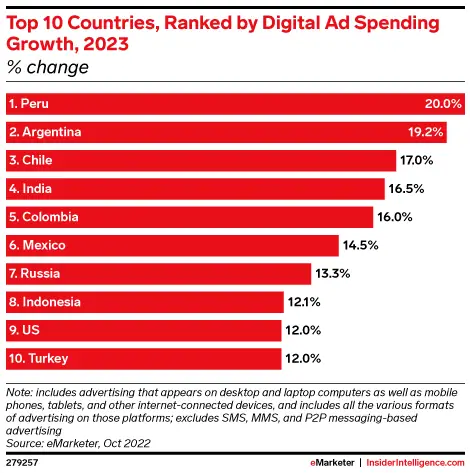
Top 10 countries, ranked by digital ad spending growth, 2023
| Metric | Geography | Data Type | Unit | 2020 | 2021 | 2022 | 2023 | 2024 | 2025 | 2026 |
| Digital ad spending growth | australia | % change | Percent | 3.0% | 25.5% | 17.9% | 6.7% | 5.0% | 3.4% | 2.0% |
| Digital ad spending growth | china | % change | Percent | 19.0% | 19.8% | 6.7% | 8.1% | 9.5% | 8.6% | 8.1% |
| Digital ad spending growth | india | % change | Percent | 14.0% | 32.0% | 24.2% | 16.5% | 15.1% | 14.3% | 13.1% |
| Digital ad spending growth | indonesia | % change | Percent | 10.0% | 30.5% | 17.0% | 12.1% | 10.2% | 8.7% | 7.7% |
| Digital ad spending growth | japan | % change | Percent | 8.6% | 18.3% | 8.9% | 6.2% | 4.8% | 4.2% | 3.2% |
| Digital ad spending growth | south korea | % change | Percent | 14.0% | 20.5% | 9.4% | 4.2% | 4.0% | 3.9% | 3.8% |
| Digital ad spending growth | thailand | % change | Percent | 14.8% | 17.7% | 13.6% | 11.5% | 7.0% | 6.8% | 6.4% |
| Digital ad spending growth | new zealand | % change | Percent | 6.2% | 19.9% | 8.6% | 4.8% | 3.4% | 2.6% | 1.8% |
| Digital ad spending growth | singapore | % change | Percent | 10.0% | 22.8% | 11.9% | 9.0% | 8.8% | 8.5% | 8.1% |
| Digital ad spending growth | malaysia | % change | Percent | 9.3% | 16.7% | 8.9% | 6.9% | 6.4% | 6.0% | 5.5% |
| Digital ad spending growth | hong kong | % change | Percent | 8.0% | 13.0% | 7.6% | 4.3% | 3.5% | 2.4% | 1.5% |
| Digital ad spending growth | philippines | % change | Percent | 8.6% | 11.9% | 8.8% | 8.2% | 8.2% | 8.0% | 8.0% |
| Digital ad spending growth | taiwan | % change | Percent | 8.0% | 12.5% | 6.4% | 4.0% | 3.1% | 2.0% | 1.0% |
| Digital ad spending growth | vietnam | % change | Percent | 8.2% | 11.8% | 9.1% | 9.1% | 9.0% | 9.0% | 8.9% |
| Digital ad spending growth | other asia-pacific | % change | Percent | 14.8% | 22.3% | 20.8% | 9.6% | 9.3% | 6.5% | 7.1% |
| Digital ad spending growth | asia-pacific | % change | Percent | 16.0% | 20.1% | 8.7% | 7.9% | 8.5% | 7.6% | 7.1% |
| Digital ad spending growth | argentina | % change | Percent | 2.3% | 47.8% | 25.5% | 19.2% | 20.0% | 17.0% | 15.0% |
| Digital ad spending growth | brazil | % change | Percent | 21.0% | 31.2% | 20.0% | 11.3% | 13.0% | 11.9% | 11.0% |
| Digital ad spending growth | mexico | % change | Percent | 1.2% | 35.0% | 15.0% | 14.5% | 15.0% | 12.0% | 11.0% |
| Digital ad spending growth | peru | % change | Percent | 18.0% | 47.3% | 30.0% | 20.0% | 21.0% | 20.0% | 16.0% |
| Digital ad spending growth | chile | % change | Percent | 19.0% | 47.9% | 20.0% | 17.0% | 17.4% | 15.0% | 14.0% |
| Digital ad spending growth | colombia | % change | Percent | 31.0% | 55.0% | 17.0% | 16.0% | 16.7% | 16.2% | 15.6% |
| Digital ad spending growth | other latin america | % change | Percent | 19.8% | 38.2% | 20.3% | 16.5% | 17.7% | 15.3% | 11.8% |
| Digital ad spending growth | latin america | % change | Percent | 15.5% | 35.8% | 19.3% | 14.0% | 15.3% | 13.4% | 11.8% |
| Digital ad spending growth | middle east & africa | % change | Percent | 45.0% | 30.0% | 28.0% | 22.0% | 23.0% | 14.0% | 9.4% |
| Digital ad spending growth | canada | % change | Percent | 9.0% | 28.0% | 12.0% | 11.7% | 11.5% | 11.3% | 10.7% |
| Digital ad spending growth | us | % change | Percent | 17.3% | 37.2% | 12.5% | 12.0% | 11.8% | 11.7% | 10.8% |
| Digital ad spending growth | north america | % change | Percent | 16.9% | 36.8% | 12.5% | 12.0% | 11.8% | 11.7% | 10.8% |
| Digital ad spending growth | russia | % change | Percent | 6.0% | 32.0% | -48.2% | 13.3% | 12.5% | 11.0% | 9.0% |
| Digital ad spending growth | turkey | % change | Percent | 20.0% | 30.0% | -20.8% | 12.0% | 11.0% | 8.5% | 6.5% |
| Digital ad spending growth | other central & eastern europe | % change | Percent | 7.2% | 32.3% | 1.6% | -0.8% | 13.3% | 11.7% | 9.2% |
| Digital ad spending growth | central & eastern europe | % change | Percent | 7.2% | 32.1% | -19.2% | 3.4% | 13.0% | 11.4% | 9.0% |
| Digital ad spending growth | france | % change | Percent | 3.5% | 30.0% | -2.5% | 10.1% | 11.0% | 10.0% | 9.0% |
| Digital ad spending growth | germany | % change | Percent | 11.0% | 27.5% | -7.9% | 7.0% | 9.5% | 8.0% | 7.0% |
| Digital ad spending growth | italy | % change | Percent | 5.5% | 24.0% | -7.9% | 7.0% | 9.5% | 7.0% | 6.5% |
| Digital ad spending growth | spain | % change | Percent | -3.0% | 34.0% | -4.0% | 9.0% | 11.0% | 9.0% | 7.0% |
| Digital ad spending growth | uk | % change | Percent | 9.0% | 36.0% | -3.9% | 8.8% | 10.5% | 8.0% | 7.0% |
| Digital ad spending growth | other western europe | % change | Percent | 14.3% | 24.0% | -3.9% | 9.9% | 9.2% | 8.0% | 6.6% |
| Digital ad spending growth | western europe | % change | Percent | 9.4% | 30.1% | -4.6% | 8.9% | 10.0% | 8.2% | 7.1% |
| Digital ad spending growth | worldwide | % change | Percent | 15.7% | 29.5% | 8.6% | 10.5% | 11.0% | 10.1% | 9.1% |
| Digital ad spending growth | eu-5 | % change | Percent | 7.7% | 32.4% | -4.8% | 8.5% | 10.3% | 8.3% | 7.3% |
| Digital ad spending growth | southeast asia | % change | Percent | 10.7% | 19.9% | 12.5% | 10.1% | 8.4% | 7.9% | 7.4% |
Table for total digital ad spending growth by geography, countries and region.
Digital ad spending forecast in Europe
In the year 2022, Western Europe, Turkey, and Russia experienced a significant decline in their overall ad spending growth. However, we expect a slight rebound in the year 2023. The volatile fluctuations in exchange rates during 2022 have significantly contributed to the wild swings observed in the market. The ad spending outcomes for 2022 in the UK, Eurozone, and Turkey were mitigated by the local currency’s weakness against the dollar.
Our UK ad spending experienced a decline of 4.9% in US dollars in 2022. However, there was an increase in spending by £3.33 billion in pounds sterling.
Our ad spending in Germany experienced a significant decline of 11.7% in US dollars in 2022. However, we saw a modest increase of €733.5 million.
We observed analogous trends in France, Italy, Spain, and Turkey. The decline in both US dollars and rubles was substantial in Russia.
Economic factors and currency fluctuations impact ad spending
The prevailing inflationary environment poses a significant challenge in deciphering these outcomes. Our projections show that by 2023, we will witness a restoration of stability in relation to inflation and currency fluctuations. However, until that time, it is important to note that international comparisons will remain subject to these particular considerations.
The stagnation in China is a significant contributor to the decline in global growth. China has showed remarkable leadership in the global increase of ad expenditure from 2018 to 2020. China’s shift from an ad spending engine to a drag on the global average is now clear. Our ad outlays in China experienced a slight increase of 3.7% in 2022, with a projected modest rebound of 6.5% in 2023. It is noteworthy that our projection shows a lack of double-digit growth in China’s digital ad spending for the duration of our forecast period. (which stretches to 2026).
A significant portion of the decline will result from our own actions. Implementing China’s latest data privacy laws, anti-monopoly measures, and regulatory restrictions on its internet giants will undoubtedly limit the growth of its digital advertising sector for the foreseeable future.
The current macroeconomic situation in China continues to deteriorate. Our projected GDP growth of 5.5% for 2022 is unfortunately not on track to be met. China’s “zero COVID” policy has had a significant impact on consumer confidence, resulting in record low levels. As we witness the swift relaxation of COVID-19 restrictions, it is imperative to acknowledge the looming concern that our Chinese counterparts may grapple with the epidemic that their government has successfully contained for the past three years, well into 2023.
Digital ad spending by ad type and format.
The slowdown in digital spending in 2022 also had different effects on different ad types. In 2022, growth slowed down a lot for both search and display, but Display was in a worse position. Display-heavy social media ad revenues were very disappointing in 2022, as shown by Meta’s record-low performance and TikTok’s big revenue miss.
Search and retail media that were used for performance marketing did a little better. Given how bad the economy is around the world, that was an expected result. Apple’s new privacy rules have also hurt display advertising on social media, but they don’t affect search as much.
In 2022, spending on search ads grew faster than spending on display ads. This was the first time this has happened since we started keeping track of the numbers in 2013. Display will come back in 2023, but it’s not getting as much market share as it used to. After spending years moving money from search to display, search will only lose a little ground from now on.
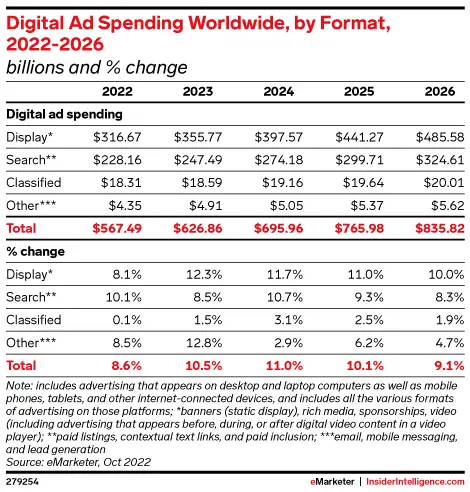
Digital ad spending by format and ad types, 2022-2026
For further reading, check out our guide on the latest video marketing statistics.
Top countries and regions for digital ad spends
We expect that China and the western (english-speaking) nations will maintain their dominance in the digital advertising expenditure share rankings. China has been and will continue to be the leading metric in this area for the foreseeable future, extending until 2026 and beyond. The Asia-Pacific region boasts a powerful presence in the upper echelons, with Taiwan, South Korea, China, Australia, and New Zealand all making the top 10. At one end of the rankings, we have Japan and the Southeast Asia countries. The current state of digital transformation varies significantly throughout the region.
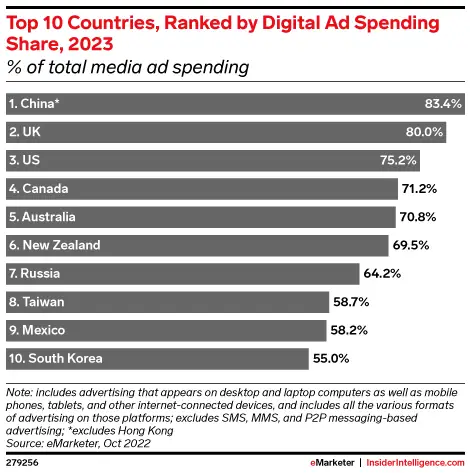
Top countries by digital ad spending share, 2023
Our team has conducted a thorough analysis and has identified the top 10 countries that are projected to have the highest digital ad spending share in 2023. We are pleased to share this valuable information with our stakeholders.
North America continues to be the primary hub for both overall advertising expenditure and digital advertising expenditure, with Asia-Pacific following in second place but experiencing a widening gap. Our projections show that North America’s digital ad spending will reach $290.78 billion by 2023, representing a staggering 46.4% of the global total. The Asia-Pacific region is projected to represent a significant portion of our revenue, comprising 32.6% or $204.23 billion. Europe’s contribution will amount to a mere 14.5%, while Latin America’s will be a modest 2.9%. As expected, the regional outcomes will be primarily influenced by the United States and China.
Our team has conducted a thorough analysis and has identified the top 10 countries that are projected to lead in digital ad spending by the year 2023. (billions)
Based on our projections, we expect that the digital spending rankings for 2023 will closely resemble those of the previous year, except Canada, which is expected to ascend to one position. Based on our analysis, we expect a stable outlook for the ranking of high-spending nations in the coming years.
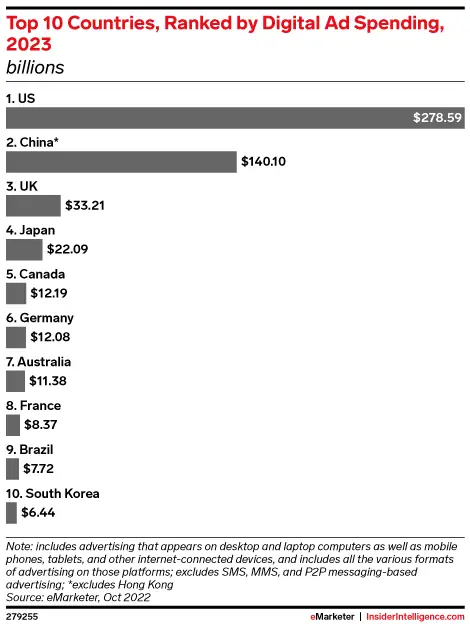
Top 10 countries, ranked by digital ad spending, 2023
| Metric | Geography | Data Type | Unit | 2020 | 2021 | 2022 | 2023 | 2024 | 2025 | 2026 |
| Digital ad spending | australia | US Dollars $ | Billions | $7.21 | $9.04 | $10.66 | $11.38 | $11.95 | $12.35 | $12.60 |
| Digital ad spending | china | US Dollars $ | Billions | $101.38 | $121.46 | $129.59 | $140.10 | $153.46 | $166.65 | $180.17 |
| Digital ad spending | india | US Dollars $ | Billions | $2.09 | $2.76 | $3.43 | $3.99 | $4.60 | $5.25 | $5.94 |
| Digital ad spending | indonesia | US Dollars $ | Billions | $0.71 | $0.92 | $1.08 | $1.21 | $1.33 | $1.45 | $1.56 |
| Digital ad spending | japan | US Dollars $ | Billions | $16.15 | $19.10 | $20.81 | $22.09 | $23.16 | $24.13 | $24.90 |
| Digital ad spending | south korea | US Dollars $ | Billions | $4.69 | $5.65 | $6.18 | $6.44 | $6.69 | $6.96 | $7.22 |
| Digital ad spending | thailand | US Dollars $ | Billions | $0.76 | $0.90 | $1.02 | $1.14 | $1.22 | $1.30 | $1.38 |
| Digital ad spending | new zealand | US Dollars $ | Billions | $0.95 | $1.14 | $1.24 | $1.30 | $1.34 | $1.38 | $1.40 |
| Digital ad spending | singapore | US Dollars $ | Billions | $0.54 | $0.66 | $0.74 | $0.81 | $0.88 | $0.96 | $1.03 |
| Digital ad spending | malaysia | US Dollars $ | Billions | $0.36 | $0.43 | $0.46 | $0.50 | $0.53 | $0.56 | $0.59 |
| Digital ad spending | hong kong | US Dollars $ | Billions | $0.86 | $0.97 | $1.04 | $1.09 | $1.12 | $1.15 | $1.17 |
| Digital ad spending | philippines | US Dollars $ | Billions | $0.46 | $0.52 | $0.56 | $0.61 | $0.66 | $0.71 | $0.77 |
| Digital ad spending | taiwan | US Dollars $ | Billions | $1.24 | $1.40 | $1.49 | $1.54 | $1.59 | $1.62 | $1.64 |
| Digital ad spending | vietnam | US Dollars $ | Billions | $0.30 | $0.34 | $0.37 | $0.40 | $0.44 | $0.48 | $0.52 |
| Digital ad spending | other asia-pacific | US Dollars $ | Billions | $7.19 | $8.79 | $10.62 | $ 11.64 | $ 12.72 | $ 13.55 | $ 14.51 |
| Digital ad spending | asia-pacific | US Dollars $ | Billions | $ 144.89 | $ 174.07 | $ 189.28 | $ 204.23 | $ 221.68 | $ 238.49 | $ 255.40 |
| Digital ad spending | argentina | US Dollars $ | Billions | $0.36 | $0.54 | $0.67 | $0.80 | $0.96 | $1.12 | $1.29 |
| Digital ad spending | brazil | US Dollars $ | Billions | $4.40 | $5.78 | $6.93 | $7.72 | $8.72 | $9.76 | $10.83 |
| Digital ad spending | mexico | US Dollars $ | Billions | $2.04 | $2.75 | $3.16 | $3.62 | $4.16 | $4.66 | $5.18 |
| Digital ad spending | peru | US Dollars $ | Billions | $0.13 | $0.19 | $0.25 | $0.30 | $0.36 | $0.43 | $0.50 |
| Digital ad spending | chile | US Dollars $ | Billions | $0.32 | $0.47 | $0.57 | $0.66 | $0.78 | $0.90 | $1.02 |
| Digital ad spending | colombia | US Dollars $ | Billions | $0.36 | $0.55 | $0.65 | $0.75 | $0.88 | $1.02 | $1.18 |
| Digital ad spending | other latin america | US Dollars $ | Billions | $2.18 | $3.02 | $3.63 | $4.23 | $4.98 | $5.74 | $6.42 |
| Digital ad spending | latin america | US Dollars $ | Billions | $9.79 | $13.30 | $15.86 | $18.08 | $20.84 | $23.63 | $26.42 |
| Digital ad spending | middle east & africa | US Dollars $ | Billions | $11.16 | $14.50 | $18.56 | $22.65 | $27.86 | $31.75 | $34.74 |
| Digital ad spending | canada | US Dollars $ | Billions | $7.61 | $9.75 | $10.92 | $12.19 | $13.59 | $15.13 | $16.75 |
| Digital ad spending | us | US Dollars $ | Billions | $161.08 | $221.06 | $248.72 | $278.59 | $311.46 | $347.88 | $385.47 |
| Digital ad spending | north america | US Dollars $ | Billions | $168.69 | $230.81 | $259.64 | $290.78 | $325.05 | $363.01 | $402.22 |
| Digital ad spending | russia | US Dollars $ | Billions | $3.26 | $4.31 | $2.23 | $2.53 | $2.85 | $3.16 | $3.44 |
| Digital ad spending | turkey | US Dollars $ | Billions | $0.35 | $0.45 | $0.36 | $0.40 | $0.44 | $0.48 | $0.51 |
| Digital ad spending | other central & eastern europe | US Dollars $ | Billions | $4.56 | $6.03 | $6.13 | $6.08 | $6.89 | $7.70 | $8.40 |
| Digital ad spending | central & eastern europe | US Dollars $ | Billions | $ 8.16 | $ 10.79 | $ 8.72 | $ 9.01 | $ 10.18 | $ 11.33 | $ 12.36 |
| Digital ad spending | france | US Dollars $ | Billions | $6.00 | $7.80 | $7.60 | $8.37 | $9.29 | $10.22 | $11.14 |
| Digital ad spending | germany | US Dollars $ | Billions | $9.61 | $12.25 | $11.29 | $12.08 | $13.23 | $14.28 | $15.28 |
| Digital ad spending | italy | US Dollars $ | Billions | $3.14 | $3.89 | $3.59 | $3.84 | $4.20 | $4.50 | $4.79 |
| Digital ad spending | spain | US Dollars $ | Billions | $2.28 | $3.05 | $2.93 | $3.19 | $3.54 | $3.86 | $4.13 |
| Digital ad spending | uk | US Dollars $ | Billions | $23.35 | $31.76 | $30.53 | $33.21 | $36.70 | $39.64 | $42.41 |
| Digital ad spending | other western europe | US Dollars $ | Billions | $16.35 | $20.28 | $19.50 | $21.42 | $23.39 | $25.27 | $26.93 |
| Digital ad spending | western europe | US Dollars $ | Billions | $60.73 | $79.04 | $75.43 | $82.11 | $90.35 | $97.76 | $104.69 |
| Digital ad spending | worldwide | US Dollars $ | Billions | $403.42 | $522.50 | $567.49 | $626.86 | $695.96 | $765.98 | $835.82 |
| Digital ad spending | eu-5 | US Dollars $ | Billions | $44.38 | $58.75 | $55.93 | $60.69 | $66.96 | $72.50 | $77.75 |
| Digital ad spending | southeast asia | US Dollars $ | Billions | $3.14 | $3.76 | $4.23 | $4.66 | $5.05 | $5.45 | $5.85 |
Table for total digital ad spending by geography, countries and region.
Digital advertising spending by platforms
Let’s review our revenue performance for Peak. The duopoly has been a thing of the past.
As the CEO, it’s clear that Meta had a challenging year in 2022. Our estimations show a 2.0% decline in ad revenues globally, which is a noteworthy turning point for Meta and Google’s ad duopoly. It is highly probable that the year 2021 will mark the pinnacle of their combined supremacy. In that year, Meta and Google briefly dominated over 50% of the global digital advertising revenues. The likelihood of replicating this achievement is low.
Internationally, we have observed that the duopoly has been maintaining its market share, unlike in the US where it has been experiencing a decline since 2018. Our global advertising presence has not been as robust as our domestic efforts, but we are actively working to improve this. We have observed the emergence of formidable new competitors such as ByteDance and Apple, who have rapidly gained significant market shares on a global scale.
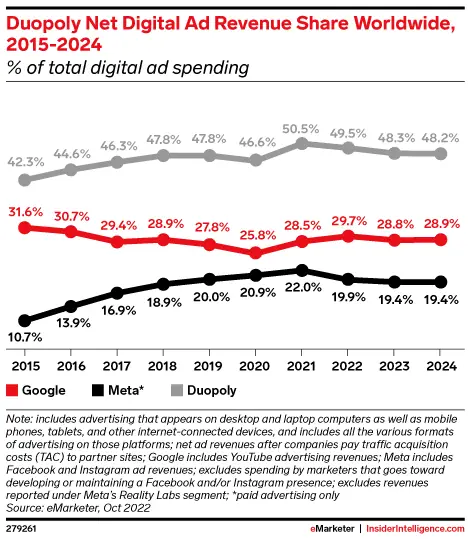
Duopoly net digital ad revenue share worldwide (% of total digital ad spending), 2015-204
Our projected global digital ad revenue share for the years 2015-2024 shows a significant duopoly dominance.
The duopoly’s upward momentum had been consistently strong until 2022, as we have been diligently tracking since 2011. For nearly a decade, Google’s substantial advertising enterprise has experienced robust global expansion. During that period, the company experienced a decline in market share, primarily because of the exponential growth of Facebook. Despite a temporary setback caused by the pandemic, both companies have experienced a significant surge in 2021. Currently, the declining trend seems to have a more natural progression. The current outlook for Meta is less than favorable, while Google is experiencing a period of more moderate growth.
It’s noteworthy that Alibaba, Amazon, and ByteDance have emerged as major players in the advertising industry, surpassing the advertising expenditure of several nations. By 2023, Kuaishou, the Chinese short-video app, will be included in the list, followed by Apple in 2024. The competitive landscape in the industry will become more crowded, although Alphabet and Meta will maintain their leading positions.
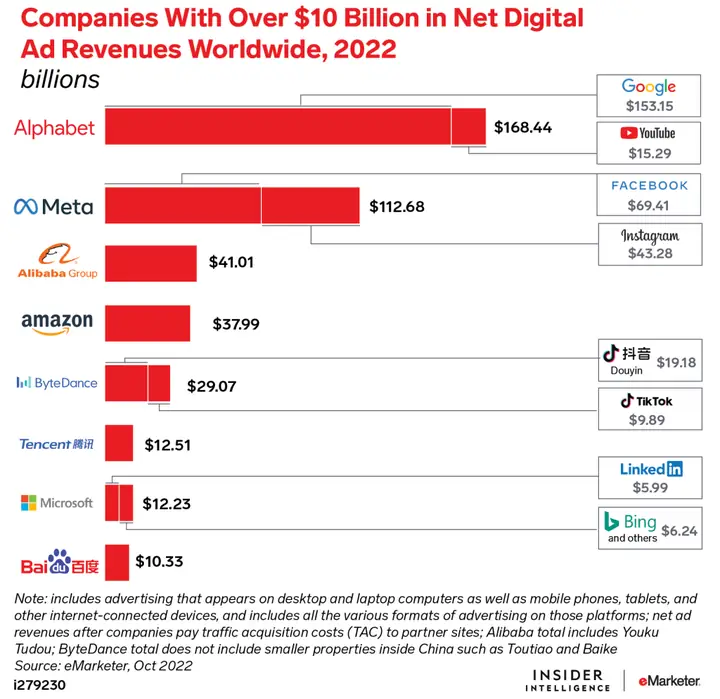
Companies with over $10B in net digital ad revenues worldwide, 2022
As we look ahead to 2022, it’s clear that the digital advertising landscape will continue to be a key driver of growth for companies across the globe. In particular, we’re seeing a significant uptick in net digital ad revenues for those organizations with over $10 billion in revenue. This trend underscores the importance of investing in digital advertising strategies that can help drive revenue growth and enhance brand visibility in an increasingly competitive marketplace. As we move forward, it will be critical for companies to stay ahead of the curve and continue to innovate in this space in order to remain competitive and drive long-term success. (billions)
Currently, Google and Meta hold the largest market shares globally, with Amazon and ByteDance showing promising growth. Although there have been gains, it is important to note that the duopoly remains dominant in the digital ad revenue market. The three main challengers are projected to only capture a mere 20.2% of the market share by 2023, which is only slightly higher than Meta’s current share. Our company’s market dominance is evident as our closest competitor, Tencent, only holds a mere 2.1% market share.
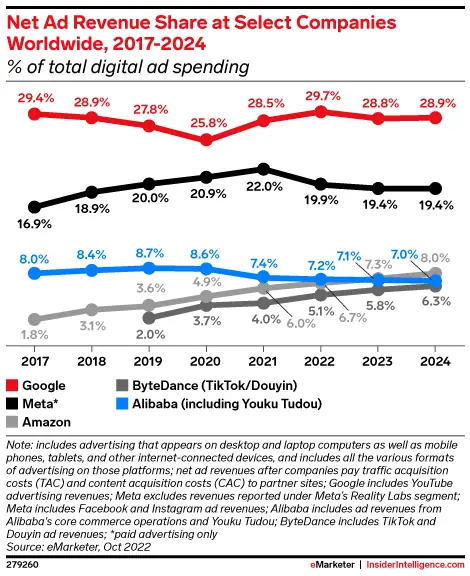
Net ad revenue share at select companies worldwide, 2017-2024
| Metric | Geography | Data Type | Unit | 2020 | 2021 | 2022 | 2023 | 2024 |
| Google search ad revenues | worldwide | US Dollar $ | Billions | $84.73 | $121.68 | $137.45 | $147.33 | $161.84 |
| Baidu search ad spending | worldwide | US Dollar $ | Billions | $6.58 | $7.09 | $7.14 | $7.22 | $7.29 |
| Microsoft search ad revenues | worldwide | US Dollar $ | Billions | $4.09 | $5.49 | $6.23 | $6.67 | $7.07 |
| Search ad spending | worldwide | US Dollar $ | Billions | $159.52 | $207.19 | $228.16 | $247.59 | $274.18 |
| Google search ad revenue growth | worldwide | % change | Percent | 5.2% | 43.6% | 13.0% | 7.2% | 9.8% |
| Baidu search ad spending growth | worldwide | % change | Percent | -11.4% | 7.7% | 0.7% | 1.1% | 1.0% |
| Microsoft search ad revenue growth | worldwide | % change | Percent | -6.2% | 34.0% | 13.6% | 7.0% | 6.0% |
| Search ad spending growth | worldwide | % change | Percent | 12.0% | 29.9% | 10.1% | 8.5% | 10.7% |
| Google search ad revenues (% of total search ad spending) | worldwide | Share | Percent | 53.1% | 58.7% | 60.2% | 59.5% | 59.0% |
| Baidu search ad spending (% of search ad spending) | worldwide | Share | Percent | 4.1% | 3.4% | 3.1% | 2.9% | 2.7% |
| Microsoft search ad revenues (% of total search ad spending) | worldwide | Share | Percent | 2.6% | 2.6% | 2.7% | 2.7% | 2.6% |
| Meta display ad revenues | worldwide | US Dollar $ | Billions | $84.17 | $114.93 | $112.68 | $121.90 | $134.72 |
| Google display ad revenues | worldwide | US Dollar $ | Billions | $19.16 | $27.31 | $30.99 | $33.25 | $39.20 |
| Baidu display ad spending | worldwide | US Dollar $ | Billions | $2.69 | $3.17 | $3.19 | $3.26 | $3.41 |
| Microsoft (LinkedIn) display ad spending | worldwide | US Dollar $ | Billions | $2.43 | $3.83 | $4.51 | $5.27 | $6.88 |
| Twitter display ad revenues | worldwide | US Dollar $ | Billions | $3.15 | $4.46 | $4.67 | $4.74 | $4.79 |
| ByteDance TikTok/Douyin display ad revenues | worldwide | US Dollar $ | Billions | $15.00 | $20.85 | $29.07 | $36.20 | $44.05 |
| Display ad spending | worldwide | US Dollar $ | Billions | $223.85 | $293.00 | $316.67 | $355.77 | $397.57 |
| Meta display ad revenue growth | worldwide | % change | Percent | 20.8% | 36.6% | -2.0% | 8.2% | 10.5% |
| Google display ad revenue growth | worldwide | % change | Percent | 17.6% | 42.6% | 13.5% | 7.3% | 17.9% |
| Baidu display ad spending growth | worldwide | % change | Percent | 2.0% | 17.9% | 0.7% | 2.1% | 4.8% |
| Microsoft (LinkedIn) display ad spending growth | worldwide | % change | Percent | 40.6% | 57.2% | 17.8% | 16.8% | 30.7% |
| Twitter display ad revenue growth | worldwide | % change | Percent | 7.4% | 41.3% | 4.9% | 1.4% | 1.0% |
| ByteDance TikTok/Douyin display ad revenue growth | worldwide | % change | Percent | 111.4% | 39.0% | 39.4% | 24.5% | 21.7% |
| Display ad spending growth | worldwide | % change | Percent | 20.3% | 30.9% | 8.1% | 12.3% | 11.7% |
| Meta display ad revenues (% of total display ad spending) | worldwide | Share | Percent | 37.6% | 39.2% | 35.6% | 34.3% | 33.9% |
| Google display ad revenues (% of total display ad spending) | worldwide | Share | Percent | 8.6% | 9.3% | 9.8% | 9.3% | 9.9% |
| Baidu display ad spending (% of display ad spending) | worldwide | Share | Percent | 1.2% | 1.1% | 1.0% | 0.9% | 0.9% |
| Microsoft (LinkedIn) display ad spending (% of display ad spending) | worldwide | Share | Percent | 1.1% | 1.3% | 1.4% | 1.5% | 1.7% |
| Twitter display ad revenues (% of total display ad spending) | worldwide | Share | Percent | 1.4% | 1.5% | 1.5% | 1.3% | 1.2% |
| ByteDance TikTok/Douyin display ad revenues (% of total display ad spending) | worldwide | Share | Percent | 6.7% | 7.1% | 9.2% | 10.2% | 11.1% |
| Google ad revenues | worldwide | US Dollars $ | Billions | $103.88 | $148.99 | $168.44 | $180.59 | $201.05 |
| YouTube ad revenues | worldwide | US Dollars $ | Billions | $9.51 | $13.90 | $15.29 | $17.00 | $19.71 |
| Meta ad revenues | worldwide | US Dollars $ | Billions | $84.17 | $114.93 | $112.68 | $121.90 | $134.72 |
| Facebook ad revenues | worldwide | US Dollars $ | Billions | $56.09 | $72.75 | $69.41 | $71.32 | $75.11 |
| Instagram ad revenues | worldwide | US Dollars $ | Billions | $28.08 | $42.18 | $43.28 | $50.58 | $59.61 |
| Yahoo ad revenues | worldwide | US Dollars $ | Billions | $4.84 | $5.03 | $5.15 | $5.26 | |
| Microsoft ad revenues | worldwide | US Dollars $ | Billions | $7.42 | $10.51 | $12.23 | $13.67 | $16.03 |
| LinkedIn ad revenues | worldwide | US Dollars $ | Billions | $3.33 | $5.02 | $5.99 | $7.00 | $8.96 |
| IAC ad revenues | worldwide | US Dollars $ | Billions | $0.66 | $0.89 | $1.32 | $1.39 | $1.50 |
| Verizon Media ad revenues | worldwide | US Dollars $ | Billions | $4.25 | ||||
| Amazon ad revenues | worldwide | US Dollars $ | Billions | $19.77 | $31.16 | $37.99 | $45.72 | $55.99 |
| Pandora ad revenues | worldwide | US Dollars $ | Billions | $1.18 | $1.54 | $1.62 | $1.68 | $1.74 |
| Twitter ad revenues | worldwide | US Dollars $ | Billions | $3.15 | $4.46 | $4.67 | $4.74 | $4.79 |
| Yelp ad revenues | worldwide | US Dollars $ | Billions | $0.84 | $0.99 | $1.06 | $1.13 | $1.20 |
| Snapchat ad revenues | worldwide | US Dollars $ | Billions | $2.16 | $3.39 | $3.97 | $4.73 | $5.81 |
| Pinterest ad revenues | worldwide | US Dollars $ | Billions | $1.69 | $2.58 | $2.74 | $3.20 | $3.71 |
| Reddit ad revenues | worldwide | US Dollars $ | Billions | $0.17 | $0.32 | $0.38 | $0.44 | $0.53 |
| Spotify ad revenues | worldwide | US Dollars $ | Billions | $0.88 | $1.43 | $1.58 | $2.03 | $2.53 |
| Apple ad revenues | worldwide | US Dollars $ | Billions | $3.62 | $5.07 | $7.06 | $8.92 | $10.69 |
| Roku ad revenues | worldwide | US Dollars $ | Billions | $0.85 | $1.68 | $2.23 | $2.74 | $3.48 |
| ByteDance TikTok/Douyin ad revenues | worldwide | US Dollars $ | Billions | $15.00 | $20.85 | $29.07 | $36.20 | $44.05 |
| TikTok ad revenues | worldwide | US Dollars $ | Billions | $1.41 | $3.88 | $9.89 | $14.15 | $18.49 |
| Alibaba ad revenues | worldwide | US Dollars $ | Billions | $34.68 | $38.64 | $41.01 | $44.53 | $48.91 |
| Baidu ad revenues | worldwide | US Dollars $ | Billions | $9.27 | $10.26 | $10.33 | $10.48 | $10.70 |
| SINA ad revenues | worldwide | US Dollars $ | Billions | $1.60 | $2.08 | $2.09 | $2.15 | $2.21 |
| Tencent ad revenues | worldwide | US Dollars $ | Billions | $11.92 | $12.47 | $12.51 | $12.99 | $13.56 |
| JD.com ad revenues | worldwide | US Dollars $ | Billions | $5.37 | $7.01 | $7.79 | $8.67 | $9.68 |
| Kuaishou ad revenues | worldwide | US Dollars $ | Billions | $3.39 | $6.61 | $8.37 | $10.61 | $13.37 |
| Meituan ad revenues | worldwide | US Dollars $ | Billions | $2.86 | $4.42 | $5.11 | $5.92 | $6.83 |
| Other companies digital ad revenues | worldwide | US Dollars $ | Billions | $84.63 | $87.36 | $88.19 | $97.29 | $97.62 |
| Digital ad spending | worldwide | US Dollars $ | Billions | $ 403.42 | $ 522.50 | $ 567.49 | $ 626.86 | $ 695.96 |
Ad revenues by companies, 2020-2024
Growth projections for ad platforms by ad revenue
Our focus is on the net ad revenue share at select companies worldwide from 2017 to 2024, presented as a percentage of total digital ad spending.
Various companies are experiencing significant declines in growth, not just Google and Meta. Most of the prominent entities in China, excluding TikTok, are currently experiencing a significant downturn. The impact of China’s recent regulatory measures and economic challenges has been significant for both Alibaba and Baidu. Meituan’s growth rate remains positive, albeit at a reduced pace. Douyin, our esteemed domestic champion, is presently undergoing a natural transition from its previously explosive growth phase.
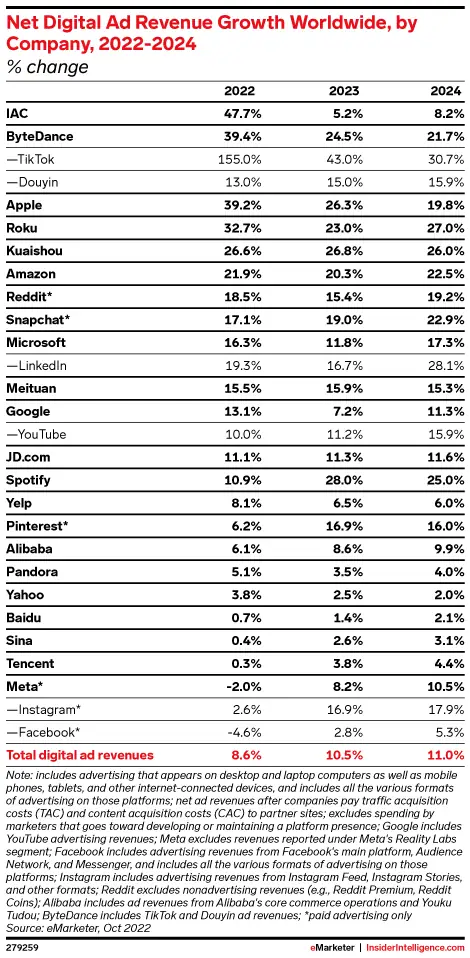
% of change in Net digital ad revenue growth worldwide by company, 2022, 2024
While TikTok’s growth was significant, it fell short of expectations in 2022. The industry media has rightfully highlighted TikTok’s underperformance in 2022, which serves as a clear indication of the challenges faced by social media advertising. Our latest projections for TikTok have been downgraded by $1.75 billion. TikTok’s global revenues have experienced a remarkable growth of 155.0% in 2022, reaching an impressive $9.89 billion. Looking ahead, we expect a further increase of 43.0% in 2023, with revenues expected to reach $14.15 billion. It is important to emphasize that this growth trajectory does not show any form of crisis.
Regrettably, Twitter is conspicuously absent from the charts presented below. The current state of Twitter’s privatization, the Elon Musk controversy, and the ongoing advertiser relations fiasco make it difficult to project confidently for 2023 and 2024. Based on our projections, Twitter is expected to generate $4.67 billion in global ad revenues in 2022, representing a 4.9% growth from the previous year. We have projected figures for 2023 and beyond, however, I advise caution to potential buyers.
We anticipate a significant increase in global net digital ad revenue growth from 2022 to 2024, as per our projections for various companies.
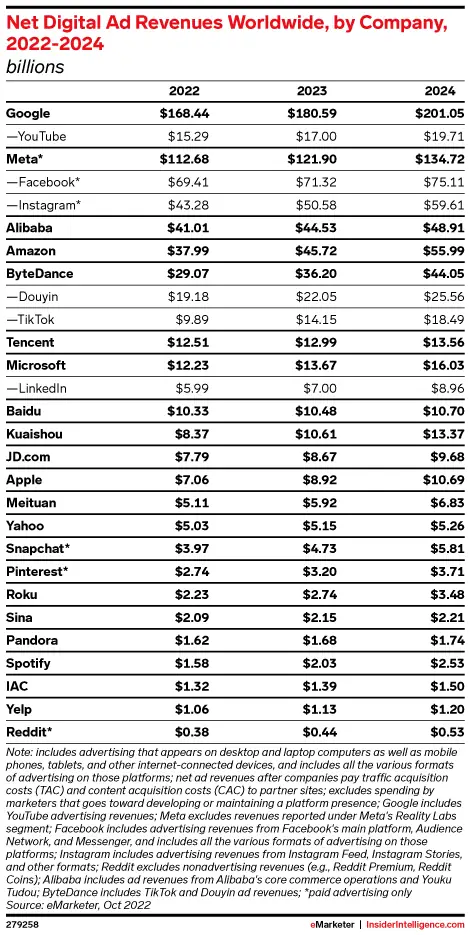
Total Net digital ad revenue growth worldwide by company, 2022, 2024
Our projections indicate a significant resurgence in Instagram’s growth trajectory by 2023, while other platforms may not experience a similar upswing. We anticipate a promising acceleration for Pinterest and Spotify this year, while Instagram’s robust performance in 2023 and 2024 will undoubtedly bolster Meta’s overall growth trajectory. We anticipate that the majority of players will maintain a stable position within the current slow to medium-growth climate.
Our projections indicate that Google is poised to become the foremost advertising company to reach the $200 billion milestone by 2024. Once achieved, the ad revenue lead on Meta will surpass that of any other individual ad publisher globally, amounting to a staggering $66.33 billion. The market’s balance of power is expected to shift significantly towards one player in the duopoly.
We shall be closely monitoring the net digital ad revenues worldwide, segmented by company, for the years 2022 through 2024. (billions)
Spotify has successfully secured a place in our global rankings as the only digital ad publisher outside of the United States and China. Our projections indicate that the ad revenues of the Swedish digital audio company will exceed $2 billion by 2023 and will further escalate to $2.53 billion by 2024. Although the figures are a downward revision from our previous projections, they still represent a healthy growth trajectory. Check out our podcast statistics compilation to see how Spotify relies on podcast advertising.
Impact of ad spend forecast on marketing strategies
The majority of global advertising expenditure is concentrated in the United States and China, both of which experienced significant growth declines in 2022. The challenging market conditions have resulted in a tumultuous year for numerous ad industry stakeholders and analysts. In the grand scheme of things, the year 2022 was relatively favorable on a global level, especially when compared to past events. It is imperative to note that stabilization of growth is projected for the year 2023.
While a worldwide ad market may not exist, there are several key insights that can be derived from this collection of projections.
We should avoid overreacting to the 2022 downshift.
During challenging times, it may seem prudent to cut back, however, it is important to note that the decline in advertising expenditures is expected to be of a brief nature. It is imperative for marketers to steer clear of any setbacks as the industry gains momentum once again.
While we may not see a resurgence in digital ad spending growth to previous levels, it is important to note that the total amount of new funds allocated to this area will remain in the tens of billions annually. We anticipate that the forthcoming years of 2023 and 2024 will exhibit a sense of stability akin to the years of 2018 and 2019. We need to return to our standard operations.
It is unlikely that China will resume its role as a growth catalyst, while the United States may potentially assume this position.
The United States market has consistently served as the bedrock of worldwide advertising expenditure. Therefore, any misstep within the US market has the potential to cause significant concern throughout the industry. I am pleased to report that our projections indicate that US ad spending growth will surpass the global average in the coming years, with a further acceleration expected in 2024. The situation in China, regrettably, presents a limited scope for positivity. Moving forward, it is anticipated that China’s advertising expenditure will persist in its underperformance.
It is advisable for marketers to persevere through the challenging times in developed markets. The European market is poised for a resurgence, however, the United States is anticipated to generate a greater influx of fresh capital.
The current scenario is characterized by a certain degree of ambiguity due to the fluctuations in exchange rates and rampant inflation.
Assessing the global health of the advertising industry is a complex task, as it is subject to the volatile fluctuations of local currencies and the soaring price hikes experienced in various nations. The state of ad spending in various nations may not be accurately reflected due to the prevailing strength of the US dollar. Inflationary pressures in various nations have resulted in a distortion of reality in the diametrically opposite direction. Simultaneous occurrences of both phenomena are being observed across various regions of Europe.
We anticipate that 2023 will provide greater clarity on the matter at hand. We anticipate a reduction in inflation, stabilization of the US dollar, and a modest rebound in ad spending growth, despite the persistently challenging economic climate. Moving forward, we can expect relative growth rates to accurately reflect the unique disparities among countries and regions.
Latin America and India have emerged as significant players among the emerging markets.
Latin America and India, along with Southeast Asia occasionally, have been identified as the future for quite some time. Looking ahead to 2023, we can confidently say that the future will have arrived. It is noteworthy that India is poised to make a significant impact in the global ad spending arena by securing a spot in the top 10, while Brazil has already secured the ninth position. Latin America is poised to surpass North America, Europe, and Asia-Pacific in digital advertising for the foreseeable future.
The scale of spending in these countries and regions is not yet at par with that of the US, China, and Western Europe. The current dynamism exhibited by their locality surpasses all others, and the overall expenditure involved has attained global significance. It is imperative that our marketing team prioritizes these regions with immediate effect.
Digital ad spend statistics: frequently asked questions
How much is spent on advertising worldwide in 2026?
WARC forecasts $1.34 trillion in 2026, up 11.9% (October 2026). WPP Media forecasts $1.3 trillion, up 8.9%, excluding US political ads (June 2026). dentsu and Magna, using narrower definitions, put the market just above $1 trillion. Totals differ because each forecaster defines the market differently.
What percentage of ad spend is digital?
About 69% to 73%. dentsu forecasts digital at 68.7% of global ad spend in 2026. Magna put digital pure players such as Google, Meta and Amazon at about 73% of ad sales in 2025.
How much is spent on digital advertising in the US?
US internet advertising revenue was $294.6 billion in 2025, up 13.9% from $258.6 billion in 2024, according to the IAB/PwC Internet Advertising Revenue Report published in April 2026. The IAB forecasts total US ad spend growth of 12.3% in 2026.
Which is bigger, social media or search advertising?
Social media. Globally WARC forecasts $394.6 billion for social in 2026 against $295.7 billion for search. In the US, social ad revenue ($117.7 billion) overtook search ($114.2 billion) for the first time in 2025 (IAB/PwC).
How much does Google make from advertising?
Google's advertising revenue was $294.7 billion in 2025, up 11.4%: $224.5 billion from Search and other, $40.4 billion from YouTube ads and $29.8 billion from Google Network (Alphabet 10-K). In July to September 2026 it was $82.0 billion, up 10.6%.
How much does Meta make from advertising?
Meta's advertising revenue was $196.2 billion in 2025, up 22.1%, and $63.1 billion in July to September 2026, up 26%. In that quarter ad impressions rose 10% and the average price per ad rose 14%.
How big is Amazon's advertising business?
Amazon's advertising services revenue was $68.6 billion in 2025, up 22.1% from $56.2 billion, and $19.6 billion in July to September 2026. Over the four quarters to September 2026 it was $78.0 billion.
How big is retail media?
WARC forecasts $202.1 billion of retail media spend worldwide in 2026, up 14.3%, which is larger than TV ($176.2 billion). In the US, commerce media revenue was $63.4 billion in 2025, up 18% (IAB/PwC).
How much is spent on connected TV advertising?
The IAB projects US CTV ad spend of $29.3 billion in 2026, within $81.9 billion of US digital video advertising. Its September 2026 forecast expects CTV to grow 15.6%, while linear TV falls 1.5%.
How much of B2B ad budgets goes to LinkedIn?
41%, according to Dreamdata's 2026 benchmarks, up two points in a year. In the Kiin Labs panel of 1,000+ B2B advertiser accounts the median LinkedIn advertiser pays $36.23 CPM, $164 per content lead and $350 per demo request lead.
What happened to The B2B House digital ad spend page?
The B2B House is now part of Kiin. Its digital ad spend statistics are on this page, with every figure it published kept in the section "Figures previously published by The B2B House", next to the 2026 figure.
How we built this page, and every source
We started from every statistic in The B2B House guide and every claim that other sites link to it for (we checked its backlinks one by one). For each, we looked for the newest figure from the original publisher first: company annual reports (10-Ks) and earnings releases on SEC EDGAR and investor relations sites, the IAB/PwC report and IAB press releases, and the forecasters' own releases (WARC, WPP Media, dentsu). Where a forecaster's full report is not public, we used trade press that reported its tables and say so next to the figure. We opened each source page on 14 November 2026 and copied the figure from it. Where there is no update we say so and keep the old figure with its date. Kiin's own advertising figures come from the Kiin Labs panel, described in our method note. Spotted an error? Tell Phil Ilic and we will correct it.
- WARC Media, Global Ad Spend Outlook Q3 2026 (October 2026)
- PPC Land, WARC channel table, Q3 2026
- The Desk, WARC forecast detail, October 2026
- WARC, Global Ad Forecast Q4 2025 update, 11 Dec 2025
- WPP Media, This Year Next Year midyear 2026 release, 16 Jun 2026
- WPP Media, This Year Next Year midyear 2026 report page
- MediaCat, WPP Media midyear forecast coverage, 16 Jun 2026
- Mi3, WPP Media midyear forecast coverage, 19 Jun 2026
- dentsu, Global Ad Spend Forecasts, 3 Dec 2025
- Marketing Dive, Magna global ad forecast summer update, 17 Jun 2025
- IAB/PwC Internet Advertising Revenue Report, Full Year 2025, 16 Apr 2026
- IAB/PwC Internet Advertising Revenue Report, Full Year 2024, 17 Apr 2025
- IAB 2026 Outlook Study, September update, 10 Sep 2026
- IAB, 2026 Digital Video Ad Spend and Strategy, 5 May 2026
- MarTech, IAB digital video segment figures
- Alphabet Form 10-K, fiscal 2025
- Alphabet Q3 2026 earnings release, 28 Oct 2026
- Meta, Fourth Quarter and Full Year 2025 Results, 28 Jan 2026
- Meta, Third Quarter 2026 Results, 21 Oct 2026
- Amazon Form 10-K, fiscal 2025
- Amazon Q3 2026 earnings release
- Amazon, Q3 2026 earnings summary, 29 Oct 2026
- Microsoft Form 10-K, fiscal 2026
- Microsoft FY27 Q1 earnings release, 28 Oct 2026
- Microsoft FY26 Q4 earnings release, 29 Jul 2026
- PPC Land, Microsoft's new search and advertising line
- LinkedIn, Q4 FY26 earnings and business highlights, 29 Jul 2026
- LinkedIn, Q1 FY27 business highlights, 28 Oct 2026
- LinkedIn, FY22 Q4 business highlights, 26 Jul 2022
- Dreamdata, 2026 LinkedIn Ads Benchmarks Report (March 2026)
- Reddit, Third Quarter 2026 Results
- Snap, Third Quarter 2026 Financial Results
- Pinterest, Third Quarter 2026 Results
- Kiin Labs, LinkedIn Ads Benchmarks 2026, Report No. 4 and 150 LinkedIn Ads Statistics
Ilic, P. (2026). Digital Ad Spend Statistics 2026: How Much Is Spent on Ads, and Where? Kiin Labs (incorporating The B2B House). kiin.co/research/digital-ad-spend-statistics. Free to cite with a link.
Spending part of that $1.34 trillion on B2B buyers? Send read access to your LinkedIn Ads account and we'll show you where it sits against 1,000+ connected accounts, content and demo, on every metric. Free, read-only, one page.