
LinkedIn defines a lead gen form open as "the count of times users opened the lead form" and a lead as "the count of leads generated" through it (LinkedIn Marketing API reporting schema (Microsoft Learn)); completion rates here are leads divided by opens. For context on why most of a market will not respond to any ad this quarter: LinkedIn's B2B Institute estimates 95% of potential buyers are not ready to buy today (The 95-5 Rule, LinkedIn B2B Institute).
One-stat pages to cite or embed: form completion, 2% in the feed vs 40% in the inbox, the cost of a demo on LinkedIn ($350).
The largest independent dataset on LinkedIn lead gen forms we know of: 4,010 lead-generation-objective campaigns and 4,875 forms. Every benchmark is a median across advertiser accounts, never a pooled total; every "X is cheaper than Y" is the same advertiser running both, paired within account. Content offers and demo requests are reported side by side in every table, because a blended cost per lead is a number nobody can use.
Ilic, P. (2026). LinkedIn Lead Gen Forms Benchmarks 2026. Kiin Labs. kiin.co/research/linkedin-lead-gen-forms-benchmarks. Figures are medians across advertiser accounts and paired within-account comparisons, USD, 8 Sep 2025 to 7 Sep 2026, content and demo offers reported separately. Free to cite with a link.
This study comes from Kiin Intelligence, the analytics layer behind Kiin, a London LinkedIn Ads agency with three ex-LinkedIn Marketing Solutions staff and 200+ B2B accounts under management.
See where your account sits. Send read access to your LinkedIn Ads account and we'll show you, content and demo, against every table in this report.Free. Read-only access. No deck, no call, one page.
For demo, call, audit and trial forms specifically, Report No. 4: The Cost of a Demo on LinkedIn takes the demo-request half of this panel (268 advertisers, $8.25M, 20,277 demo leads) and goes deeper: the median demo lead is $350 and a quarter of accounts pay under $161; inbox vs feed is −57% in the same account; the accounts that pay most spend the same per month as the ones that pay least. Cite this report for content vs demo side by side; cite Report No. 4 for demo asks on their own. The demo figures differ because the samples do: this report's $343 median and $131 top quarter come from 115 accounts in the snapshot frozen on 15 Sep 2026, while Report No. 4 counts the 155 accounts with five or more demo leads in a 21 Sep 2026 snapshot, with campaigns under $100 removed.
- ▶Everyone averages the cost of a lead. We split it.
- ▶The six findings that carry the report
- ▶How Kiin runs lead gen forms now: 13 rules
- 00The panel, the star key, and how to read the numbers
- 01What a lead costs: LinkedIn cost per lead benchmarks, cut twelve ways
- 02Content or demo: form conversion rate and what explains CPL
- 03Which format carries the form: documents, the inbox, video, landing pages
- 04Inside the form: fields, phone numbers, form copy
- 05Audiences: lists, retargeting, cold, and who submits
- 06The spend floor: budget, time to first lead, zero-lead months
- 07Fatigue, ad copy and the calendar
- 08The cheapest and the dearest: deciles, and CPL by seniority of the lead
- 09Measurement and benchmarks: what good looks like
- 10Twenty-two numbers to quote
- 11Sixteen myths, with the verdict
- —Glossary
- —Method and what we can't answer
- —Questions this report answers
Everyone averages the cost of a lead. We split it.
Ask ten agencies what a LinkedIn lead costs and you get ten numbers between $50 and $500, every one of them an average of two things that should never be averaged: a download and a meeting. A guide behind a form and a demo request behind a form are different products with different prices, and blending them produces a benchmark nobody can use. So this report does not blend them. Content offers and demo requests sit side by side in every table, by industry, function, seniority, company size, region, format, audience and budget.
It is the third Kiin Labs report, and it is built the way the first and the second were. Every number is a median across advertiser accounts, never a pooled total that the biggest spenders drag around. Every "X is cheaper than Y" is the same advertiser running both, so the comparison is inside one account and not between two kinds of advertiser. Where those two views disagree, and they do four times, the report says so on the page.
What surprised us: a demo form converts at 2% in the feed and 40% in a message ad. Half the difference in cost per lead between accounts is how many people finish the form. Uploaded lists, which are 42% of all lead gen spend, are the dearest audience, and retargeting is a tie with cold. A phone number field costs two thirds of your completions. Audience size does nothing. And the senior leads, the ones everyone assumes are expensive, are the cheapest leads in the campaign.
What we cannot yet say is whether the leads turn into pipeline. That needs form submissions joined to CRM contacts, and it is the next chapter of this report, not this one. Cost is what the platform can prove today, so cost is what this report is about.
Use the tables. Cite the numbers. Tell us where we are wrong.
Phil Ilic
Co-founder and CEO, Kiin · London, September 2026
The six findings that carry the report
Per-account medians and paired within-account comparisons. Each links to the chapter it rests on.
Everything else in the report follows from these six. The ask sets the price, the form sets the cost, the format carries the form, the audience is not the lever people think it is, and the budget floor is an offer question. Chapters 01 to 09 show the tables behind each one.
How Kiin runs lead gen forms now: thirteen rules
The findings are what the data says. These are the decisions we took from it, the operating rules on every lead gen campaign we run. Each is tied to the finding or chapter it rests on.
Never a demo ask in the feed with a form
Demo asks go in a message ad or a conversation ad, or behind a content offer first.
Findings 01, 04 →Judge the campaign on completion rate
It is half the price. CTR is a fifth.
Finding 02 →Documents for content, never for demo
A document trades opens for completions and wins by a fifth.
Chapter 03 →Phone number only when sales will dial it
Expect to lose two thirds of completions.
Chapter 04 →$25 to 50 a day for content, $100 a day for demo
Below that, do not expect a lead a week. Even at $100 to 250 a day, demo gets one in fewer than half of months.
Chapter 06 →Refresh on completion rate, around week four
CPM will not warn you: it falls while cost per lead rises.
Chapter 07 →Cold before lists
A list pays a CPM premium from day one and burns out a month faster. Refresh any list under 10,000 monthly. Retargeting is a tie, not a discount.
Chapter 05 →Job titles over function plus seniority, and fewer titles rather than more
A seniority filter costs nothing extra and the senior leads are the cheap ones. Filter up without fear.
Chapters 05 and 08 →Do not open with a question. Do not name the audience by title
Say what the offer is in the first line.
Chapter 07 →Use the form, not the landing page, unless the offer is a meeting
Same account, the form is 55% cheaper per lead; 82% on content.
Chapter 03 →Size the budget to the audience
Under $2 a day per 1,000 members, and widen the audience before raising the daily budget.
Chapter 06 →Weekends and December stay on
Sunday is the cheapest day. December CPM is up 16% and CPL is flat.
Chapter 07 →Report completion, cost per form open and cost per lead, split by what the form asks for
Never a blended CPL.
Chapter 09 →
The panel, the star key, and how to read the numbers
4,010 campaigns, 489 accounts, $13.6M, 86,051 leads. Twenty-four accounts are half the spend, which is why every figure is a median across accounts and every comparison is paired within one.
4,010 lead-generation-objective campaigns with delivery, 489 advertiser accounts, $13.6M, 86,051 form submissions from 572,814 form opens, 8 Sep 2025 to 7 Sep 2026, 14 currencies converted to USD at September 2026 rates. Among accounts that run lead gen forms, the objective is 42% of their LinkedIn spend, and the median account puts half its budget there. Lead type comes from the form itself (headline, description, CTA, thank-you text), not the campaign name: content offers are 36% of spend, demo or sales-call offers 39%.
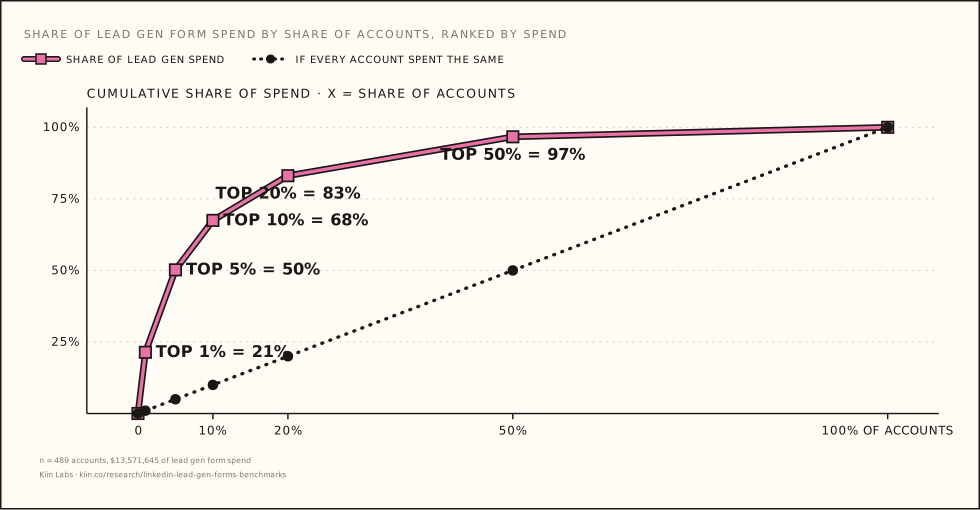
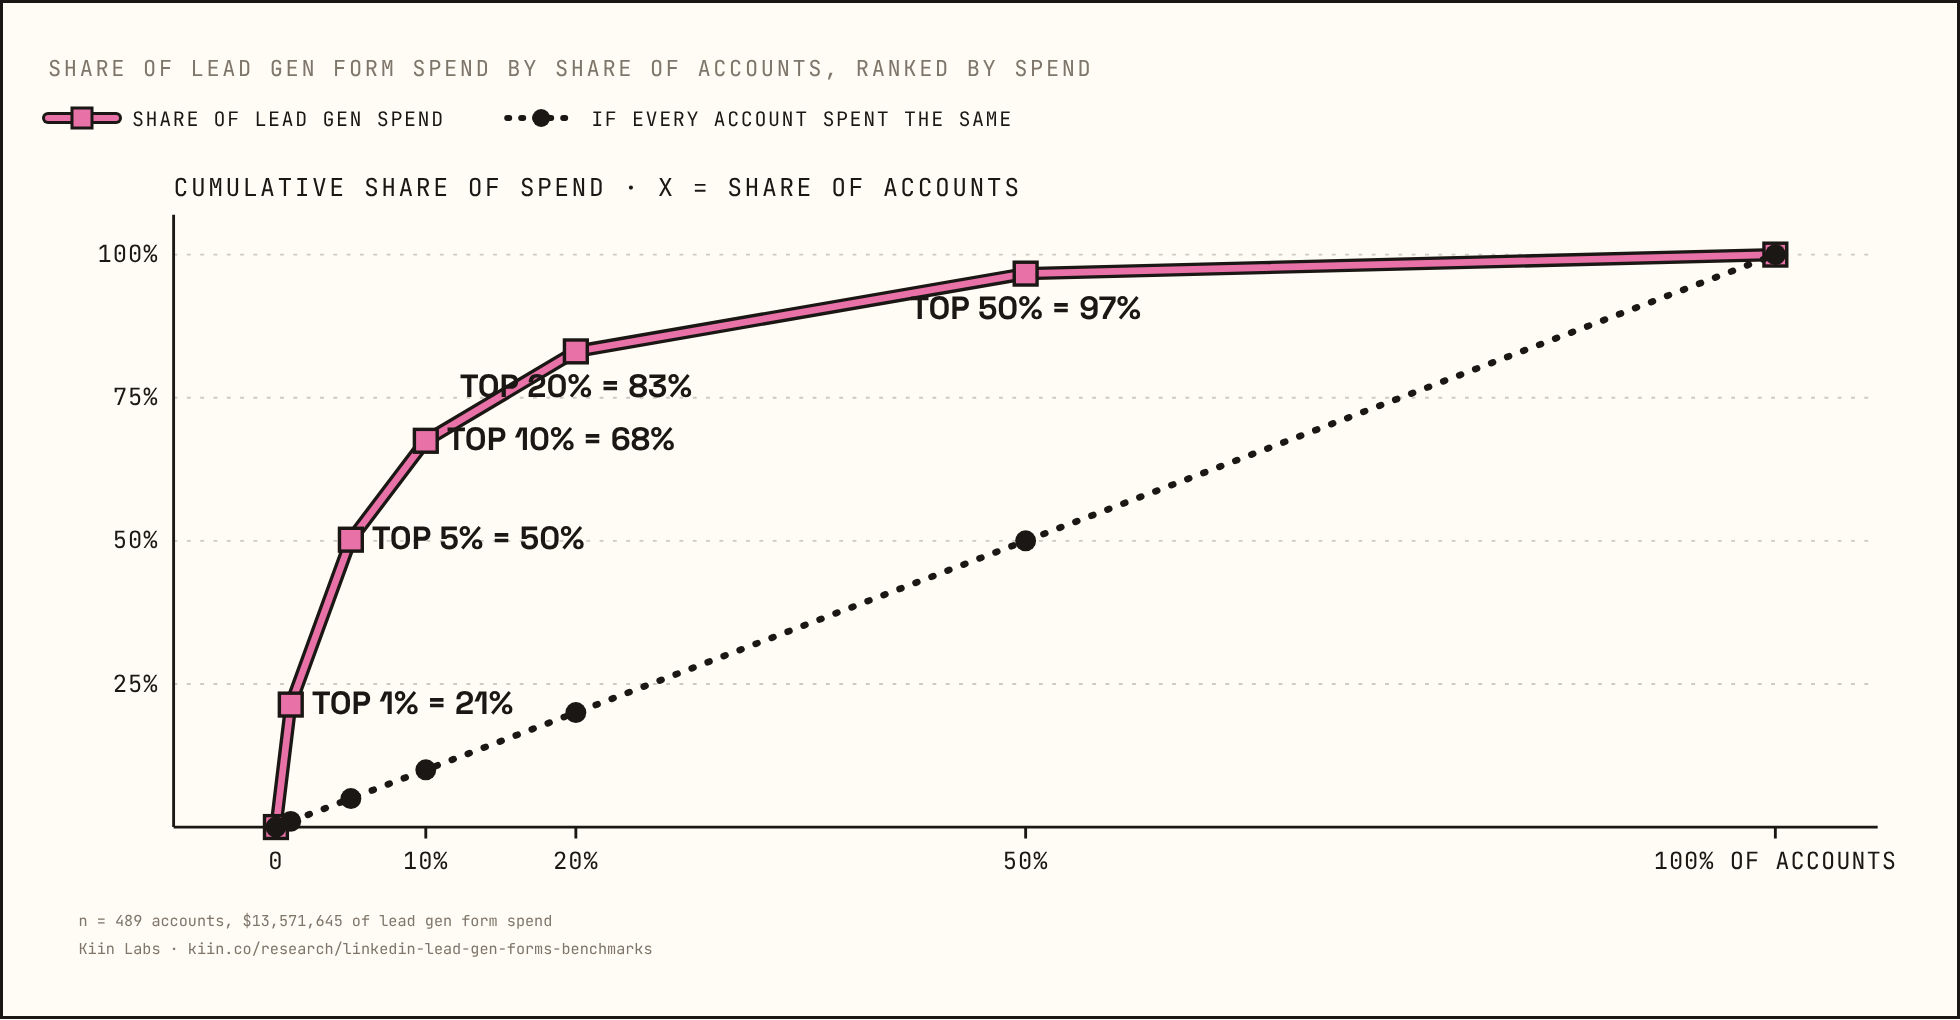
The panel is top-heavy, as every LinkedIn panel is. Pooled figures would describe the 24 accounts at the top. Every number in this report is the median advertiser, and every comparison is the same advertiser running both settings, so the big accounts count once each, like everyone else.
Star key
| ★★★ | paired within account, 100 or more accounts |
| ★★ | paired within account, 25 to 100 accounts |
| ★ | paired, under 25 accounts, or directional |
| ✱ | the 95% interval excludes zero |
| ns | not significant: the interval includes no change |
Descriptive numbers carry the number of accounts and no star. No cell with fewer than seven accounts is shown. Benchmark tables say what advertisers who target X pay, not what targeting X does to your cost; where a paired check exists it is stated in the same breath, and four times it disagrees with the table.
LinkedIn cost per lead benchmarks 2026, cut twelve ways
The median lead gen form lead costs $185. That number is useless, and this chapter is about why. Twelve cuts, every one content and demo side by side, with the paired check in the same breath.
Split by what the form asks for, $185 becomes $164 for a content offer and $343 for a demo request, and every cut below moves those two numbers differently. The cheapest content lead in the panel costs $9 (LATAM); the dearest demo lead $1,025 (a thought leader ad asking for a demo). Between those sit twelve tables. Use the one that matches your account, and read the paired note under it before you change anything.
1. The distribution
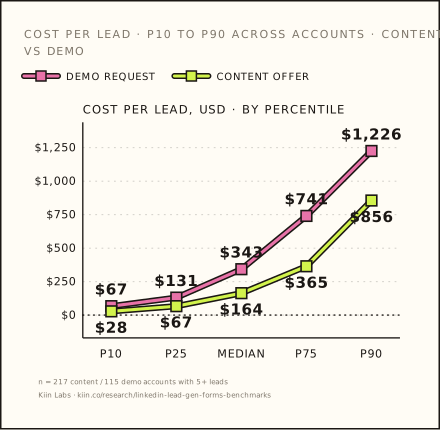
| Cost per lead, median account | p10 | p25 | Median | p75 | p90 | Accounts |
|---|---|---|---|---|---|---|
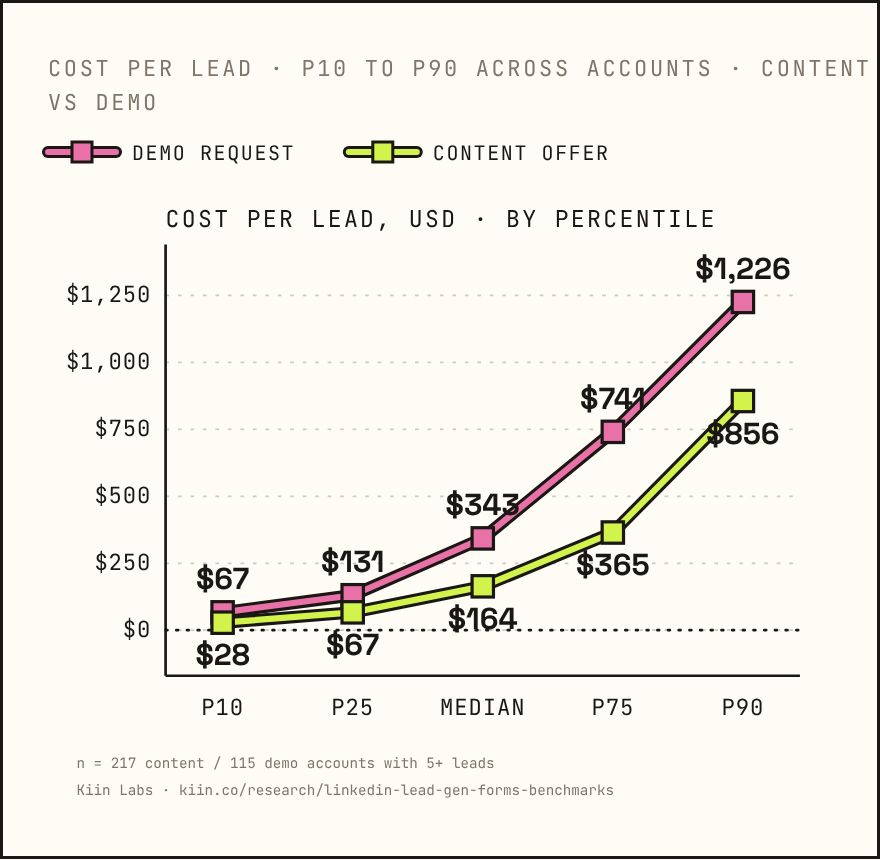
| All forms | $38 | $80 | $185 | $447 | $892 | 341 |
| Content offers | $28 | $67 | $164 | $365 | $856 | 217 |
| Demo requests | $67 | $131 | $343 | $741 | $1,226 | 115 |
Pooled (spend ÷ leads) is $99 content and $424 demo; pooled figures are dominated by the 34 accounts over $100k and are not quoted. Paired in the 50 accounts running both: demo +51% [−5%, +148%], dearer in 30 of 50, ★★ ns. If you want a "good" number: the top quarter of content accounts is under $67 a lead; the top quarter of demo accounts under $131.
2. By what the form asks for
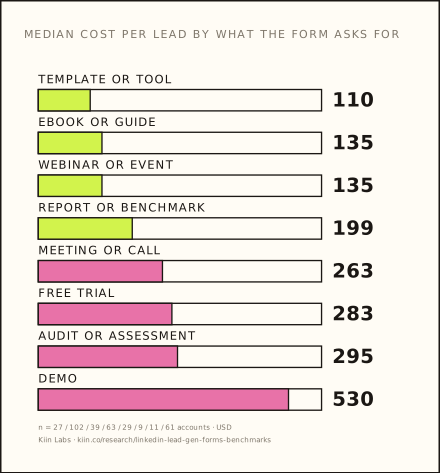
| Offer | Accounts | Median CPL |
|---|---|---|
| Template or tool | 27 | $110 |
| Ebook or guide | 102 | $135 |
| Webinar or event | 39 | $135 |
| Report or benchmark | 63 | $199 |
| Meeting or call | 29 | $263 |
| Free trial | 9 | $283 |
| Audit or assessment | 11 | $295 |
| Demo | 61 | $530 |
A 4.8× spread from the cheapest ask to the dearest. Within content, nothing separates the sub-types inside one account (ebook vs webinar −25%, ebook vs report −9%, template vs ebook −21%, all ns, ★); the offer type sets the price, the flavour of content does not. Within demo, meeting or call is not cheaper than demo in the same account (n = 3, directional).
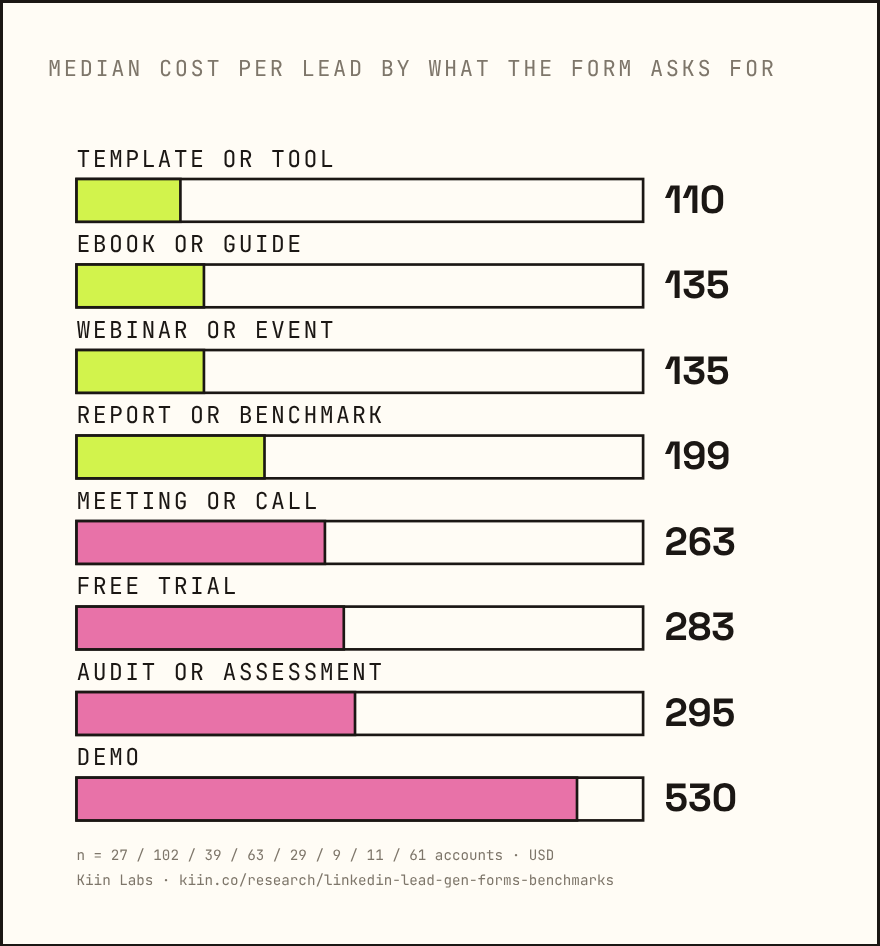
We quote the 2.1× content-to-demo gap as a market fact and the +51% as what one advertiser should expect when they switch offers. A blended cost per lead benchmark is meaningless: it tells you the mix of offers in someone else's panel. When a client asks "is $250 a lead good", our first question is "for what".
3. By job function targeted
| Function | Content | Demo |
|---|---|---|
| Human Resources | $67 (16) | withheld |
| Consulting | $68 (11) | withheld |
| Entrepreneurship | $100 (11) | withheld |
| Business Development | $151 (35) | $293 (14) |
| Product Management | $163 (16) | $399 (7) |
| Information Technology | $190 (26) | $495 (21) |
| Operations | $191 (29) | $482 (20) |
| Engineering | $198 (14) | $555 (13) |
| Marketing | $210 (26) | $319 (9) |
| Finance | $211 (20) | $495 (11) |
| Sales | $223 (16) | $100 (7) |
Median CPL, accounts in brackets. Demo cells under seven accounts withheld. The spread on content is 3.3×; on demo 5.5×. Sales is the one function where a demo lead costs less than a content lead; n = 7, directional.
4. By seniority targeted
| Seniority | Content | Demo |
|---|---|---|
| Senior | $121 (45) | $451 (17) |
| Director | $123 (82) | $407 (40) |
| VP | $124 (79) | $407 (40) |
| CXO | $138 (83) | $366 (41) |
| Owner | $156 (67) | $313 (31) |
| Partner | $164 (62) | $338 (31) |
| Manager | $166 (69) | $453 (26) |
| Seniority filter | Content | Demo | Share of spend |
|---|---|---|---|
| No seniority filter | $169 (169) | $349 (95) | 72% |
| Director+ plus manager | $152 (69) | $443 (24) | 20% |
| Director+ only | $112 (36) | $276 (21) | 7% |
Seniority is flat: a C-suite lead does not cost more than a manager lead. Paired, director-and-above only vs including managers +17% [−14%, +78%], 12 of 26 ★★ ns; director-only vs no filter +29%, n = 34 ★★ ns. 72% of spend runs with no seniority filter at all.
A seniority filter is a quality decision, not a cost lever: it costs nothing extra, and 94% of leads on filtered campaigns come from inside the filter. Chapter 08 goes further: the senior leads that convert are the cheapest leads in the campaign.
5. By company size targeted
| Size filter | Content | Demo |
|---|---|---|
| SMB only (under 200) | $96 (19) | $242 (9) |
| SMB and mid (under 1k) | $117 (22) | $313 (13) |
| Mixed sizes | $145 (64) | $338 (34) |
| No size filter | $180 (146) | $374 (87) |
| Enterprise only (1k+) | $164 (17) | $647 (8) |
Enterprise-only looks 2.7× SMB-only on demo. Paired, enterprise-only vs no filter in the same account: −45%, 10 of 14, ★ ns. The table shows who targets enterprise, not what targeting enterprise costs.
6. By billing currency
| Currency | Content | Demo |
|---|---|---|
| USD | $221 (115) | $393 (83) |
| EUR | $129 (59) | $129 (12) |
| GBP | $164 (19) | $311 (7) |
CAD, DKK, BRL and CHF under seven accounts on at least one side; withheld. The demo lead in a euro account costs the same as a content lead in a euro account: a market fact about who bills in euros, not a currency effect.
7. By industry targeted
| Industry (13 of 100+ rows) | Content | Demo |
|---|---|---|
| Higher Education | $20 (7) | withheld |
| Accounting | $51 (7) | withheld |
| Legal Services | $67 (9) | withheld |
| Software Development | $81 (17) | $459 (7) |
| IT Services and IT Consulting | $83 (22) | withheld |
| Insurance | $83 (15) | withheld |
| Financial Services | $85 (33) | $224 (13) |
| Hospitals and Health Care | $90 (20) | $722 (9) |
| Technology, Information and Internet | $102 (21) | $386 (13) |
| Banking | $136 (15) | withheld |
| Construction | $151 (16) | $268 (9) |
| Manufacturing | $262 (23) | $144 (7) |
| Retail | $304 (18) | $479 (10) |
Rows at ten or more accounts; cells under seven withheld. The full table, 100-plus industries with content and demo side by side, is published as its own page: LinkedIn cost per lead by industry.
The industry page is where a first-time advertiser should start, and it is the page that gets the caveat printed largest: these are what advertisers targeting an industry pay, not what targeting that industry does to your cost.
8. By region targeted
| Region | Content | Demo |
|---|---|---|
| LATAM | $9 (7) | withheld |
| MENA | $26 (7) | withheld |
| UK | $68 (15) | $299 (7) |
| Benelux | $106 (10) | withheld |
| Nordics | $126 (12) | withheld |
| DACH | $130 (39) | withheld |
| Europe, multi-country | $144 (32) | withheld |
| US | $210 (59) | $376 (44) |
| US and Canada | $311 (37) | $559 (26) |
Europe is roughly half the US on content and the UK is a fifth cheaper on demo. Paired, US vs Europe in accounts targeting both: +12% [−12%, +51%], n = 23 ★. On content alone, US is −8%. Most of the gap is who advertises in the US, not the auction.
A content lead in LATAM costs $9. In the US, $210.
9. By monthly lead gen spend
| Account spend a month | Content | Demo |
|---|---|---|
| Under $1k | $98 (52) | $117 (21) |
| $1k to 2.5k | $140 (72) | $292 (36) |
| $2.5k to 5k | $253 (44) | $443 (26) |
| $5k to 10k | $403 (20) | $393 (9) |
| $10k to 25k | $231 (19) | $426 (14) |
| $25k and above | $401 (10) | $867 (9) |
The biggest spenders pay four times as much per lead as the smallest. That is mix (US, demo, lists, small pools); none of the paired tables show a size effect in the auction.
"You cannot do lead gen under £3k a month" is wrong for content. Accounts under $1k a month pay $98 a content lead, the cheapest band in the table. For demo, the constraint is the daily budget, not the monthly one; chapter 06 has the floor. Monthly budgets in general: how much to spend on LinkedIn Ads.
10. By audience type
| Audience | Content | Demo | Share of spend |
|---|---|---|---|
| Cold targeting | $103 (127) | $240 (47) | 38% |
| Retargeting | $188 (73) | $402 (63) | 21% |
| Uploaded list | $244 (89) | $496 (52) | 42% |
Paired, same account: list vs cold +31% [+6%, +58%] ✱ on content, 10 of 30 cheaper, ★★. Retargeting vs cold −9% [−22%, +40%], 34 of 65, ★★ ns. Lists are dearer in the table and dearer paired: a cause. Retargeting is dearer in the table and a tie paired: a description.
11. By format carrying the form
| Format | Content | Demo |
|---|---|---|
| Conversation ad | $35 (9) | $365 (60) |
| Message ad | $56 (22) | $175 (23) |
| Thought leader ad | $94 (16) | $1,025 (8) |
| Video | $119 (10) | $283 (9) |
| Document | $180 (96) | withheld |
| Single image | $189 (141) | $600 (46) |
| Carousel | withheld | withheld |
Paired within lead type: document vs single image −22% ✱ ★★ on content; conversation and message ads vs single image −49% and −40% ✱ ★ on demo; video vs single image +60% ✱ ★ overall. Chapter 03 has the mechanism.
A single image ad with a demo form: $600 a lead, 2.1% completion, 48 form opens per lead, 22% of every zero-lead month in the panel.
A list buys precision, not price: you pay a CPM premium for the certainty that the right companies see the ad. That is a fine trade for an ABM programme and a bad one for a cost-per-lead target.
12. Bid strategy, targeting method and audience size
| Comparison, paired | CPL | CPM | Accounts |
|---|---|---|---|
| Enhanced conversion vs max delivery | −18% ns | −19% ns | 24 ★ / 38 ★★ |
| Cost cap vs max delivery | −60% | −19% | 4, too few |
| Audience expansion on vs off | −6% ns | −10% ns | 10 to 13 ★ |
| Job titles vs function + seniority | −38% [−49%, +1%] | +26% ✱ | 18 / 34 ★ |
| Single country vs 2 to 5 locations | −9% ns | 35 ★★ |
None of the settings people argue about most move cost per lead as much as the offer and the format do. Report No. 5 finds job titles −7% [−24%, −1%] per lead on 94 accounts, paired on the same objective with content and demo leads combined; the −38% here rests on 18 accounts and its interval spans zero.
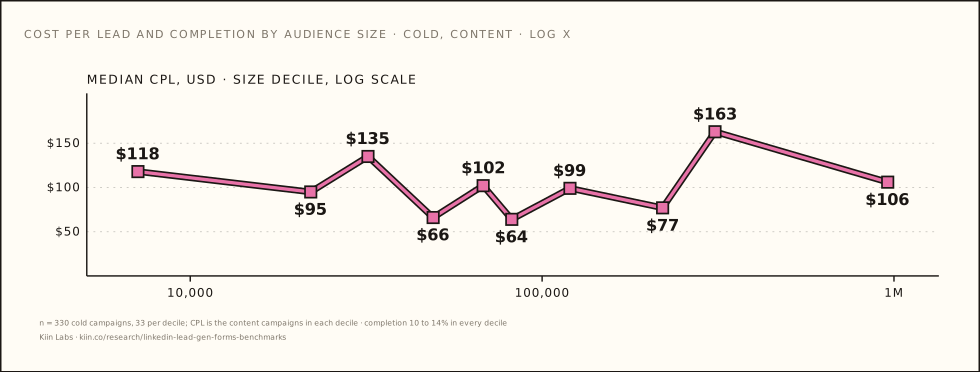
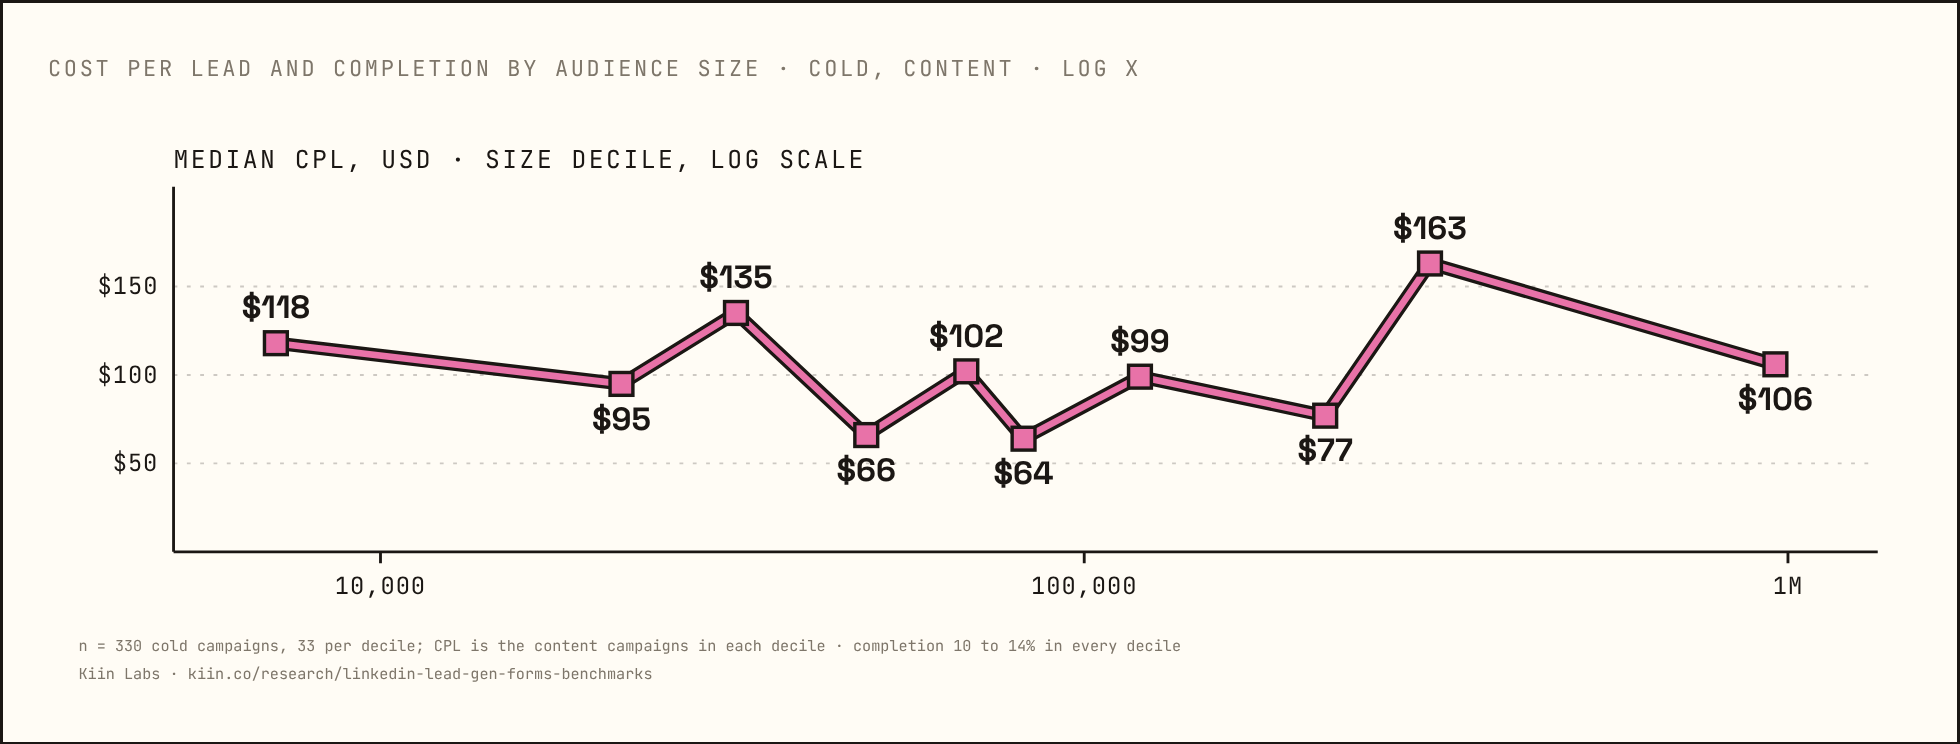
| Cold content campaigns by audience-size decile | 7,100 | 22,000 | 32,000 | 49,000 | 68,000 | 82,000 | 120,000 | 220,000 | 310,000 | 960,000 |
|---|---|---|---|---|---|---|---|---|---|---|
| Median CPL | $118 | $95 | $135 | $66 | $102 | $64 | $99 | $77 | $163 | $106 |
| Completion | 10.1% | 12.9% | 11.4% | 14.5% | 12.1% | 11.5% | 13.4% | 11.6% | 12.0% | 9.8% |
330 cold campaigns, 33 per decile; CPL shown is the content campaigns in each decile, completion is all. Rank correlation of audience size with CPL: −0.03 [−0.14, +0.08] across accounts, −0.13 within; with completion +0.03 / +0.05. The only real size effect is CPM on cold (ρ −0.10 ✱) and it never reaches the lead. Retargeting reverses: across accounts bigger pools look dearer (+0.24), inside one account they are cheaper (−0.32 [−0.54, −0.09], n = 55).
Four places the benchmark table and the paired check disagree
| Cut | Benchmark table | Paired, same account |
|---|---|---|
| US vs Europe | 2× dearer | +12% [−12%, +51%], n = 23, ns |
| Cold audience size | Under 20k $182 vs $100 at 50 to 100k (+82%) | No correlation: ρ −0.03 across, −0.13 within |
| Director-only filter | Cheaper | +29%, n = 34, ns |
| Enterprise-only filter | 2.7× dearer on demo | −45% vs no filter, 10 of 14, ns |
Geography, audience size, seniority and company size describe the market. They are not levers. Bigger audiences look cheaper because of who runs them.
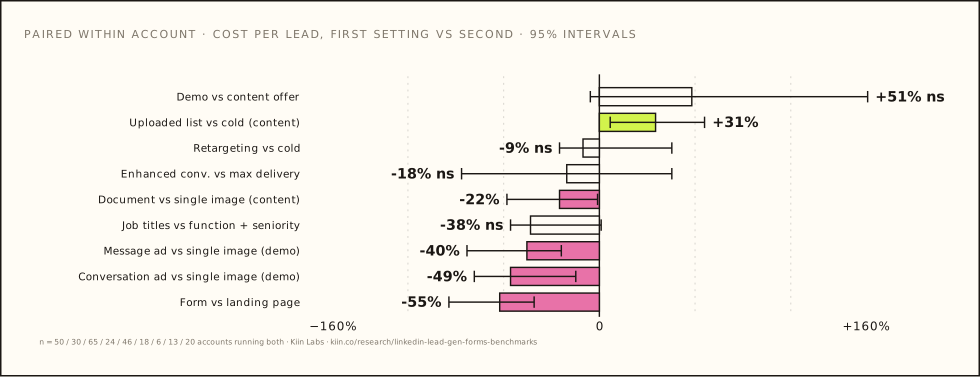
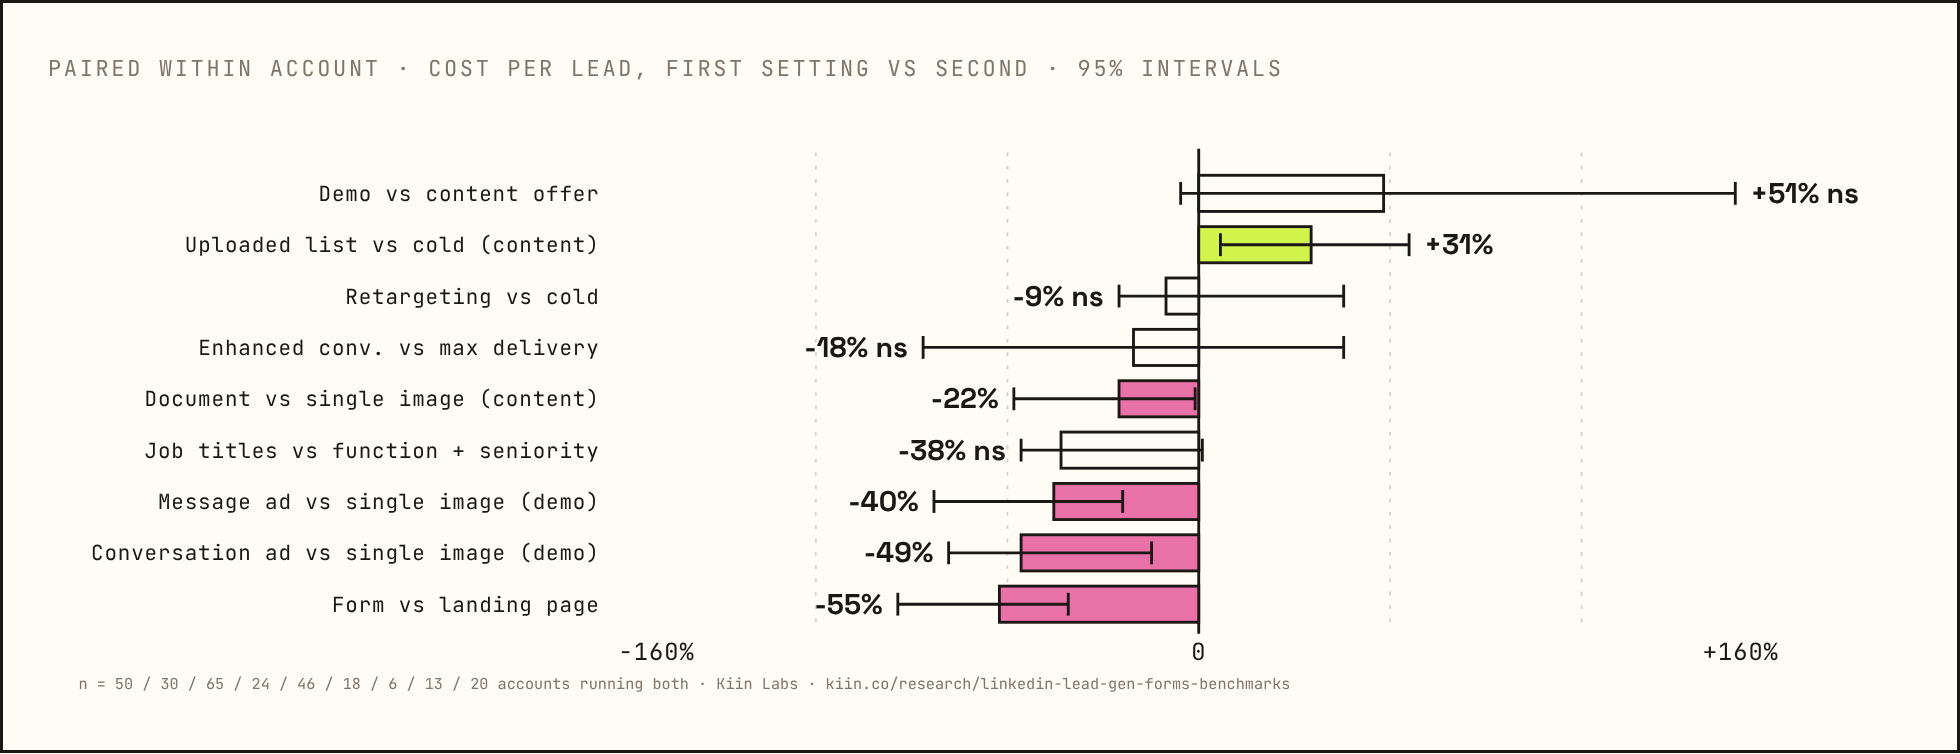
The 50,000-minimum rule is dead. From 7,000 to 960,000 people, cost per lead bounces between $64 and $163 with no slope, and completion sits at 10 to 14% in every decile. Size the audience to the offer and the budget, not to a threshold. Every bar on the paired chart is the same advertiser running both settings: the solid bars are the levers; the hollow ones are the things people argue about.
LinkedIn lead gen form conversion rate benchmarks: why the ask sets the price
A demo form converts at 2% in the feed and 40% in a message ad, and half of everything else in this report follows from that.
Form completion rate by where the form sits
| Where the form sits | Median | p25 | p75 | Accounts |
|---|---|---|---|---|
| Feed, content offers | 10.8% | 4.6% | 18.7% | 173 |
| Feed, demo requests | 2.2% | 1.0% | 4.2% | 87 |
| Message and conversation ads, content | 43.1% | 33.6% | 56.1% | 17 |
| Message and conversation ads, demo | 40.1% | 30.5% | 51.8% | 37 |
Median account, accounts with 100+ form opens. Paired, demo vs content form in the feed: −80% [−85%, −57%] ✱, 46 of 48 ★★. Report No. 4 puts feed demo completion at 3.9% because it takes the median of 79 feed accounts with five or more demo leads, where this row takes the 87 accounts with 100+ demo form opens.
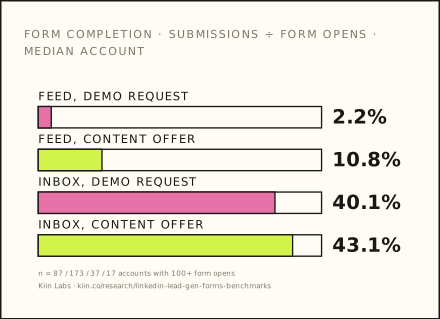
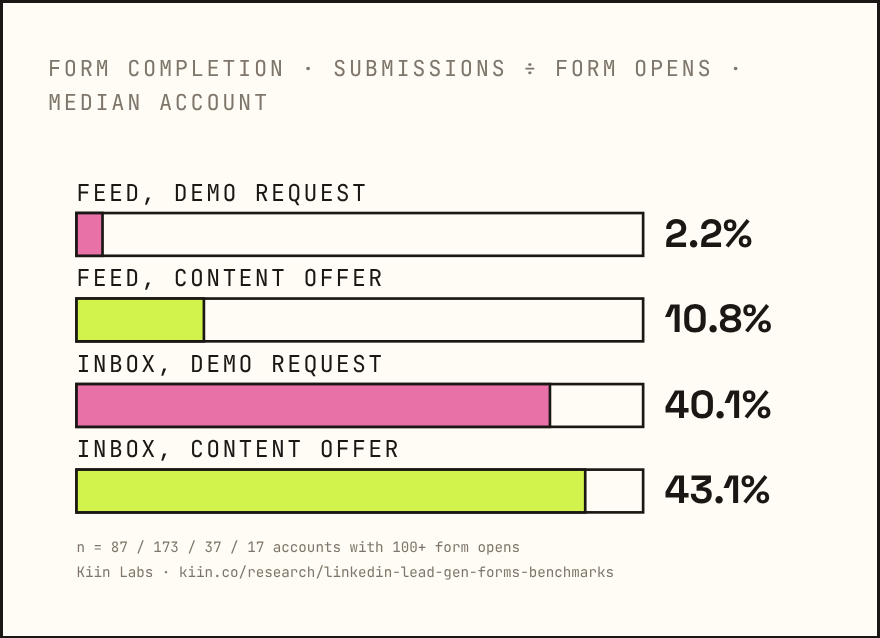
The feed is where people read; the inbox is where they answer. A form that asks for a meeting is an answer, so we put it where answering is normal. Demo asks go in a message ad or a conversation ad, or they go behind a content offer first. We no longer run a single-image ad with a "Request demo" form to a cold audience, and this report is why.
What explains the difference in CPL between accounts
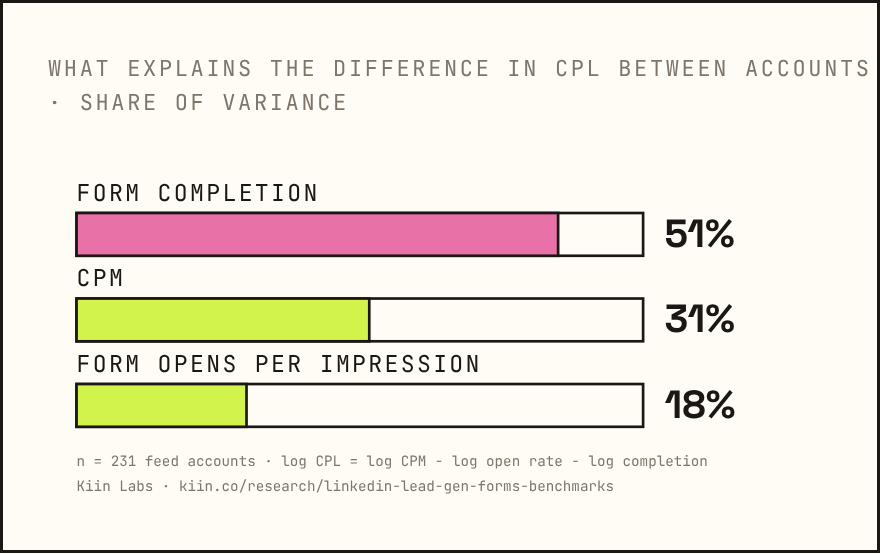
| Component of cost per lead | All feed | Content | Demo |
|---|---|---|---|
| Form completion | 51% | 47% | 51% |
| CPM | 31% | 30% | 36% |
| Form opens per impression | 18% | 22% | 12% |
Share of between-account variance in log CPL, 231 accounts (log CPL = log CPM − log open rate − log completion). Inbox: cost per send 45%, form opens per open 44%.
The click-to-submit gap: form open rate vs completion, by format and offer
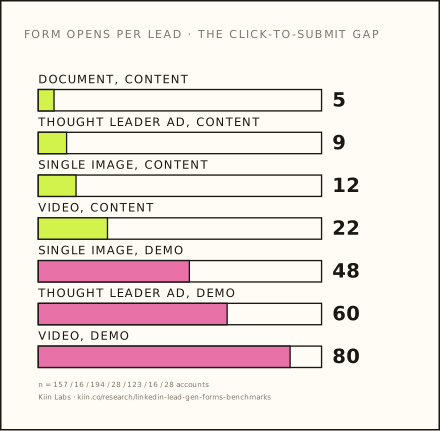
| Format · offer | Form opens ÷ impressions | Completion | Form opens per lead | Accounts |
|---|---|---|---|---|
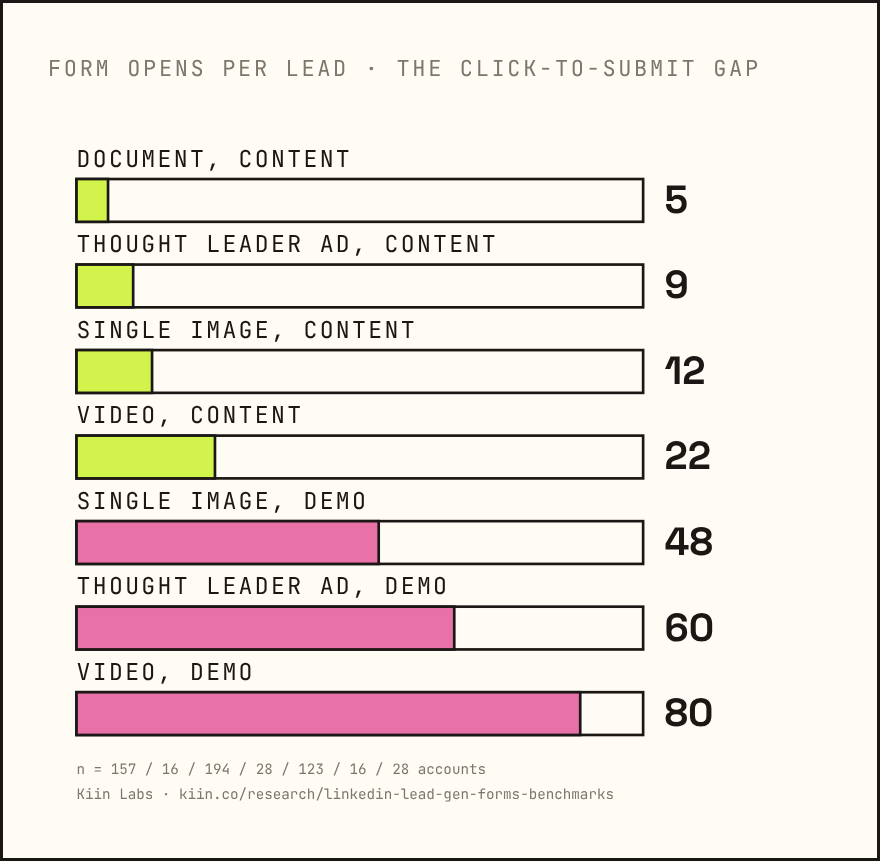
| Document · content | 0.13% | 20.3% | 5 | 157 |
| Thought leader ad · content | 0.37% | 11.4% | 9 | 16 |
| Single image · content | 0.39% | 8.3% | 12 | 194 |
| Video · content | 0.40% | 4.6% | 22 | 28 |
| Single image · demo | 0.41% | 2.1% | 48 | 123 |
| Video · demo | 0.58% | 1.2% | 80 | 28 |
Open rates barely vary by format; completion runs from 1.2% to 20.3%, a 17× range.
We judge a lead gen campaign on completion rate before CTR or CPM, because completion is where the money goes. Every optimisation conversation starts with the form and the ask, not the creative. A campaign with a normal click rate and 2% completion has a form problem, and no bid change fixes a form problem. If you take one figure from this chapter, take the variance chart: half of the difference in cost per lead between advertisers is people not finishing the form.
Best ad format for LinkedIn lead gen forms: documents, the inbox, video, landing pages
Documents win on content, the inbox wins on demo, video loses everywhere, and the form beats the landing page. Plus what the objective itself costs you per impression.
Paired within account, vs single image, content offers
| Format | CPL | Cost per form open | Completion | Accounts |
|---|---|---|---|---|
| Document | −22% ✱ | +98% ✱ | +174% ✱ | 46 / 61 / 47 ★★ |
| Conversation ad | −42% directional | +382% directional | 3 / 4 ★ | |
| Message ad | +1% ns | +162% ✱ | 11 / 10 ★ | |
| Video | +48% ns | +5% ns | −25% ns | 10 / 15 / 11 ★ |
| Thought leader ad | −33% ns | −7% ns | +33% ns | 5 / 6 / 6 ★ |
A document form needs 5 opens per lead; a single-image form needs 12. In accounts running both, documents deliver 40% of leads on 36% of spend; the "70% of leads on 13% of spend" story appears in 2 accounts out of 82. Documents are a content format: 157 accounts use them for content, 11 for demo. Report No. 5 puts documents at −40% per lead vs single image on 117 accounts because it combines content and demo leads; this table is content offers only.
Paired within account, vs single image, demo requests
| Format | CPL | Completion | Accounts |
|---|---|---|---|
| Conversation ad | −49% ✱ | +1,653% ✱ | 13 / 11 ★ |
| Message ad | −40% ✱ | +1,016% ✱ | 6 / 8 ★ |
| Video | +13% ns | −65% ✱ | 5 / 10 ★ |
| Thought leader ad | −41% ns | +47% ns | 5 / 8 ★ |
Video is the wrong format for a form: +60% CPL vs single image overall ✱ (4 of 16 cheaper, ★), the highest open rate in the feed and the lowest completion, 80 form opens per demo lead.
For content: documents, or a message ad. For demo: a message ad or a conversation ad, never a single image and never video. Conversation vs message ad on demo is +91% [−8%, +333%] at n = 9, the same tie Report No. 2 found. Document ads: fewer opens, nearly three times the completions. The format decision in full: the best LinkedIn ad format for B2B SaaS.
The inbox: send to lead
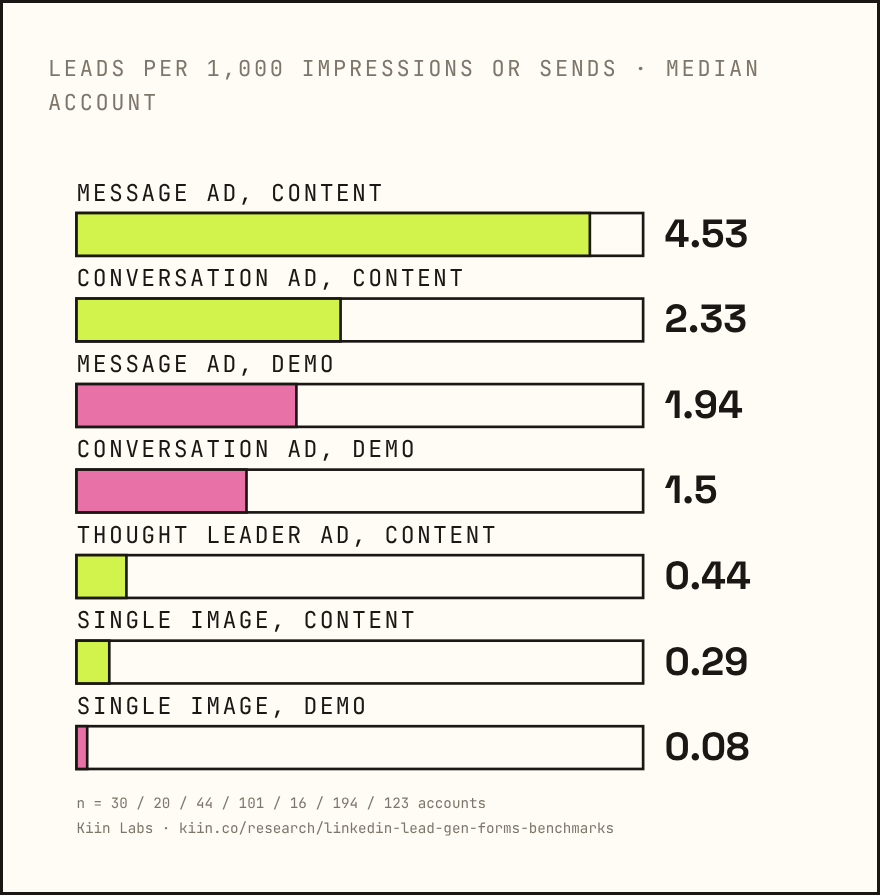
| Format · offer | Open | Form opens ÷ opens | Completion | Leads ÷ sends | Cost per send | CPL |
|---|---|---|---|---|---|---|
| Message ad · content | 52.6% | 3.0% | 37% | 0.45% | $0.36 | $56 |
| Message ad · demo | 47.5% | 1.2% | 32% | 0.19% | $0.49 | $175 |
| Conversation ad · demo | 40.4% | 0.8% | 45% | 0.15% | $0.57 | $365 |
One lead per 220 sends on a message ad content offer; one per 670 on a conversation ad demo. 36% of lead gen form spend runs in the inbox (conversation ads 27%, message ads 9%). Message ads are the cheapest lead on LinkedIn: $98 median, $56 content, $175 demo.
Lead gen form vs landing page, same account
| Form vs landing page | CPL | Cheaper in | Accounts |
|---|---|---|---|
| All offers | −55% [−83%, −36%] ✱ | 15 of 20 | ★ |
| Content offers | −82% [−92%, −51%] ✱ | 14 of 15 | ★ |
| Demo requests | −9% ns | 5 of 7 | ★ |
Website-conversion campaigns in the same accounts convert 1.6% of landing page clicks at $721 a lead (median, 23 accounts). Landing page leads are each account's own post-click conversion definitions matched by name, so the comparison is within account only.
$721. What a landing page lead costs in the same accounts that pay $185 for a form lead.
The lead gen objective CPM premium, same account, same month, feed
| Lead gen CPM vs | Premium | Dearer in | Accounts |
|---|---|---|---|
| Engagement | +2% [−8%, +18%] ns | 90 of 170 | ★★★ |
| Website conversion | +31% ✱ | 42 of 67 | ★★ |
| Website visits | +40% [+31%, +62%] ✱ | 116 of 154 | ★★★ |
| Video views | +58% ✱ | 51 of 69 | ★★ |
| Brand awareness | +81% [+40%, +136%] ✱ | 64 of 79 | ★★ |
The form is not a free add-on: you pay for the objective in CPM before you pay for the lead. Against engagement there is no premium at all.
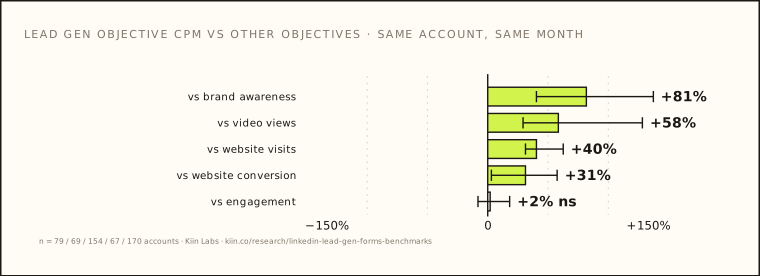
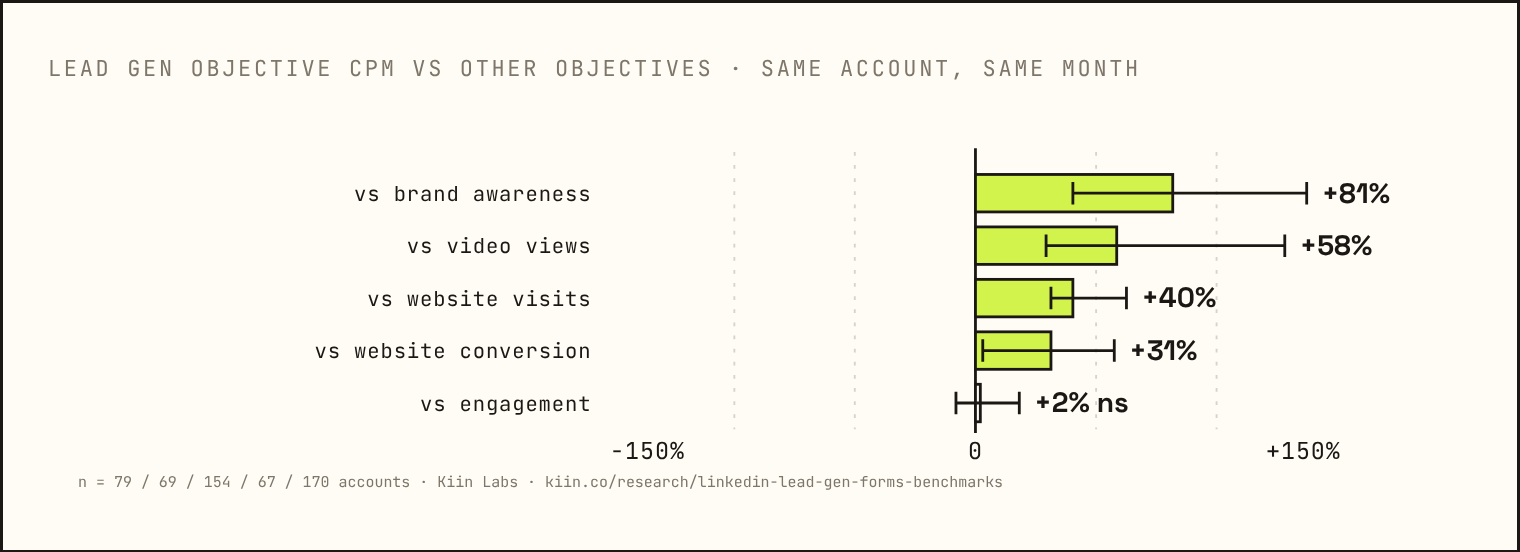
Among accounts that run lead gen forms, the objective is 42% of their LinkedIn spend, and the median account puts half its budget there. Knowing it pays the same CPM as engagement, and 40% more than website visits, changes how we set expectations for the whole account, not just the form. CPM by objective across every format is in LinkedIn CPM benchmarks.
How many fields should a LinkedIn lead gen form have? Field count does nothing. One field does everything.
And the form's own copy does not matter; the ask does.
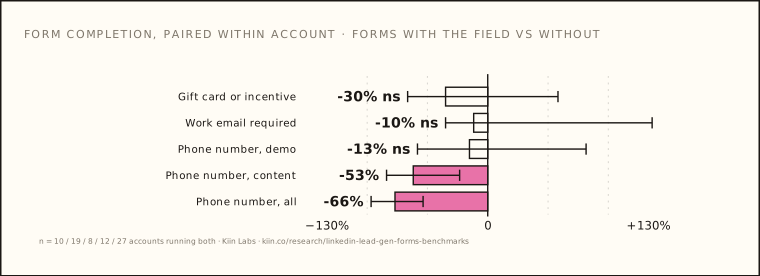
Specific fields, paired within account
| Field | Completion | CPL | Accounts |
|---|---|---|---|
| Phone number, all | −66% [−83%, −46%] ✱ | +135% [+51%, +331%] ✱ | 27 / 23 ★★ / ★ |
| Phone number, content | −53% ✱ | +41% ns | 12 / 11 ★ |
| Phone number, demo | −13% ns | +178% ns | 8 / 7 ★ |
| Work email required | −10% ns | +65% ns | 19 / 15 ★ |
| Consent checkbox | +73% ns | −31% ns | 13 / 10 ★ |
| Gift card or incentive | −30% ns | −23% ns | 10 / 8 ★ |
The benchmark table says the opposite of the phone finding (phone forms $107 vs $243) because the cheapest accounts ask for phone 59% of the time. Lead with the paired number, explain the table.
Field count: median completion, feed
| Fields | 3 or fewer | 4 | 5 | 6 | 7 | 8+ |
|---|---|---|---|---|---|---|
| Completion | 9.0% | 9.9% | 6.7% | 6.2% | 7.6% | 4.0% |
| Content | 15.1% | 15.3% | 8.8% | 8.2% | 12.0% | 13.0% |
| Demo | 2.7% | 1.5% | 3.4% | 1.8% | 1.3% | 2.0% |
Paired, short (5 or fewer) vs long (7 or more): +16% completion ns, 14 accounts ★. Custom questions: ns. No clean cliff anywhere. Work email vs any email: ns overall.
Anatomy of the median form, all 4,875 forms
- 6 fields at the median (3 or fewer 7%, 4 10%, 5 21%, 6 24%, 7 20%, 8+ 18%)
- 71% require a work email; 27% accept any email
- 67% ask for job title; 10% for company size; 35% ask for a phone number
- 18% have a consent checkbox
- 81% have no custom question; 11% one, 8% two or more; 3% a free-text question
- 97% send people somewhere from the thank-you page; 6% to a calendar (20% of demo forms)
- 8% mention a gift card or cash incentive
The form copy does not matter. The ask does. Headline length, offer-vs-benefit headline, description length: nothing, all ns at 44 to 69 accounts ★★. Thank-you CTA label: adoption only, no click metric exists in the API.
Phone number only when sales will actually dial it, and price in the loss: two thirds of completions on content, with the cost per lead more than doubling. Everything else on the form is a quality decision that the cost data cannot see. On incentives: 8% of forms mention one and we could not detect an effect at n = 10; the Kiin experience with incentive ads is in the inbox, not the form.
Lists, retargeting, cold: which audience gives the cheapest LinkedIn lead
Lists are the biggest audience by spend and the dearest. Retargeting is a tie. Audience size does nothing. And the people who submit are more senior than the people who see the ad. Report No. 7 finds the matching result on price rather than lead rate: lead gen form campaigns carry the largest narrow-audience penalty of any objective, 72% on CPM.
Why lists cost more: list vs cold, same account, content
| Metric | List vs cold | Lower in | Accounts |
|---|---|---|---|
| CPM | +19% [+5%, +57%] ✱ | 14 of 44 | ★★ |
| Form open rate | 0% [−10%, +16%] ns | 22 of 44 | ★★ |
| Completion | −8% ns | 20 of 35 | ★★ |
| Leads per impression | −24% [−29%, −2%] ✱ | 28 of 42 | ★★ |
| Cost per lead | +31% [+6%, +58%] ✱ | 10 of 30 | ★★ |
Same open rate, same completion, dearer impressions, fewer leads per impression. Messaging: list CPL +26% ✱ (15 accounts ★). Retargeting vs cold: CPL −9% [−22%, +40%], 34 of 65 ★★ ns; content +4%, demo −15%, both ns.
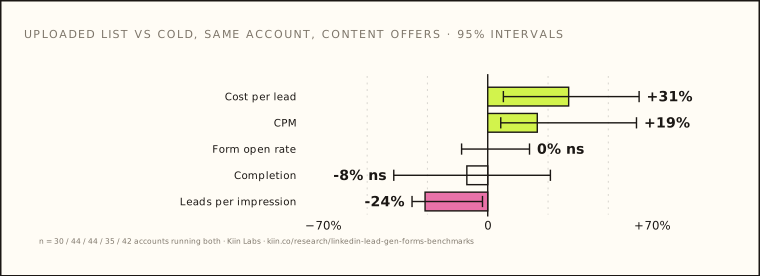
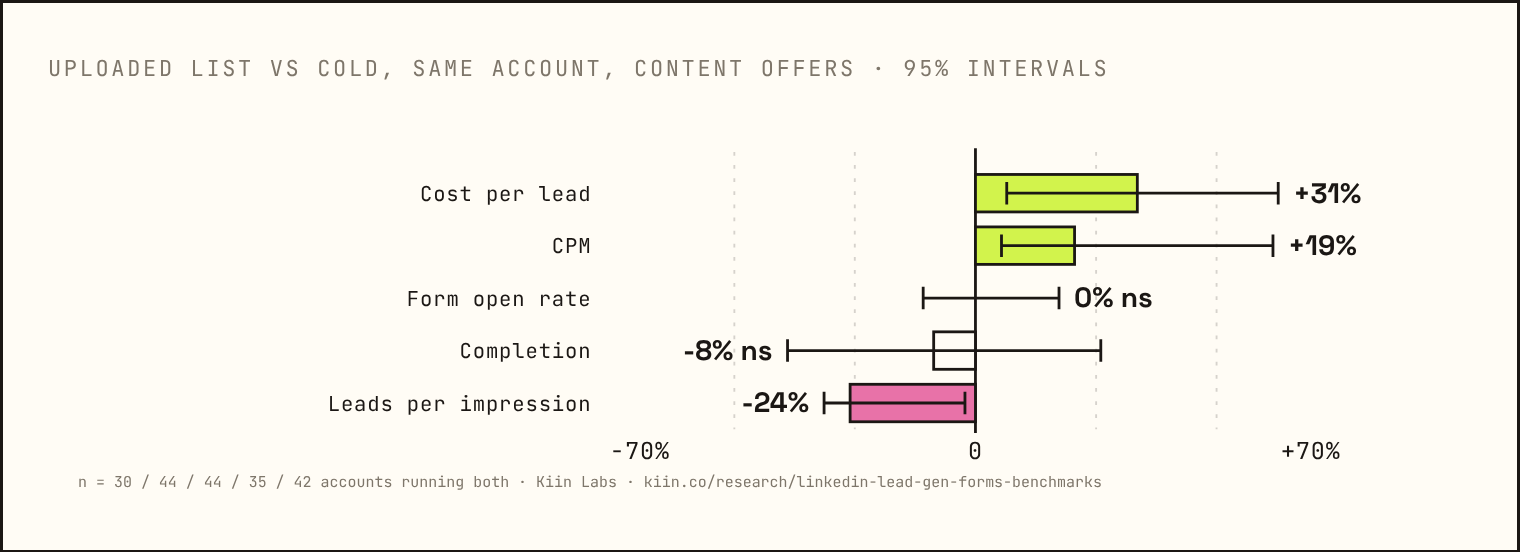
Cold first. Add the list when the account list matters more than the lead count, refresh any list under 10,000 monthly because it is fully reached in weeks, and stop expecting retargeting to be a discount on forms. It is not. (On conversation ads it is directionally cheaper and starred on lead rate and open rate, Report No. 2's finding.) How we build the account list in the first place: the account list guide; how we use retargeting: LinkedIn retargeting for B2B.
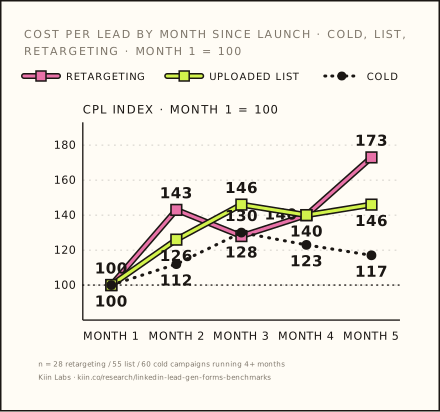
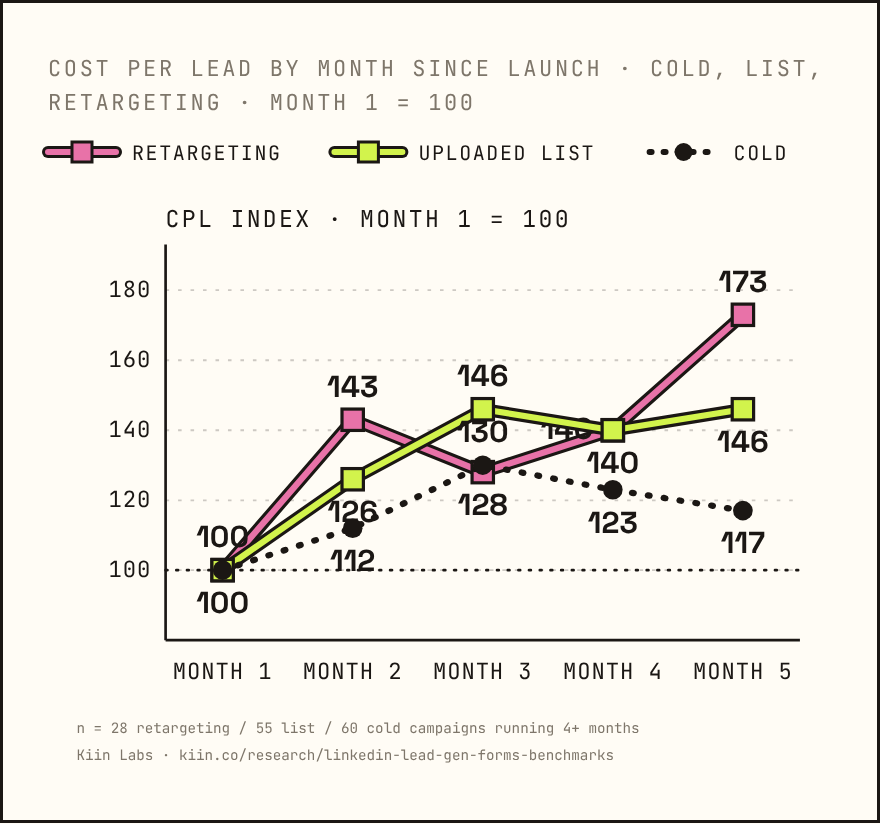
Fatigue by audience: CPL index by month since launch
| Audience | Month 1 | 2 | 3 | 4 | 5 | Completion, month 5 | Campaigns |
|---|---|---|---|---|---|---|---|
| Cold | 100 | 112 | 130 | 123 | 117 | 76 | 60 |
| Uploaded list | 100 | 126 | 146 | 140 | 146 | 67 | 55 |
| Retargeting | 100 | 143 | 128 | 140 | 173 | 55 | 28 |
Lists fatigue a month faster than cold; retargeting fatigues worst. Lists under 10,000 people are reached 130 to 150% over within a single campaign; lists over 50,000, 22%.
Who submits: LinkedIn demographic reporting, pooled across campaigns
| Seniority of the lead | Share of impressions | Share of leads | Leads per 10k impressions |
|---|---|---|---|
| Entry | 33.2% | 19.0% | 1.7 |
| Senior | 30.0% | 28.1% | 2.8 |
| Manager | 10.4% | 13.1% | 3.7 |
| Director | 11.7% | 17.1% | 4.3 |
| VP | 5.0% | 8.1% | 4.7 |
| Owner | 4.0% | 6.7% | 4.9 |
| CXO | 3.5% | 6.2% | 5.2 |
263 campaigns, 5,666 leads, pooled, not a median account. Director and above: 26% of impressions, 40% of leads. On filtered campaigns, 6% of leads come from outside the seniority filter. Content forms pull enterprise (10k+ companies: 28% of impressions, 44% of leads); demo forms pull micro-companies (2 to 10 people: 26% of impressions, 36% of leads). Marketing converts at 9.5 per 10k impressions, HR 7.0, engineering 2.4.
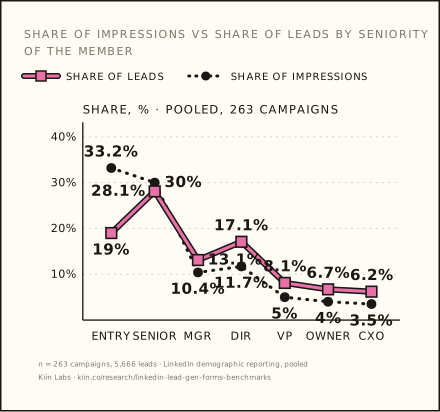
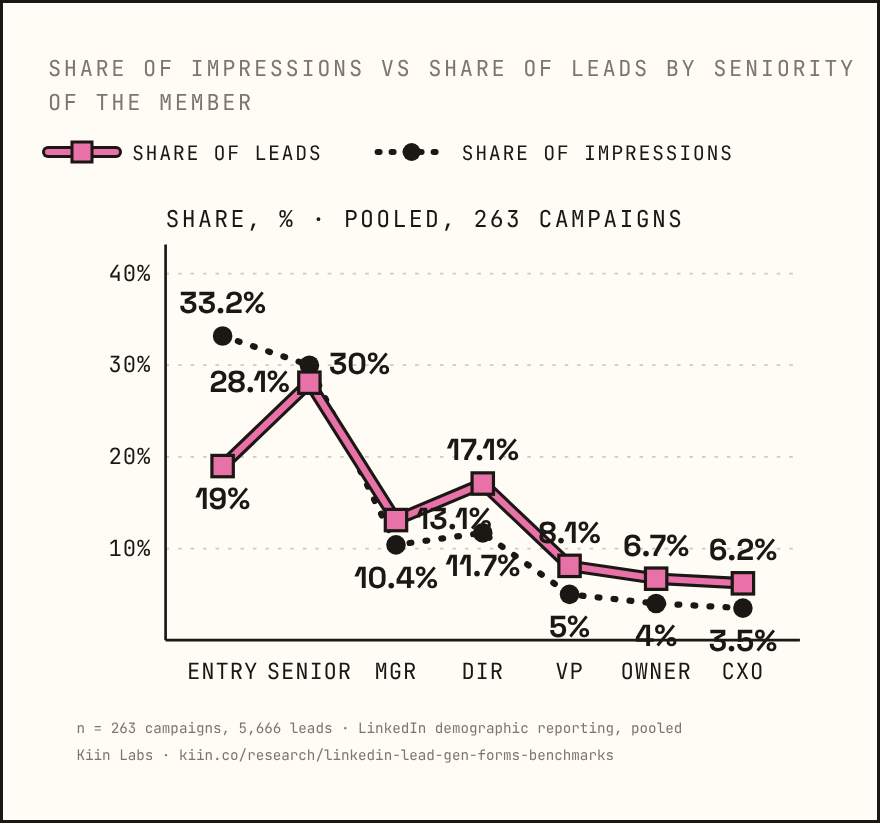
The "lead gen forms give you junior leads" line dies here on seniority. The people who submit skew senior relative to the people who see the ad, on content and on demo. Whether they become pipeline is the v1.1 question.
How much to spend on LinkedIn lead gen: the budget floor, time to first lead, zero-lead months
A quarter of campaign-months produce nothing. The floor is an offer question: content works at $25 a day, demo needs $100. And the campaigns that die do not die of impatience.
Time to first lead: campaigns launched in window, feed
| Offer · daily spend | Median days to lead | By day 7 | By day 30 | Never | Campaigns |
|---|---|---|---|---|---|
| Content · under $10 | 12 | 25% | 45% | 41% | 111 |
| Content · $10 to 25 | 3 | 60% | 77% | 16% | 215 |
| Content · $25 to 50 | 2 | 64% | 81% | 14% | 273 |
| Content · $50 to 100 | 2 | 72% | 90% | 7% | 231 |
| Content · $100+ | 1 | 85% | 94% | 3% | 170 |
| Demo · $10 to 25 | 12 | 25% | 51% | 36% | 76 |
| Demo · $25 to 50 | 7 | 38% | 63% | 27% | 91 |
| Demo · $50 to 100 | 4 | 54% | 70% | 22% | 90 |
| Demo · $100+ | 4 | 60% | 83% | 13% | 82 |
Median days counts campaigns that got a lead. Content needs $25 to 50 a day for a lead a week in half of months; demo needs $100 or more.
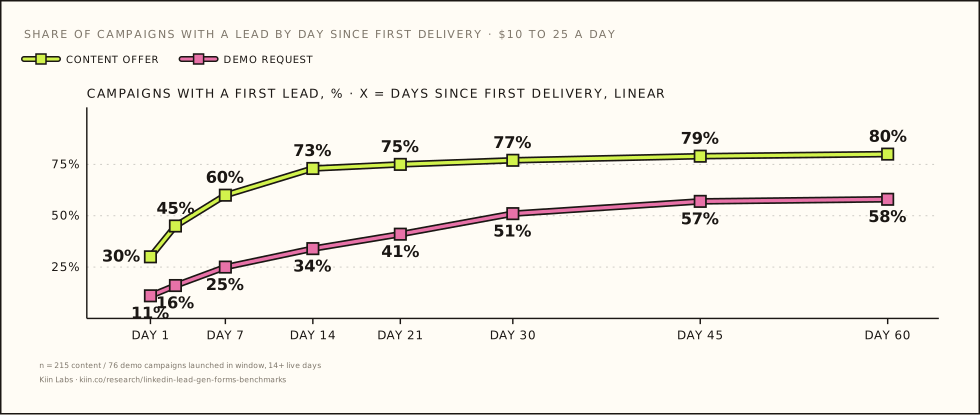
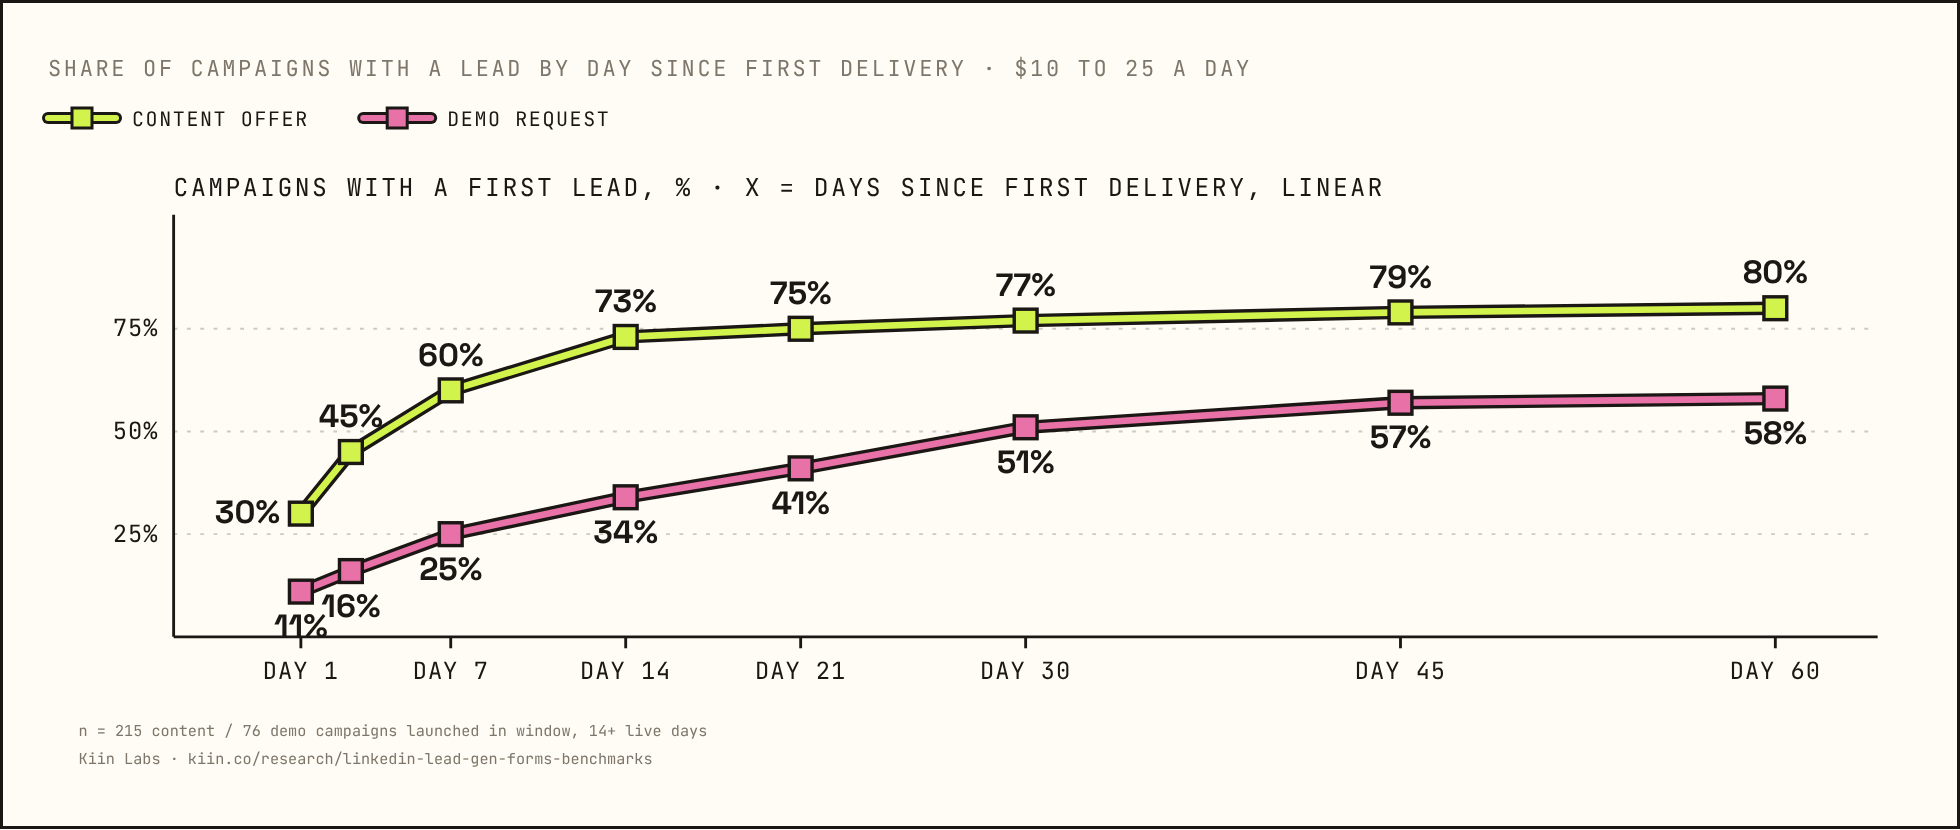
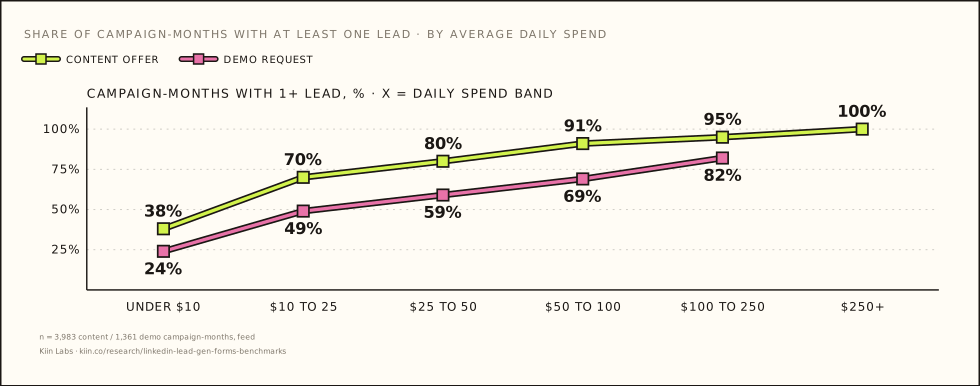
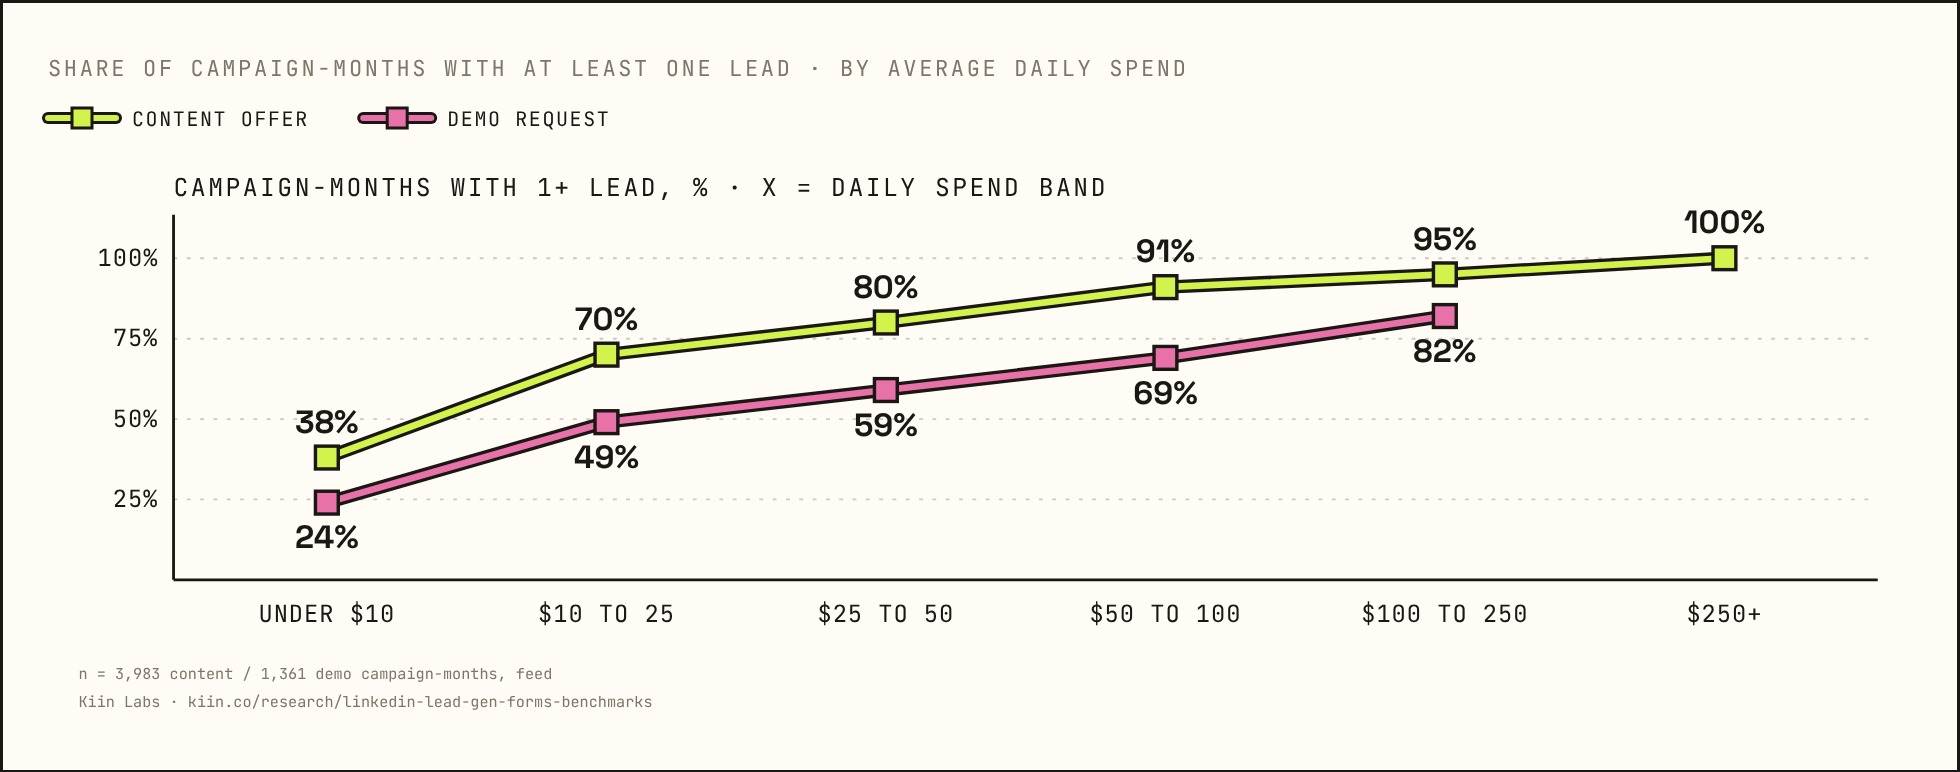
We set client expectations from this table, not from the platform's estimate. Content works at $25 a day. Even at $100 to 250 a day, only 46% of demo campaign-months get a lead a week; below $50 a day it is under one in five. Below $100 a day the honest forecast for demo is "probably nothing this month".
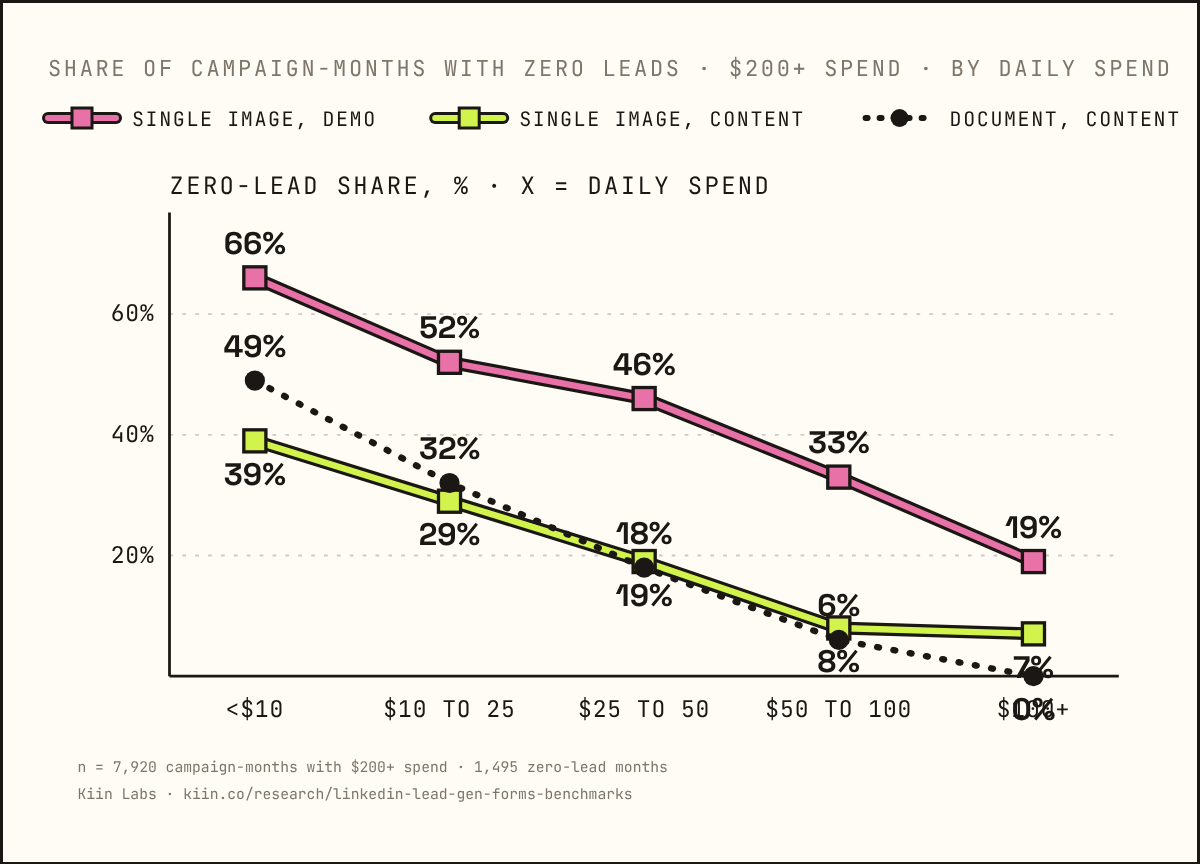
Where the zero-lead months are: share of campaign-months ($200+) with no lead
| Format · offer | Under $10 | $10 to 25 | $25 to 50 | $50 to 100 | $100+ |
|---|---|---|---|---|---|
| Single image · demo | 66% | 52% | 46% | 33% | 19% |
| Conversation ad · demo | 59% | 42% | 18% | 13% | 2% |
| Single image · content | 39% | 29% | 19% | 8% | 7% |
| Document · content | 49% | 32% | 18% | 6% | 0% |
| Message ad · demo | 56% | 29% | 39% | withheld | 7% |
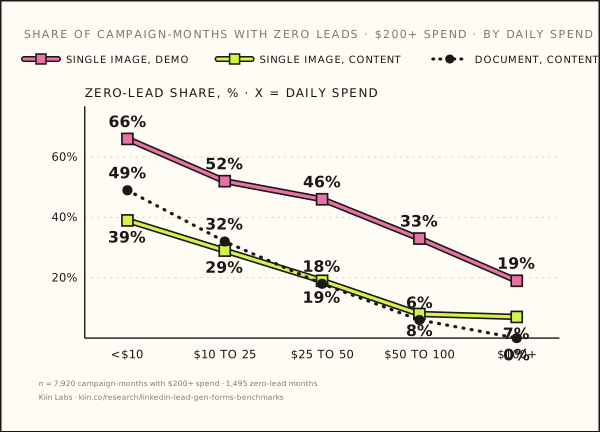
26% of all campaign-months with $200 or more of spend produce zero leads, $1.68M in total. Of the 1,495 zero-lead months, 48% are single image (26% content, 22% demo), 19% conversation-ad demo, 13% document content.
Campaigns do not die of impatience
Of 1,382 feed campaigns that stopped inside the window, only 4% were switched off with no lead before the median time to first lead for their offer and budget (demo 8%, content 3%). The rest waited past the median and still got nothing. 28% of campaigns never produce a lead (demo 32%, content 23%). Half of all lead gen campaigns deliver for 29 days or less; a third for 14 days or less. Most of the panel is short tests, which is the context for every fatigue number in chapter 07.
Budget pressure matters as much as the budget: above $2 a day per 1,000 audience members, completion halves cross-panel (10.2% to 4.8%) and the paired CPM difference is 28%, not significant on 15 accounts. The thought leader ads report found the same threshold. Widen the audience before raising the daily budget.
Lead gen form fatigue, ad copy, and the calendar: when forms tire and what copy does
Forms tire in completion, not in opens. The ad copy matters more than the form copy. And no day or month is better than another.
Fatigue: campaigns running 4+ months, indexed to month one
| Month | 1 | 2 | 3 | 4 | 5 | 6 |
|---|---|---|---|---|---|---|
| Cost per lead | 100 | 123 | 137 | 135 | 127 | 122 |
| Completion | 100 | 82 | 78 | 71 | 72 | 60 |
| Form open rate | 100 | 91 | 92 | 86 | 81 | 87 |
| CPM | 100 | 92 | 91 | 89 | 81 | 84 |
141 campaigns running 4+ months. CPM falls 16% by month five while CPL rises; the fatigue is inside the form. By week: CPL 108 in week one, flat in weeks two to four, then 116, 120, 135, 128 in weeks five to eight. Demo campaigns reach CPL 200 by month four with completion at 46 (n = 29). Report No. 5 has cost per lead at +22% in month three because it indexes the 911 lead gen campaigns launched inside its window, with no 4-month minimum, where this table is feed campaigns that ran 4+ months.
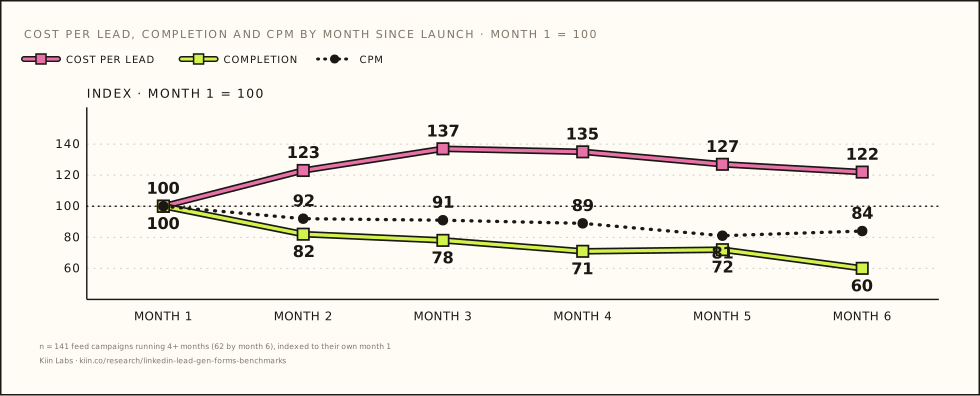
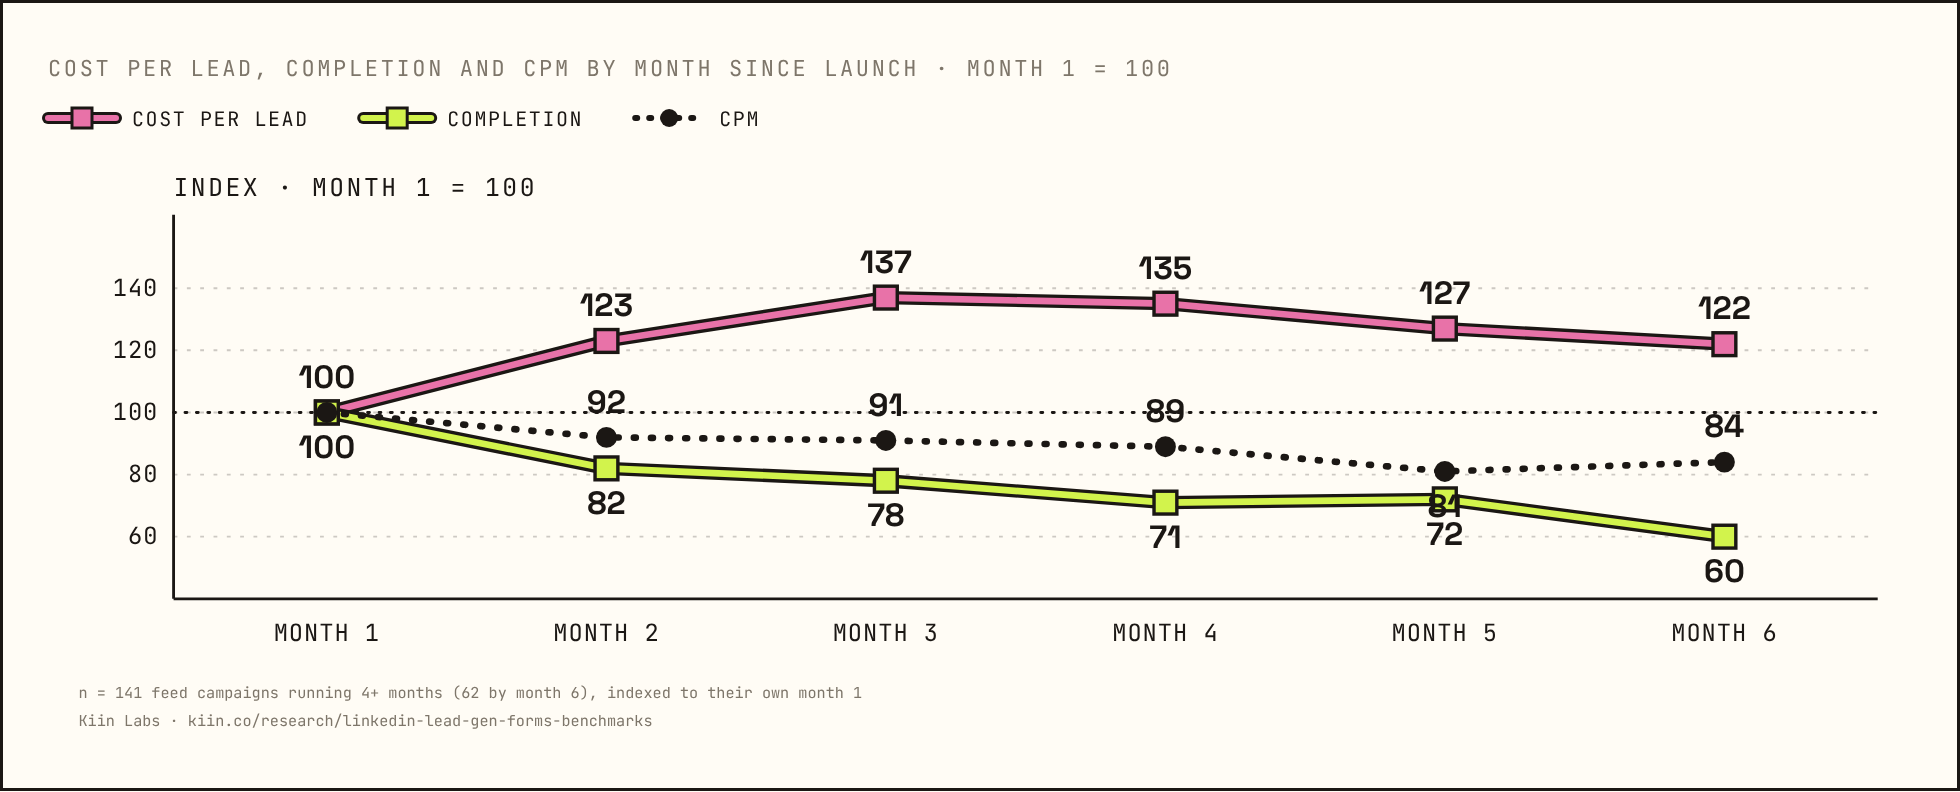
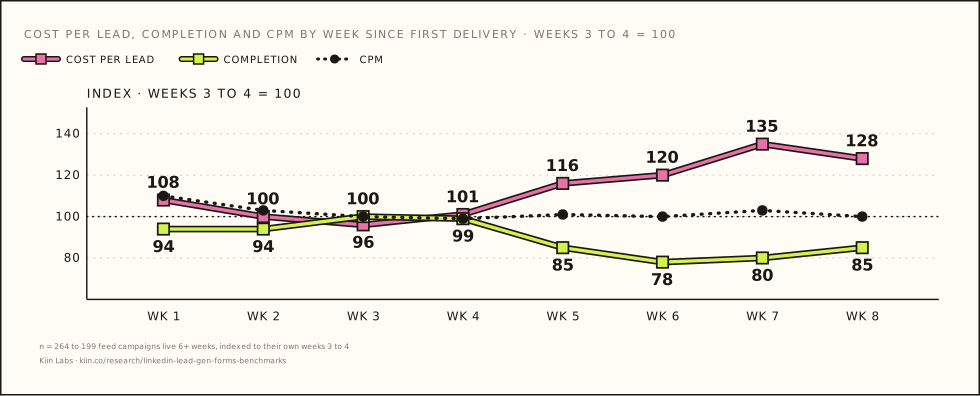
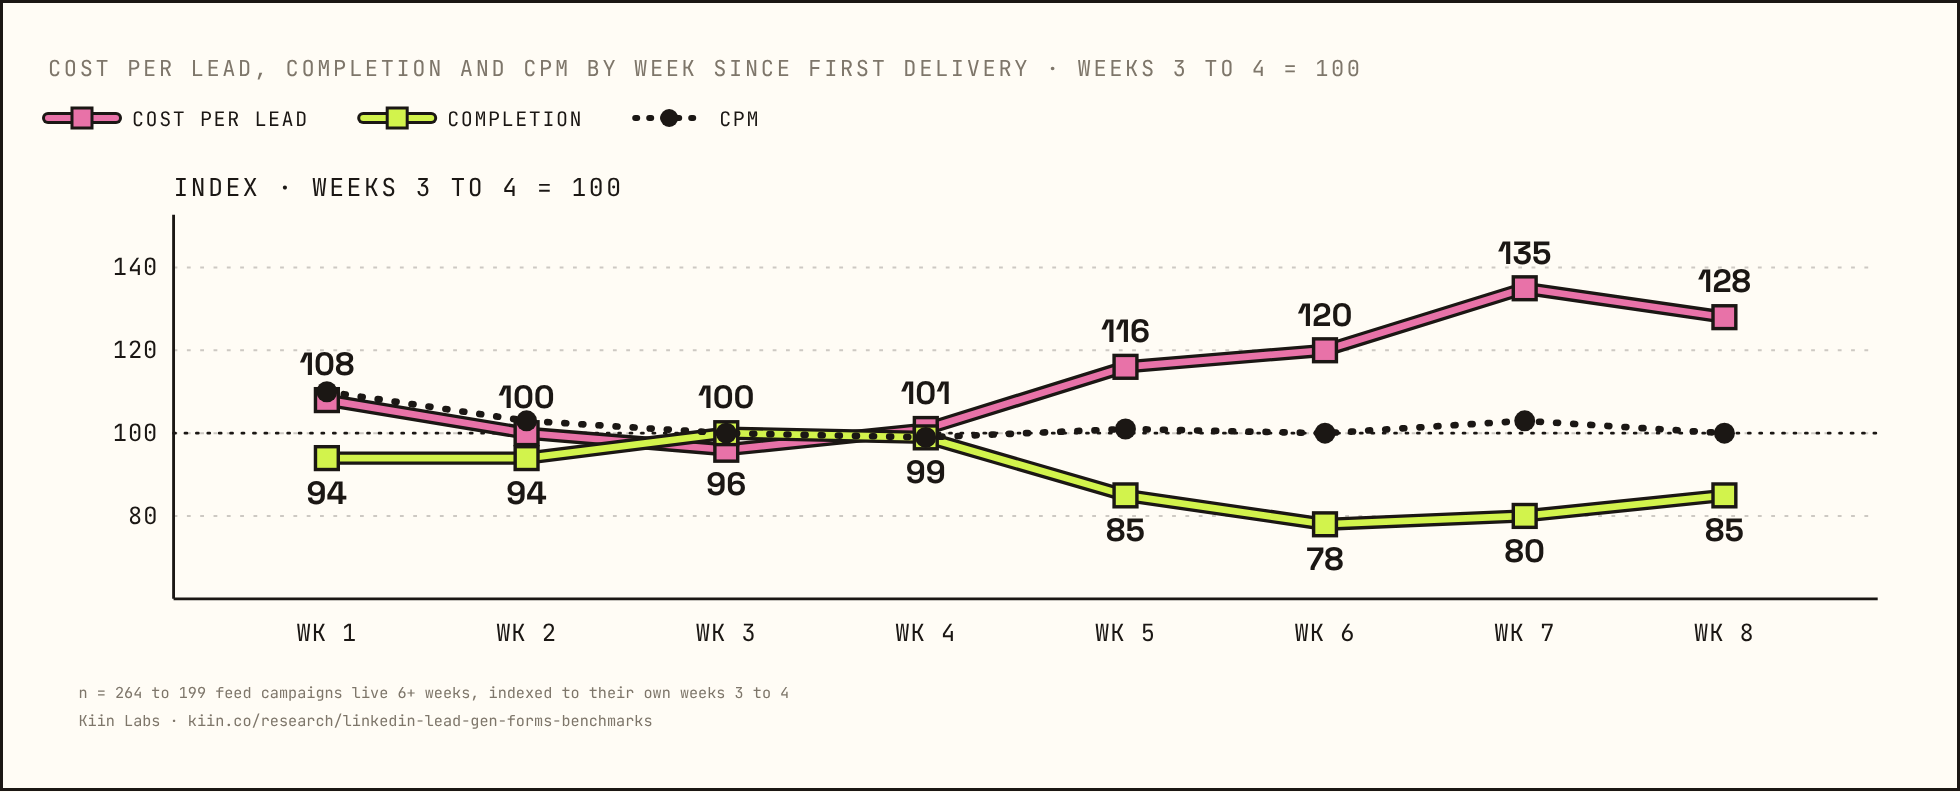
Refresh trigger: completion rate at week four; CPM never warns you. Forms fatigue in completion, not in opens: the person still opens the form and stops finishing it. The frequency mechanism behind this, across every format, is in LinkedIn ad frequency and fatigue.
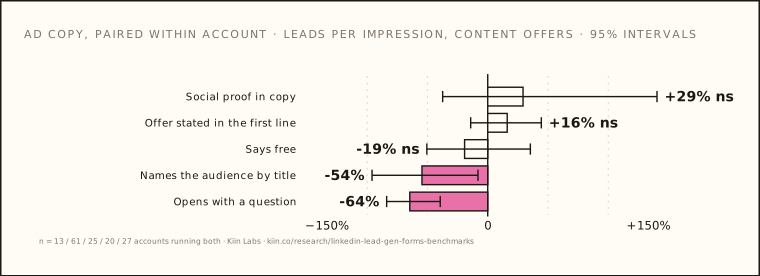
Ad copy: creative level, feed, content offers, paired
| Copy feature | Lead rate | Completion | Accounts |
|---|---|---|---|
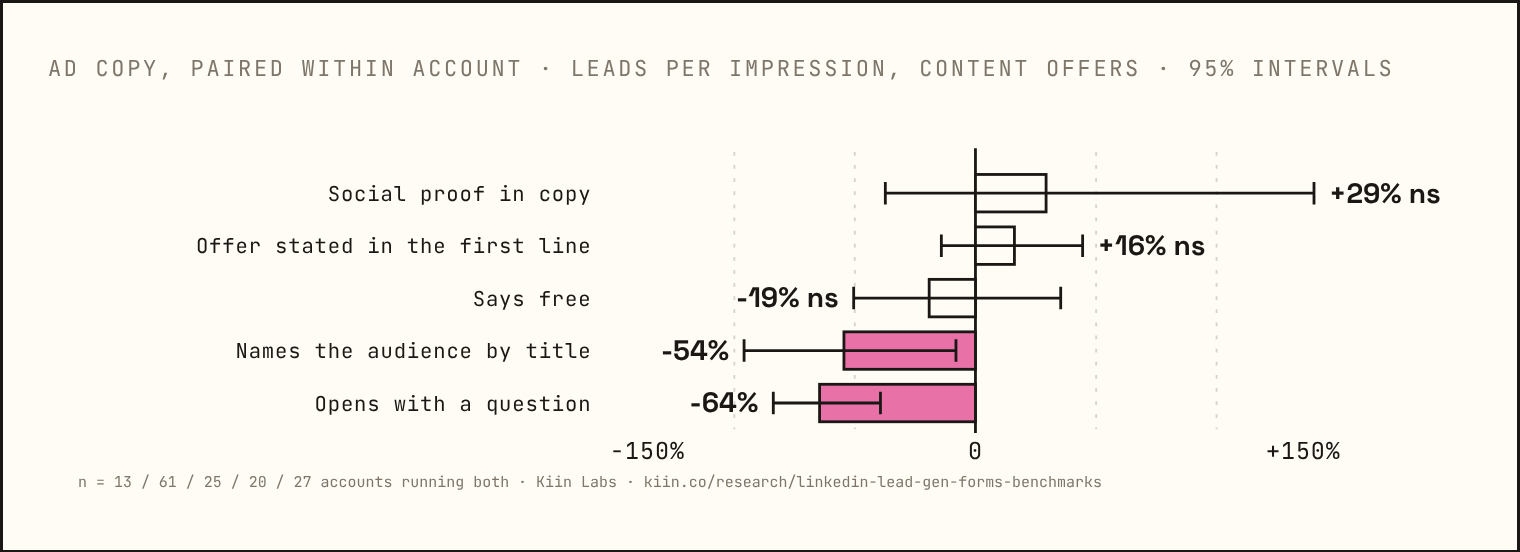
| Opens with a question | −64% [−83%, −39%] ✱ | −42% ns | 27 ★★ |
| Names the audience by title | −54% ✱ | −51% ns | 20 ★ |
| Offer stated in the first line | +16% ns | +19% [−3%, +41%] | 61 / 57 ★★ |
| Says "free" | −19% ns | −4% ns | 25 ★★ |
| Social proof | +29% ns | +21% ns | 13 ★ |
Lead rate is leads per 1,000 impressions. Question openers get 64% fewer leads per impression, in 21 of 27 accounts.
| CTA button | vs | Effect | Accounts |
|---|---|---|---|
| DOWNLOAD | LEARN MORE | +40% completion, 12 of 19 | ★ ns |
| REQUEST DEMO | LEARN MORE | +46% demo lead rate, 9 of 15 | ★ ns |
| Creatives per campaign, paired CPL | CPL | Cheaper in | Accounts |
|---|---|---|---|
| 2 to 3 vs 4 to 6 creatives | −8% [−29%, +3%] ns | 25 of 47 | ★★ |
| 2 to 3 vs 7 or more | +16% ns | 17 of 38 | ★★ |
Running four or five creatives per campaign has no cost effect on the lead gen objective. Cross-panel, one-creative campaigns cost $123 a lead and 7+ creative campaigns $286, which is mix: big accounts run more creatives.
The calendar: CPL index within account
| Mon | Tue | Wed | Thu | Fri | Sat | Sun | |
|---|---|---|---|---|---|---|---|
| Feed CPL | 100 | 100 | 100 | 100 | 100 | 99 | 94 |
| Feed lead rate | 100 | 100 | 100 | 100 | 100 | 100 | 100 |
| Share of spend | 16% | 16% | 17% | 16% | 15% | 11% | 9% |
No seasonality either: CPL index 96 to 103 every month of the year. CPM peaks in December (116) and troughs in January (97; September's 82 is on 10 accounts and not read); CPL does not follow it.
94. Sunday's cost per lead index, the cheapest day of the week; every weekday is 100 and lead rate is 100 every day.
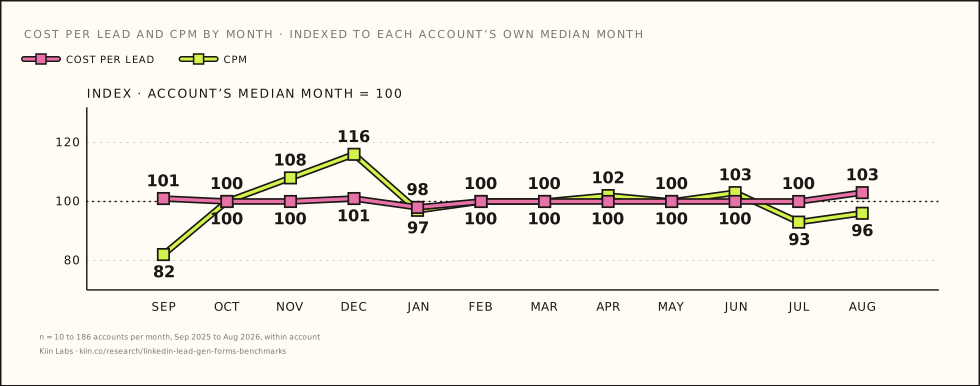
Weekends and December stay on. The ad's first line is a statement of the offer, never a question, never the reader's job title. The copy matters; the calendar does not.
The cheapest 10% of accounts got 537 leads on $8,000. The dearest got 23 on $44,000
And inside the same campaign, the senior leads are the cheap ones: the first published cost per lead by the seniority of the lead.
Cheapest vs dearest decile: 234 accounts with 10+ leads, 23 vs 23
| Cheapest 10% | Middle 80% | Dearest 10% | |
|---|---|---|---|
| Cost per lead | $16 | $183 | $945 |
| Lead gen spend a year | $8,021 | $11,874 | $43,927 |
| Leads | 537 | 66 | 23 |
| Form completion | 31% | 16% | 4% |
| CPM (feed) | $46 | $87 | $147 |
| Share cold | 70% | 34% | |
| Share uploaded lists | 11% | 46% | |
| Share demo offers | 12% | 37% | 56% |
| Cold audience size | 68,000 | 10,500 | |
| Share document ads | 27% | 19% | 16% |
| Share max delivery bidding | 33% | 17% | 12% |
| Share targeting US or Canada | 26% | 38% | 57% |
| Share asking for phone | 59% | 34% | 31% |
| Spend per campaign | $1,669 | $2,315 | $4,951 |
Shares are spend-weighted means within the decile; everything else is the decile median. The dear accounts are US, demo, lists, small pools, and they spend more per campaign to get there.
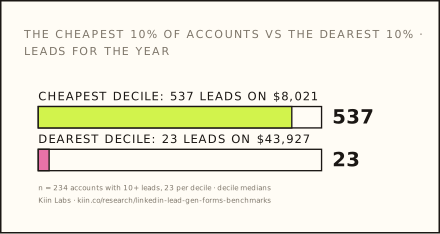
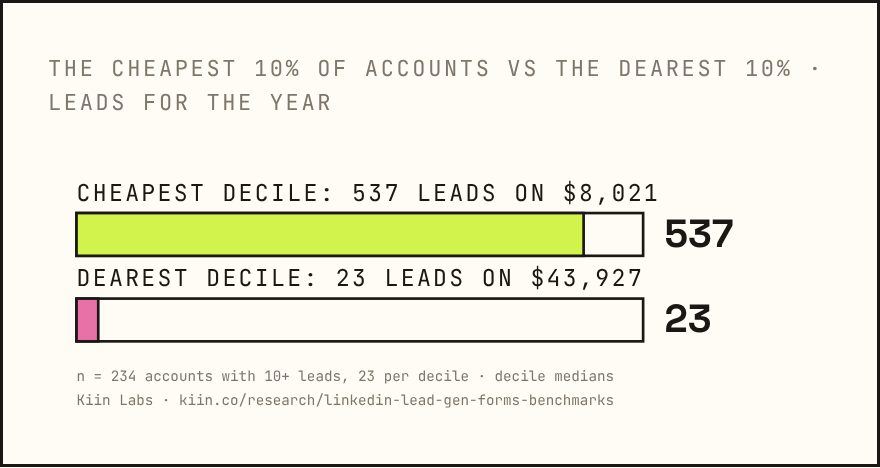
The cheap decile is not clever. It runs cold, on big audiences, for content, mostly outside North America, on documents and max delivery, and it asks for a phone number more often than the dear decile does. The dear decile is running demo forms to small US lists in single image ads. The profile table is the whole report in one column.
What a lead costs by who the lead is: within-campaign CPL index
| Seniority of the lead | Index (campaign = 100) | 95% interval | Median-account CPL | Leads per 10k impressions |
|---|---|---|---|---|
| VP | 59 | [51, 90] | $145 (11) | 6.4 |
| CXO | 64 | [47, 72] | $74 (8) | 8.4 |
| Owner | 69 | [32, 91] | $169 (7) | 6.5 |
| Manager | 74 | [56, 101] | $100 (10) | 5.2 |
| Director | 77 | [60, 89] | $87 (14) | 5.8 |
| Senior individual contributor | 91 | [79, 102] | $145 (9) | 3.4 |
| Entry level | withheld | under 7 accounts |
LinkedIn demographic spend, about 14 accounts, ★ directional. The index compares a director lead with a manager lead inside the same campaign, so account mix cannot drive it; every senior segment sits below the campaign average, and entry level, withheld on its own, is what pulls the average up. By function of the lead: Business Development 68 [53, 74] (13 accounts), IT 78, Sales 78, Operations 93.
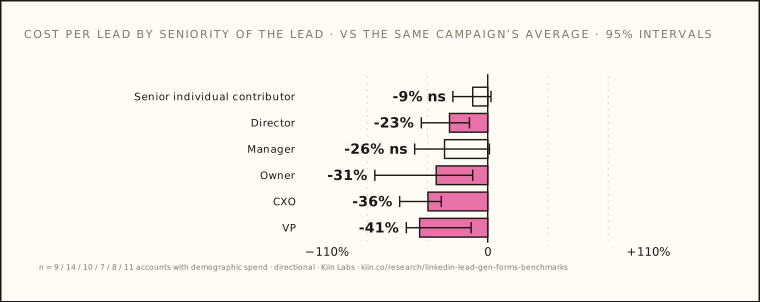
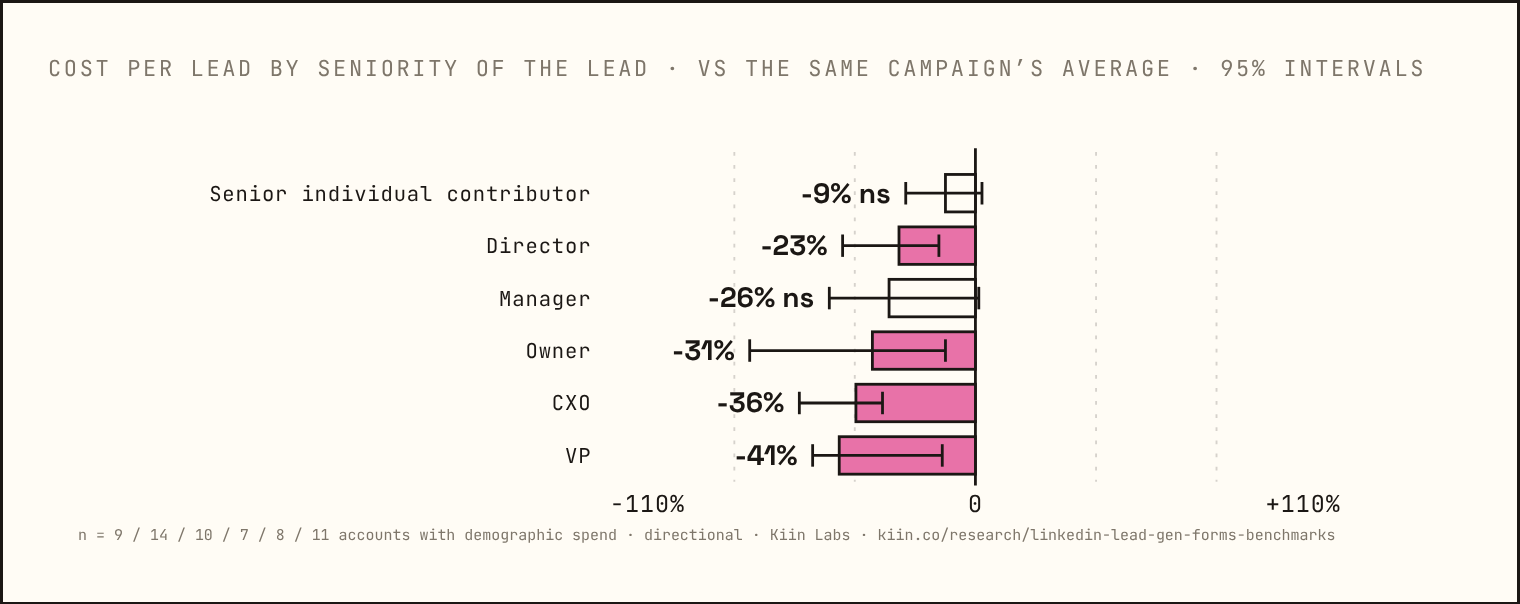
Targeting director and above costs nothing extra. And the seniors who convert are the cheapest leads in the campaign: a C-suite lead about a third below the campaign average, an individual contributor about a tenth below.
Fourteen accounts, so a directional finding, and the first published cost per lead by the seniority of the lead. Read with chapter 01: targeting seniors costs nothing extra, and the seniors who convert are the cheapest leads in the campaign. The assumption runs the other way, and it is wrong on both counts.
What good looks like: LinkedIn lead gen form benchmarks by completion rate, open rate and cost per lead
Median, good, exceptional. Three numbers to report on a lead gen campaign: completion rate, cost per form open, cost per lead, each split by what the form asks for.
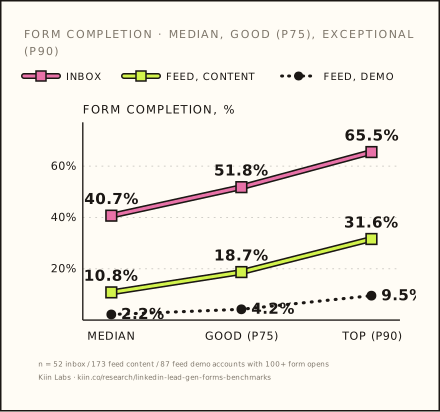
Form completion rate: submissions ÷ form opens
| Where | Median | Good (p75) | Exceptional (p90) | Accounts |
|---|---|---|---|---|
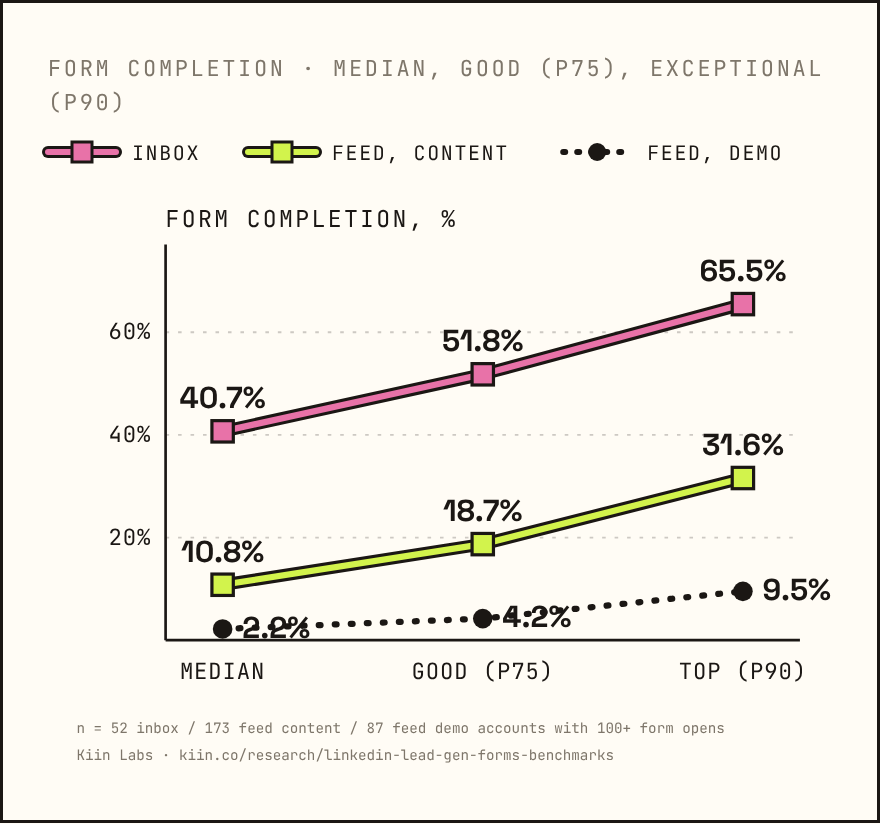
| Feed, all | 7.6% | 15.7% | 27.6% | 232 |
| Feed, content | 10.8% | 18.7% | 31.6% | 173 |
| Feed, demo | 2.2% | 4.2% | 9.5% | 87 |
| Message and conversation ads | 40.7% | 51.8% | 65.5% | 52 |
Median account, accounts with 100+ form opens.
Cost per lead: lower is better
| Offer | Median | Good (p25) | Exceptional (p10) | Accounts |
|---|---|---|---|---|
| Content | $164 | $67 | $28 | 217 |
| Demo | $343 | $131 | $67 | 115 |
Under $67 a content lead or $131 a demo lead puts you in the top quarter of the panel. Under $28 and $67 is the top tenth.
Form open rate and leads per thousand, median account
| Metric | Feed | Content | Demo | Inbox (per send) |
|---|---|---|---|---|
| Form open rate | 0.33% | 0.31% | 0.41% | 0.43% |
| Leads per 1,000 | 0.22 | 0.28 | 0.08 | 1.75 |
Feed p25 0.24%, p75 0.45% (376 accounts). By format: single image 0.39%, document 0.14%, video 0.45%, thought leader ad 0.39%. Inbox content 1.06% of sends, demo 0.35%.
| Form opens per lead (the click-to-submit gap) | Opens per lead |
|---|---|
| Document · content | 5 |
| Thought leader ad · content | 9 |
| Single image · content | 12 |
| Video · content | 22 |
| Single image · demo | 48 |
| Thought leader ad · demo | 60 |
| Video · demo | 80 |
A blended cost per lead is not a benchmark. If your content CPL is under $67 you are in the top quarter of the panel; if your demo CPL is under $131, likewise. If your feed completion is under 4% on a content offer, the form is the problem, not the bid. CTR on a lead gen campaign is form open rate with a different name (we use form opens ÷ impressions, not LinkedIn's clicks field, which also counts social clicks), and it explains a fifth of the cost. Every other format's benchmarks, on one page: LinkedIn Ads benchmarks 2026.
Twenty-two numbers to quote, with what they rest on
Each one a full sentence, free to cite with a link. The base line says what it rests on: accounts, whether it is paired, and the star.
A demo form converts at 2% in the feed and 40% in a message ad.
So: put the demo ask in the inbox, or behind a content offer.
Form completion rate explains half the difference in CPL between accounts. CPM explains a third. Click rate, a fifth.
So: judge the campaign on completion before CTR.
Median CPL is $164 for a content offer and $343 for a demo request.
So: never quote a blended number.
Single image with a demo form: $600 CPL, 2% completion, 48 form opens per lead.
So: the most common setup is the worst one.
Uploaded lists are 42% of lead gen spend and run 31% higher CPL than cold targeting in the same account.
So: cold before lists.
Retargeting does not lower CPL on lead gen forms: −9% vs cold, cheaper in 34 of 65 accounts. A tie.
So: use retargeting for the offer sequence, not the price.
Document ads run 22% lower CPL than single image on content offers. Fewer form opens, 174% higher completion.
So: documents for content.
Message ads are the cheapest lead on LinkedIn: $56 CPL for content, $175 for a demo.
So: the inbox is the demo format.
Lead gen forms run 55% lower CPL than landing pages in the same account. On content offers, 82% lower.
So: use the form unless the offer is a meeting.
The lead gen objective pays 40% higher CPM than website visits and the same CPM as engagement.
So: the form is not a free add-on.
26% of campaign-months with $200 or more in spend deliver zero leads.
So: the floor is real.
At $10 to 25 a day, content gets its first lead in 3 days. Demo takes 12 days, and 36% of demo campaigns never get one.
So: set expectations by offer.
Adding a phone number field cuts form completion by 66%.
So: phone only when sales will dial it.
CPL rises 37% by month three. Completion falls 22%. CPM falls 9%.
So: refresh on completion, not CPM.
Ads that open with a question get 64% fewer leads per impression than ads that open with a statement.
So: state the offer in the first line.
Director and above are 26% of impressions and 40% of leads.
So: the leads skew senior.
The median lead gen advertiser gets 22 leads a year from forms.
So: most of the panel is small tests.
The cheapest 10% of accounts got 537 leads on $8k. The most expensive 10% got 23 leads on $44k.
So: the profile is the playbook.
Only 4% of campaigns were paused before the median time to first lead. The rest waited and still got nothing.
So: campaigns do not die of impatience.
Content CPL is $68 in the UK and $210 in the US. Within the same account, the gap is 12% and not significant.
So: geography describes the market, not the auction.
Inside the same campaign, a C-suite lead costs about a third less than the campaign average. The cheap leads are the senior ones.
So: filter up without fear.
Audience size does not move CPL or completion. Correlation with CPL: −0.03 across accounts, −0.13 within them.
So: the 50k minimum is dead.
Sixteen LinkedIn lead gen form myths, with the verdict
| Myth | Verdict | What the data says |
|---|---|---|
| Lead gen forms give you junk or junior leads | Killed on seniority | 40% of leads are director and above, 6% outside the filter. Pipeline quality untested; v1.1. |
| Landing pages give better leads than forms | On cost, killed | The form wins by 55% ✱ in the same account. Quality untested. |
| Document ads are the cheapest lead on LinkedIn | Half right | Cheapest feed content lead, −22% ✱. Message ads are cheaper still. Not a demo format. |
| Never run demo forms cold | Backwards | Cold demo $240 vs list $496 vs retargeting $402; paired, retargeting is a tie. Cold is fine; lists are the dear one. |
| Retargeting is always cheaper | Killed for forms | −9%, a tie, ★★. Directionally true for conversation ads on cost (Report No. 2), starred there on lead rate and open rate. |
| More form fields means fewer leads | No | No clean effect on field count. Phone number: −66% ✱. |
| You need four or five creatives per campaign | No cost effect | 2 to 3 vs 4 to 6 is −8% ns, 25 of 47 ★★. |
| You need a 50k audience minimum | Killed | No correlation between audience size and CPL or completion, across accounts or within them. The bucket table was an account effect. |
| Senior leads cost more | Backwards, directionally | Inside the same campaign a C-suite lead is about a third below the campaign average; ★, 14 accounts. |
| Lead gen is too expensive under £5k a month | Content: killed. Demo: true below $100 a day | $98 a content lead under $1k a month. Demo at $10 to 25 a day: 36% never get a lead. |
| Conversation ads are dead for lead gen | Killed | 27% of lead gen spend, 40% completion, −40 to 49% vs single image on demo. |
| Max delivery ruins lead quality | On cost, a tie | Tie with enhanced conversion. Quality untested. |
| Pause on weekends and in December | No | Sunday is the cheapest day; December CPM is up 16% and CPL is flat. |
| Video ads are great for lead gen | No | +60% per lead vs single image ✱ (16 accounts), 80 form opens per demo lead. |
| C-suite leads are not worth chasing | No | Same cost as managers to target; CXOs convert 3× entry level per impression and are the cheapest lead in the campaign. |
| Audience expansion is always waste | Not waste, not a lever | No CPL effect either way, 10 to 13 accounts. |
Terms used in this report
| Lead | A LinkedIn lead gen form submission (oneClickLeads). Form opens are not leads. |
| CPL | Cost per lead: spend divided by leads, per advertiser account, USD. |
| Content offer | A download, guide, report, webinar or template behind the form. Classified from the form's own headline, description, CTA and thank-you text. |
| Demo request | A demo, call, quote, trial or audit behind the form. Same classification. |
| Form open rate | Form opens divided by impressions (feed) or sends (inbox). What this report means by CTR on a lead gen campaign. |
| Completion | Submissions divided by form opens. The lead gen form conversion rate. |
| Form opens per lead | The click-to-submit gap: how many people have to open the form for one to finish it. |
| Cold | Attribute targeting with no list: title, function, industry, seniority, company size. |
| Uploaded list | A company or contact list matched to LinkedIn members. |
| Retargeting | Audiences built from website visitors, video viewers, ad engagers and form openers. |
| Median account | The middle advertiser when every account counts once, whatever its spend. |
| Paired within account | The same advertiser running both settings; reported as the median ratio, a 95% bootstrap interval, and the share of accounts where the first setting was cheaper. |
| Pooled | Totals summed across campaigns (spend ÷ leads, or LinkedIn's demographic reporting). Dominated by the biggest accounts; always labelled. |
| ns | Not statistically significant: the 95% interval includes no change. |
How it was built, what it cannot answer, how to cite
Method
Data. Kiin Intelligence, LinkedIn Marketing API, every lead-generation-objective campaign with delivery across connected accounts, 8 Sep 2025 to 7 Sep 2026, campaign-daily grain, 14 currencies normalised to USD at September 2026 rates. 4,010 campaigns, 489 advertiser accounts, $13.6M of spend, 4,875 lead gen forms read, 86,051 form submissions from 572,814 form opens. No lead gen campaign in the panel used the LinkedIn Audience Network, so there was nothing to exclude.
Cost per lead is spend divided by LinkedIn lead gen form submissions, per advertiser account. Lead type is classified from the form's own headline, description, CTA and thank-you text: content (download, guide, report, webinar, template) or demo (demo, call, quote, trial, audit); 25% of spend is outside the split tables: 14% unclassified (mostly non-English forms), 8% with no form synced, 3% mixed.
Benchmarks are medians across advertiser accounts; no cell with fewer than seven accounts is shown; pooled figures are labelled pooled. Paired comparisons take the same advertiser running both settings, compute the ratio per account, and report the median ratio with a 95% bootstrap interval (2,000 samples) and the share of accounts where the first setting was cheaper. Only those comparisons carry a star: ★★★ 100 or more paired accounts, ★★ 25 to 100, ★ under 25. ✱ marks an interval that excludes zero.
Demographic findings are LinkedIn's aggregated demographic reporting pooled across campaigns and are labelled as such; nothing member-level is used. Fatigue is per campaign indexed to its own first month or its own weeks three to four; day of week and month are within account against the account's own median.
The snapshot was frozen on 15 Sep 2026, deduplicated by campaign and day, and reconciled to an independent archive within 0.02% on leads. No account, campaign, form, creative or person is identifiable in any table.
What we cannot answer
Whether the leads become pipeline. Needs form submissions joined to CRM contacts by email, which the platform does not store. The v1.1 chapter.
Which document page the gate sits on, video length, image type. Not in the API.
Manual bid amounts. Null on most manual campaigns.
Mobile vs desktop. Not in the API.
Which custom question hurts most. 81% of forms have none.
Whether a list lead came from a company on the list. Member-company breakdown not synced.
Industry of the submitter vs industry targeted. Taxonomy mismatch between facets.
Cost per lead by seniority, content vs demo. Under the seven-account floor.
LinkedIn vs Google or Meta. LinkedIn-only panel.
Related reports in the series: LinkedIn Thought Leader Ads Benchmarks 2026 (Report No. 1), LinkedIn Conversation Ads Benchmarks 2026 (Report No. 2), The Cost of a Demo on LinkedIn 2026 (Report No. 4, the demo-request half of this panel gone deeper: placement, pool size, saturation, best-vs-worst inside one account), How Much Do LinkedIn Ads Cost? 2026 (Report No. 5), Video on LinkedIn Ads 2026 (Report No. 6) and LinkedIn Audience Targeting 2026 (Report No. 7). Nos. 1 to 4 share the same panel, method and rules.
Ilic, P. (2026). LinkedIn Lead Gen Forms Benchmarks 2026. Kiin Labs. kiin.co/research/linkedin-lead-gen-forms-benchmarks. Figures are medians across advertiser accounts and paired within-account comparisons, USD, 8 Sep 2025 to 7 Sep 2026, content and demo offers reported separately. Free to cite with a link.
Frequently asked questions about LinkedIn lead gen forms
The questions people search, answered with a number, the n and the method.
What is a LinkedIn lead gen form?
A form attached to a LinkedIn ad that opens inside LinkedIn and pre-fills from the member's profile, so a lead is a tap, not a landing page visit. It runs on the lead generation objective in the feed (single image, document, video, carousel, thought leader ads) and in the inbox (message ads and conversation ads). In this study, 489 advertisers spent $13.6M on the objective in 12 months and collected 86,051 submissions from 572,814 form opens.
What is the average cost per lead on LinkedIn?
There is no useful single number. Across 341 accounts the median is $185, but a content offer (guide, report, webinar, template) costs $164 at the median account and a demo or sales-call request costs $343. The top quarter of content accounts is under $67; the top quarter of demo accounts under $131. Everything else in this report is that split, cut by industry, function, seniority, region, format and audience.
What is a good cost per lead for B2B LinkedIn ads?
Under $67 for a content offer and under $131 for a demo request puts you in the top quarter of the panel. Under $28 and $67 respectively is the top tenth. Above $365 (content) or $741 (demo) is the bottom quarter.
What does a LinkedIn lead cost by industry?
From $20 (higher education, content) to $722 (hospitals, demo) across the 100-plus industries with ten or more accounts in the panel. Software development: $81 content, $459 demo. IT services and IT consulting: $83 content. Financial services: $85 and $224. Technology, information and internet: $102 and $386. Manufacturing: $262 and $144. The full table, content and demo side by side with cells under seven accounts withheld, is at kiin.co/research/linkedin-cost-per-lead-by-industry.
What is a good conversion rate for a LinkedIn lead gen form?
Form completion (submits ÷ opens) in the feed: median 7.6%, good 15.7%, exceptional 27.6%. Content offers 10.8% median; demo requests 2.2%. In a message or conversation ad the median is 40.7%, good 51.8%, exceptional 65.5%. Form open rate (opens ÷ impressions) in the feed is 0.33% at the median.
What is a good CTR for LinkedIn lead gen ads?
On a lead gen campaign the number that matters is form open rate, form opens ÷ impressions: median 0.33% in the feed, p25 0.24%, p75 0.45% across 376 accounts. By format: single image 0.39%, document 0.14%, video 0.45%, thought leader ad 0.39%. In the inbox, 0.43% of sends. It explains only a fifth of the difference in cost per lead between accounts; completion explains half.
How many fields should a LinkedIn lead gen form have?
The field count does not move completion in a measurable way (3 or fewer fields 9.0%, 8+ fields 4.0% cross-panel; short vs long +16% paired, not significant). One specific field does: asking for a phone number cuts completion by 66% in the same account (24 of 27 accounts) and more than doubles cost per lead. The median form has six fields; 71% require a work email, 67% ask for job title, 35% for a phone number.
Are LinkedIn lead gen form leads junk?
On seniority, no: director and above are 26% of impressions and 40% of leads, and 94% of leads on a filtered campaign come from inside the seniority filter. Content forms pull enterprise companies; demo forms pull micro-companies. Whether they become pipeline is the one question this report cannot answer from the platform; it is the v1.1 chapter.
Lead gen form or landing page?
The form, unless the offer is a meeting. In the same accounts, a form lead costs 55% less than a landing page lead, 82% less on content offers, and the same on demo requests (20 / 15 / 7 accounts running both). Landing pages convert 1.6% of clicks at $721 a lead in this panel.
Which ad format is best for LinkedIn lead gen forms?
For content: document ads (−22% cost per lead vs single image in the same account, 20% completion) or message ads ($56 a lead). For demo: message ads ($175) or conversation ads ($365), never a single image ($600, 2.1% completion) and never video (80 form opens per lead; +60% cost per lead vs single image on 16 accounts).
Are document ads better than single image ads for lead gen?
For content offers, yes: 22% lower cost per lead paired within account, cheaper in 30 of 46 accounts. The mechanism is fewer form opens (cost per open +98%) and 174% higher completion, 20.3% vs 8.3%: a document form needs 5 opens per lead, a single-image form 12. Documents are a content format; 157 accounts use them for content and 11 for demo.
Do conversation ads still work for lead gen?
Yes. Conversation ads alone are 27% of lead gen form spend, the inbox as a whole 36%; a form there completes 40% of the time; on demo offers conversation ads are 49% cheaper per lead than single image in the same account, and message ads 40% cheaper. Conversation vs message ad on demo is a tie (+91%, n = 9, not significant), the same result as Report No. 2.
How do I lower my LinkedIn cost per lead?
In order of effect: change the ask (a demo request costs 2.1× a content offer), change the format (documents −22% for content, the inbox −40 to 49% for demo), remove the phone field (−66% completion), run cold before lists (lists +31%), keep budget under $2 a day per 1,000 audience members, and refresh at week four on completion rate. Bid strategy, audience expansion, seniority filters, field count and audience size are not levers.
What are LinkedIn lead gen form best practices?
The thirteen rules Kiin runs: never a demo ask in the feed with a form; judge the campaign on completion rate; documents for content, never for demo; phone number only when sales will dial it; $25 to 50 a day for content and $100 a day for demo; refresh on completion around week four; cold before lists; job titles over function plus seniority; never open with a question or the reader's job title; use the form, not the landing page, unless the offer is a meeting; under $2 a day per 1,000 audience members; weekends and December stay on; report completion, cost per form open and cost per lead split by what the form asks for.
Does a bigger audience mean cheaper leads?
No. Across 293 cold content campaigns from 7,000 to 960,000 people, the rank correlation between audience size and cost per lead is −0.03, and −0.13 inside the same account; completion is 10 to 14% at every size. Bigger audiences look cheaper in bucket tables because the advertisers who run them are cheaper advertisers. Bigger audiences do buy slightly cheaper impressions (ρ −0.10), which never reaches the lead.
Are senior leads more expensive on LinkedIn?
Directionally, the opposite. In the 14 accounts where LinkedIn reports spend by demographic, a C-suite lead inside the same campaign costs about a third less than the campaign average and converts at 8.4 leads per 10k impressions against 3.4 for a senior individual contributor. Targeting director and above also costs nothing extra (+17%, not significant). Both halves of "seniors are expensive" fail.
Should I use retargeting for lead gen forms?
It does not make them cheaper: −9% vs cold in the same account, cheaper in 34 of 65 (a tie). It fatigues worst of the three audience types (cost per lead index 173 by month five). Use it for the offer sequence, not for the price.
Should I upload a list for LinkedIn lead gen?
Only when the account list matters more than the lead count. A list costs 31% more per content lead than cold in the same account: 19% more per impression, 24% fewer leads per impression, same open rate and completion. Lists under 10,000 people are fully reached within weeks and need refreshing monthly. Lists are 42% of all lead gen form spend.
How much should I spend on LinkedIn lead gen?
Content: $25 to 50 a day gets a lead a week in half of months; at $10 to 25 a day the first lead arrives in 3 days. Demo: even at $100 to 250 a day only 46% of months get a lead a week, and below $50 a day it is under one in five; at $10 to 25 a day the first lead takes 12 days and 36% of campaigns never get one. 26% of campaign-months with $200 or more of spend produce nothing.
How much does LinkedIn lead gen cost per month?
The median lead gen advertiser spends $5,043 a year on the objective and gets 22 leads from it. Accounts under $1k a month pay $98 a content lead and $117 a demo lead, the cheapest band in the table; accounts over $25k a month pay $401 and $867, which is mix (US, demo, lists, small pools), not the auction. For content, small budgets work; for demo, the constraint is the daily budget, not the monthly one.
How long until a LinkedIn lead gen campaign gets its first lead?
Content at $10 to 25 a day: 3 days median, 77% by day 30. Demo at the same spend: 12 days, 51% by day 30. At $100 a day or more: 1 day content, 4 days demo. Across all spend levels the medians are 2 and 6 days. Only 4% of campaigns were switched off before the median time to first lead for their offer and budget.
Does the lead gen objective cost more per impression?
Yes: 40% more than website visits, 81% more than brand awareness, 31% more than website conversion, 58% more than video views, and the same as engagement, all in the same account and month. Feed CPM runs $46 in the cheapest decile of accounts, $87 in the middle 80% and $147 in the dearest decile.
What is the best day to run LinkedIn lead gen ads?
No day is better on lead rate. Sunday is the cheapest per lead (index 94); every weekday is 100. Weekends are 20% of delivery and there is no reason to pause them.
Is there seasonality in LinkedIn lead gen?
No. Within account, cost per lead sits between 96 and 103 every month of the year. CPM peaks in December at 116 and troughs in January at 97, and cost per lead does not follow it. Turning lead gen off in December saves nothing per lead.
When do LinkedIn lead gen forms fatigue?
Cost per lead rises 37% by month three (index 137), completion falls 22%, and CPM falls 9%, so CPM never warns you. By week, cost per lead is flat for four weeks, then 116, 120, 135, 128 in weeks five to eight. Lists fatigue fastest (146 by month three), retargeting worst (173 by month five). The refresh trigger is completion rate at week four.
Does LinkedIn lead gen work for MSPs and IT services?
IT services and IT consulting: 48 accounts in the panel, $83 a content lead, in the cheapest third of the industry table. The demo cell is under seven accounts and withheld; across the industries where it can be shown, a demo lead runs $144 to $722. The answer for an MSP is a content offer in a document ad, not a "book a call" form in the feed.
Does LinkedIn lead gen work for SaaS?
Software development: $81 a content lead, $459 a demo lead (17 / 7 accounts). Technology, information and internet: $102 and $386. Same pattern as everywhere: content in the feed, demo in the inbox.
Should I add a gift card incentive to a lead gen form?
8% of forms mention one. We could not detect an effect on completion or cost (10 accounts, not significant). Not a lever we can see on forms; Kiin's incentive results are in conversation ads, not forms.
LinkedIn lead gen forms vs Google Ads or Meta for B2B?
Not in this study: the panel is LinkedIn only. What we can say is what a LinkedIn lead costs by offer, so the comparison is yours to make against your own Google and Meta numbers, offer for offer.
How do I connect a LinkedIn lead gen form to HubSpot?
Through LinkedIn's native HubSpot integration in Campaign Manager, or via the CRM sync in Kiin Intelligence. The join from form submission to CRM contact is what v1.1 of this report, on lead quality, is built on.
Where does this data come from?
Kiin Intelligence, via the LinkedIn Marketing API: every lead-generation-objective campaign with delivery across connected accounts, 8 Sep 2025 to 7 Sep 2026, 4,010 campaigns, 489 accounts, $13.6M, 86,051 leads, 4,875 forms read. Benchmarks are medians across accounts; every setting comparison is the same advertiser running both, paired within account, with bootstrap confidence intervals; no cell under seven accounts is shown. The full method is at the end of the report.
The Kiin Labs LinkedIn Ads reports
Six more studies built on the same panel of advertiser accounts. Every figure is a median across accounts, USD, LinkedIn Audience Network excluded, and free to cite with a link.
Want your account in these tables? Kiin runs LinkedIn Ads for sales-led B2B companies and benchmarks every account against the 1,000+ connected to Kiin Intelligence: content and demo, on every table in this report. The lead gen layer, the retargeting pool it needs, and the report on completion rate and cost per lead, the scope is on LinkedIn Ads management.