
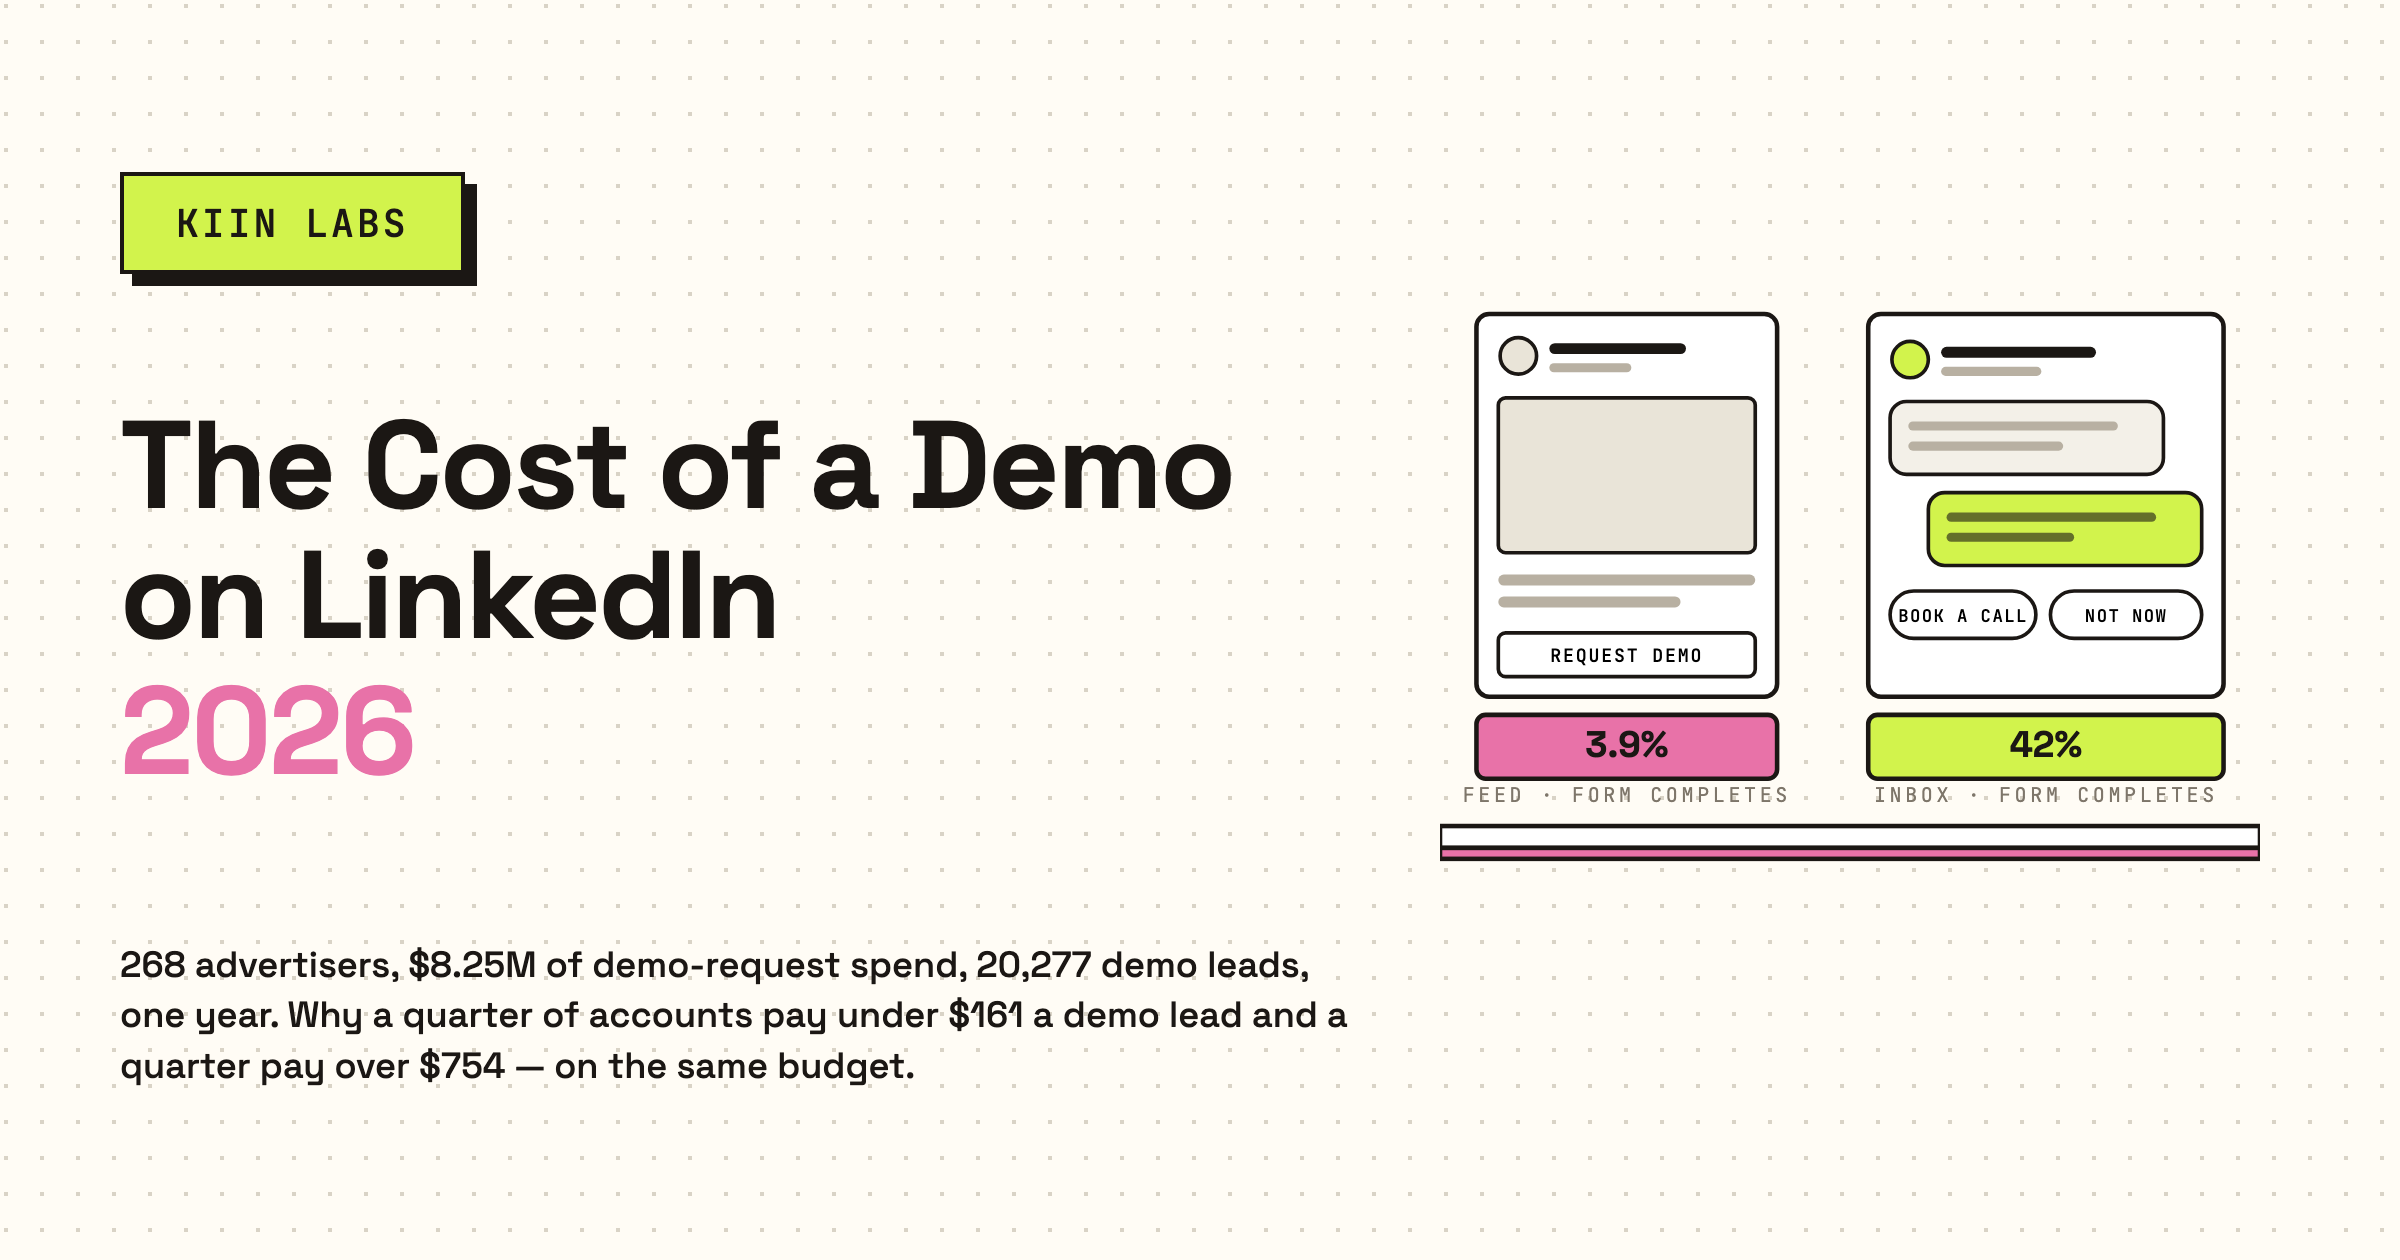
The demand-capture half of LinkedIn: every lead-generation campaign whose form asks for a demo, a call, an audit, a quote or a trial, across every advertiser connected to Kiin Intelligence. 1,644 campaigns, 268 accounts, $8.25M, 20,277 demo leads. Every benchmark is a median across advertiser accounts, never a pooled total; every "X is cheaper than Y" is the same advertiser running both, paired within account. Content offers are a different product with a different price and have their own report.
Ilic, P. (2026). The Cost of a Demo on LinkedIn: 2026 benchmarks. Kiin Labs. kiin.co/research/linkedin-demo-request-benchmarks. Figures are medians across advertiser accounts and paired within-account comparisons, USD, 8 Sep 2025 to 7 Sep 2026, demo-request forms only. Free to cite with a link.
This study comes from Kiin Intelligence, the analytics layer behind Kiin, a London LinkedIn Ads agency with three ex-LinkedIn Marketing Solutions staff and 200+ B2B accounts under management.
See which tier your account is in. Send read access to your LinkedIn Ads account and we'll show you your demo CPL, your pool sizes and your placement split against every table in this report.Free. Read-only access. No deck, no call, one page.
- ▶Everyone asks what a demo costs. The answer is: which quarter are you in?
- ▶The six findings that carry the report
- ▶How Kiin runs demo capture now: 7 rules
- 00The panel, the four tiers, and how to read the numbers
- 01Placement: the inbox is where demo asks convert
- 02What a demo lead is made of: friction in the feed, fit in the inbox
- 03Audience type and the pool: why retargeting accounts lose
- 04Audience size: opposite rules for feed and inbox
- 05Scale, bids, the ask, the format, and who you target
- 06Inside one account: the best demo campaign vs the worst
- 07What did not show up: copy, form design, intent, and demand gen
- 08What a winner looks like: eleven accounts, de-identified
- 09Twenty-one numbers to quote
- 10Twelve myths, with the verdict
- —Glossary
- —Method, robustness, and what we can't answer
- —Questions this report answers
Everyone asks what a demo costs. The answer is: which quarter are you in?
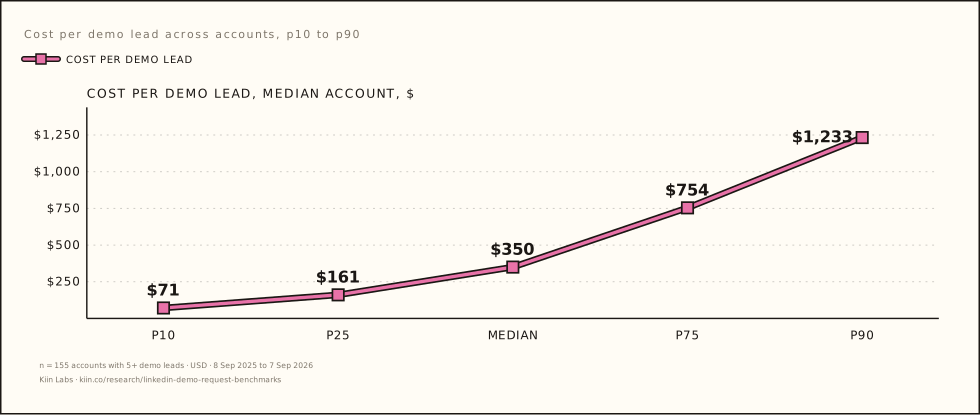
The question we get most from B2B marketers is some version of "what should a demo request cost on LinkedIn?" The honest answer has never been a number. It is a range so wide that the number in the middle tells you almost nothing: at the median account a demo lead costs $350, but a quarter of accounts get them for under $161 and a quarter pay more than $754. Same platform, same objective, same kind of form.
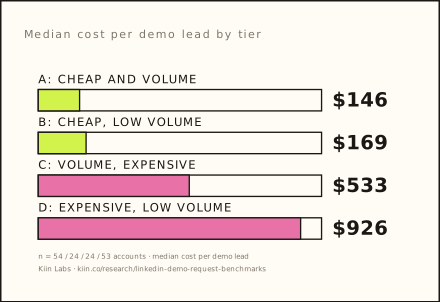
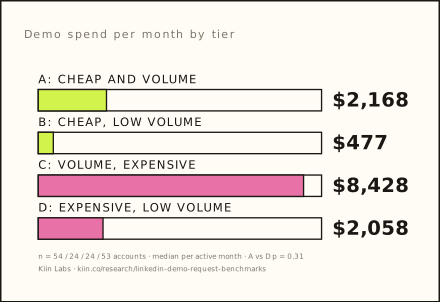
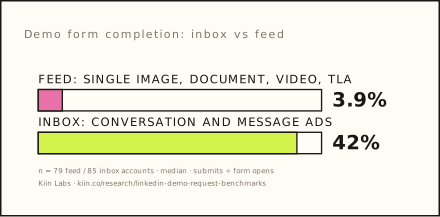
So this report is not really about the $350. It is about the 5x spread and what sits inside it. We split the 155 accounts with meaningful demo volume into four tiers by cost and by volume, and the first thing that fell out was that the accounts paying $146 a demo lead and the accounts paying $926 spend the same per month, $2,168 against $2,058. Budget is not what separates them. Six things are, and the biggest by a distance is where the form sits: a demo ask in the inbox costs 57% less per lead than the same ask in the feed, in the same account, because the form completes 42% of the time instead of 3.9%.
It is the fourth Kiin Labs report and it is built the way the first, the second and the third were: medians across accounts, never pooled totals; every "cheaper than" paired inside one account; a confidence interval on every claim, and a star key that says how many accounts it rests on. Two findings in it cut against things we have said ourselves. Retargeting is not the cheap demo audience people assume, because the pools are too small and get exhausted. And running demand generation alongside demo capture does not make the demo lead cheaper; it makes the pool bigger. Both are in the report as found.
What we still cannot say is what happens after the form: whether a $146 demo lead and a $926 demo lead are the same quality. That needs a CRM join, and it is the next chapter, not this one.
Use the tables. Cite the numbers. Tell us where we are wrong.
Phil Ilic
Co-founder and CEO, Kiin · London, September 2026
The six findings that carry the report
Each one links to the chapter with the table behind it. Stars are the number of paired accounts (★ 5+, ★★ 25+, ★★★ 100+); ✱ means the 95% interval excludes zero.
A demo campaign is two decisions and a discipline. Decision one: inbox or feed. Decision two: how big a pool, which is the opposite answer for each placement. The discipline: watch cumulative frequency and rotate the pool before it drains. Almost everything else people tune, the copy, the form fields, the number of creatives, is either noise or a small effect next to those three. The bid is the exception: let max delivery set the price and you pay double, in either placement. Chapters 01 to 06 show the tables.
How Kiin runs demo capture now: 7 rules
The findings are what the data says. These are the decisions we took from it, the operating rules on every demand-capture campaign we run. Each is tied to the chapter it rests on.
The demo ask goes in the inbox: conversation ad, manual CPM, bid low
Feed demo forms only on a document or a thought leader ad, never on a single image.
Chapter 01, finding 01 →Inbox audiences under 40,000
A curated list, a warm pool, or a tight cold segment. Never a 200,000-person cold inbox campaign.
Chapter 04 →If it has to be feed: cold, 100,000+, Director+ floor, enhanced conversion bid, document or TLA carrier, 4+ creatives
Every one of those moves the number in the same direction.
Chapters 04 and 05 →In the inbox, ask for a call, not "a demo"
Cross-account, strict classifier: demo $566 vs call $342, and the whole gap is in the inbox ($431 vs $327); in the feed the wording does not move it ($695 vs $684). A benchmark to test, not a rule.
Chapter 05 →Watch cumulative frequency, not time. Rotate the pool, not the creative
At 1-2x of the audience CPL is +34%; past 4x it is +122%, lists +223%. New creative on a drained pool changes nothing.
Chapter 03 →Volume comes from adding pools, not from adding spend to one
Expect +17-20% CPL per doubling of budget in the same set-up. Add a segment before you add a dollar.
Chapter 05 →Never hand the bid to max delivery. Report demo CPL split by placement and by pool
Inbox: manual CPM, −50% per lead paired. Feed: enhanced conversion, −38% paired. A blended demo CPL hides the one number that explains it.
Chapter 05 →
The panel, the four tiers, and how to read the numbers
1,644 demo campaigns, 268 accounts, $8.25M, 20,277 demo leads. Split at the median cost and the median volume, the panel falls into four kinds of account, and the two that matter spend the same money.
Every lead-generation-objective campaign with delivery across accounts connected to Kiin Intelligence, 8 Sep 2025 to 7 Sep 2026, whose lead gen form asks for a demo, a call, an audit, a quote or a trial. Campaigns under $100 and LinkedIn Audience Network delivery are excluded. Demo asks are 38% of lead-generation-objective spend; content offers are another 38%; the remaining 24% could not be classified or has no form synced and is out. 268 accounts ran a demo ask; 155 got five or more demo leads and are the base for every account-level figure below. Seventeen accounts spent $1,000 or more and got no demo lead at all ($48,719, 1% of demo spend).
1. The distribution
| Per account, median | p10 | p25 | Median | p75 | p90 |
|---|---|---|---|---|---|
| Cost per demo lead | $71 | $161 | $350 | $754 | $1,233 |
| Demo leads per active month | 1.4 | 2.3 | 6.6 | 17.0 | 43.8 |
| Demo spend per active month | $519 | $1,082 | $2,142 | $5,182 | $12,810 |
| Demo leads per $1,000 | 0.8 | 1.3 | 2.9 | 6.2 | 14.0 |
155 accounts with 5+ demo leads. The pooled figure (spend ÷ leads) is $407 and is dominated by the biggest spenders; it is not quoted. If you want a "good" number: the top quarter of accounts is under $161 a demo lead and over 17 a month.
2. The four tiers
Split the 155 accounts at the median cost ($350) and the median volume (6.6 a month) and you get four kinds of demo account. Tier A gets cheap leads at volume; tier D pays most and gets least. The whole report is about what A does that D does not.
| Tier | Accounts | Median CPL | Leads / month | Spend / month | Inbox share | Cold share | Retargeting share | Audience | Completion |
|---|---|---|---|---|---|---|---|---|---|
| A · cheap and volume | 54 | $146 | 17.6 | $2,168 | 86% | 52% | 6% | 32,000 | 31% |
| B · cheap, low volume | 24 | $169 | 2.8 | $477 | 100% | — | 26% | 9,200 | 31% |
| C · volume, expensive | 24 | $533 | 14.7 | $8,428 | 77% | — | 20% | 40,000 | 15% |
| D · expensive and low volume | 53 | $926 | 2.0 | $2,058 | 23% | 0% | 36% | 11,000 | 4.7% |
Shares are spend-weighted within the tier; audience is the spend-weighted geometric mean. Tier B is inbox-only accounts on tiny budgets ($477 a month). Tier C is uploaded lists in the inbox at $8,428 a month: they bought volume and paid the list premium for it (51% of their spend is on lists).
| Winners (A) vs losers (D), medians | A | D | p |
|---|---|---|---|
| Cost per thousand impressions or sends | $276 | $230 | 0.95 |
| Spend per month | $2,168 | $2,058 | 0.31 |
| Form opens per impression | 0.68% | 0.42% | <0.001 ✱ |
| Form completion | 31% | 4.7% | <0.001 ✱ |
| Leads per impression | 0.172% | 0.021% | <0.001 ✱ |
| Inbox share of demo spend | 86% | 23% | 0.015 ✱ |
| Cold share | 52% | 0% | <0.001 ✱ |
| Retargeting share | 6% | 36% | 0.001 ✱ |
| Audience size | 32,287 | 11,213 | 0.010 ✱ |
| Creatives per campaign | 3.3 | 5.0 | 0.035 ✱ |
| Form questions | 6 | 6 | 0.13 |
| Seniority floor | Senior | Senior | 0.06 |
Mann-Whitney. Winners have fewer creatives per campaign because their inbox campaigns are single-message; read chapter 05 before concluding fewer is better.
3. How to read the numbers
Every benchmark is the median across advertiser accounts. Every comparison marked paired is the same account running both settings, reported as the median of each account's own ratio with a 95% bootstrap interval; ✱ means the interval excludes zero, "ns" means it does not. ★ is 5+ paired accounts, ★★ 25+, ★★★ 100+. Cross-account tables are benchmarks, confounded by market, offer and CPM; paired and fixed-effects results are the ones to quote as rules. No cell with fewer than seven accounts is published.
The inbox is where demo asks convert: −57% per lead in the same account
A demo form in a conversation ad completes 42% of the time. The same form on a feed ad completes 3.9% of the time. The inbox costs five times more to reach, and it is still 57% cheaper per demo lead.
This is the one finding that survives every test in the study. Paired across the 23 accounts running demo asks in both placements, inbox is cheaper in 20, median −57% [−69%, −29%]. With account fixed effects across 661 campaigns, −61%. Inside a single account, the best demo campaign is inbox and the worst is feed in 14 of the 15 cases where they differ (sign test p = 0.001), and 11 of 11 on the second-best against second-worst check, the only set-up feature that survives that check. At every robustness threshold tried, from 1 lead per side up to 10, the paired effect is −36% to −57%, n = 21 to 48.
![Inbox vs feed paired within account: cost per demo lead −57% [−69, −29] significant; form open rate −12% ns; cost per thousand +417% [+320, +610] significant](/research/demand-2026/ch02-fig02-paired-inbox-vs-feed.svg)
| Inbox vs feed, paired within account | Median ratio | 95% CI | Inbox lower in | n |
|---|---|---|---|---|
| Cost per demo lead | −57% | [−69%, −29%] | 20 of 23 | ★ ✱ |
| Cost per thousand (impressions or sends) | +417% | [+320%, +610%] | 0 of 49 | ★★ ✱ |
| Form open rate | −12% | [−31%, +10%] | 27 of 49 | ★★ ns |
| Form completion | +1,652% | [+1,072%, +2,258%] | 0 of 31 | ★★ ✱ |
| Lead rate (leads per impression or send) | +1,123% | [+631%, +1,989%] | 4 of 43 | ★★ ✱ |
Open rate is the same in both placements; the entire effect is what happens after the open. A form inside the inbox is pre-filled and two taps from done; a form behind a feed ad has already lost the reader to the scroll.
Two cautions. Inbox delivery is one send per person per 30 to 45 days, so an inbox campaign cannot be scaled by raising the budget; it scales by adding people to the pool (chapter 04 on how big that pool should be). And inbox copy, sender and bid amounts are not in the data, so this chapter cannot say which message wins; it says only that the placement does.
Friction in the feed, cost per send and fit in the inbox
Cost per lead is cost per thousand, divided by how many open the form, divided by how many finish it. Which of the three matters depends entirely on the placement.
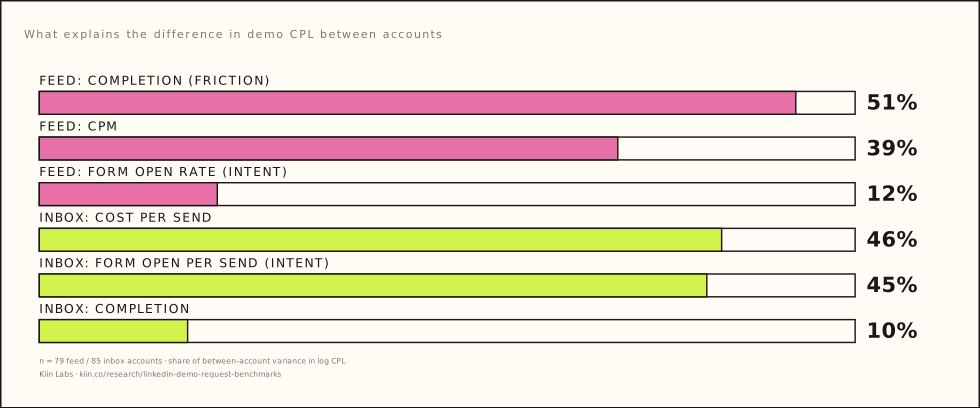
Take the log of cost per lead and split its variance between accounts into the three parts. In the feed, form completion (friction) explains 51%, CPM 39%, and form-open rate (intent) only 12%. In the inbox, completion is a solved problem at 42% and explains 10%; cost per send explains 46% and whether the right people open the form explains 45%. The feed is a friction-and-CPM game. The inbox is a targeting game.
| Winners' vs losers' campaigns, medians | Winners (A) | Losers (D) |
|---|---|---|
| Feed: CPM | $62 | $108 |
| Feed: form open per impression | 0.48% | 0.40% |
| Feed: completion | 3.8% | 1.3% |
| Feed: audience | 52,000 | 15,000 |
| Inbox: cost per send | $0.60 | $0.64 |
| Inbox: open rate | 43% | 40% |
| Inbox: leads per 1,000 sends | 2.24 | 0.60 |
| Inbox: audience | 16,000 | 14,000 |
209 / 144 feed campaigns; 263 / 99 inbox campaigns. In the inbox, winners and losers pay the same per send and get the same open rate. Winners get nearly four times the leads per thousand sends. The whole difference is what happens after the open: the offer, and whether the person opening it is a buyer.
Why retargeting accounts lose: the pool runs out
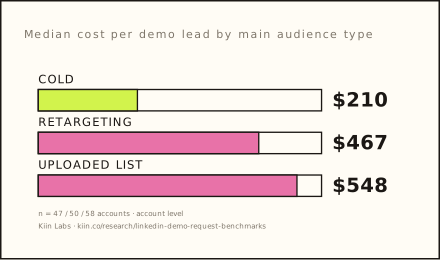
At the account level, cold audiences produce demo leads at $210 and retargeting at $467. Paired inside one account, retargeting is 10 to 20% cheaper than cold. Both are true, and the second explains the first.
| Main demo audience (account level) | Accounts | Median CPL | Leads / month | Share winners (A) | Share losers (D) | Median audience |
|---|---|---|---|---|---|---|
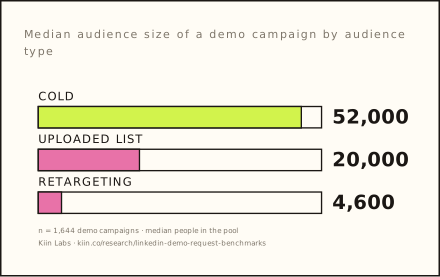
| Cold | 47 | $210 | 11.1 | 57% | 11% | 52,000 |
| Uploaded list | 58 | $548 | 8.0 | 28% | 40% | 20,000 |
| Retargeting | 50 | $467 | 2.9 | 22% | 50% | 4,600 |
Grouped by the audience type carrying most of the account's demo spend. Cross-account model, holding the rest constant: retargeting share +203% ✱ on CPL, list share +108% ✱.
Paired, it flips
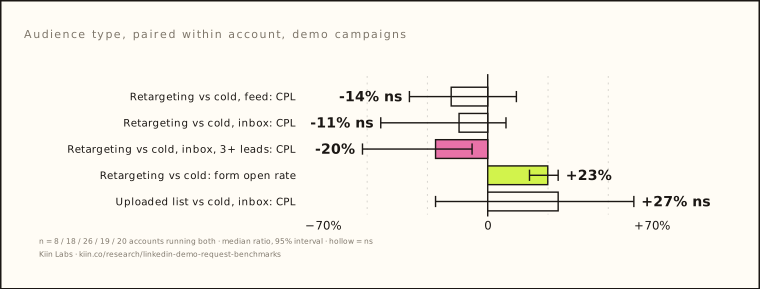
| Same account, demo campaigns | Median ratio | 95% CI | Cheaper in | n |
|---|---|---|---|---|
| Retargeting vs cold, feed, CPL | −14% | [−30%, +11%] | 5 of 8 | ★ ns |
| Retargeting vs cold, inbox, CPL | −11% | [−41%, +7%] | 11 of 18 | ★ ns |
| Retargeting vs cold, inbox, ≥3 leads per side | −20% | [−48%, −6%] | 19 of 26 | ★★ ✱ |
| Retargeting vs cold, form open rate | +23% | [+16%, +27%] | — | ★ ✱ |
| List vs cold, inbox, CPL | +27% | [−20%, +56%] | 8 of 20 | ★ ns |
Retargeting is not intrinsically worse per lead. Warm people open the form 23% more often and, campaign for campaign, convert a little cheaper. The accounts that depend on retargeting lose for a different reason.
The reason: the pool is 4,600 people and it gets hammered
The median retargeting audience used for a demo campaign is 4,600 people (p25 1,600, p75 15,000). Lists are 20,000; cold 52,000. Feed retargeting demo campaigns deliver 4 to 16 times their audience size over their life; small ones (under 5,200 people) deliver 15.7x. Every campaign that runs long enough drains its pool, and the cost of the next lead rises as it does. Indexed to each campaign's own first quarter-pass through its audience, cost per lead is 134 at one to two passes, 151 at two to four, and 222 past four. Lists saturate hardest: 323 past four passes. The form-open rate, the intent signal, falls to 66 over the same run.
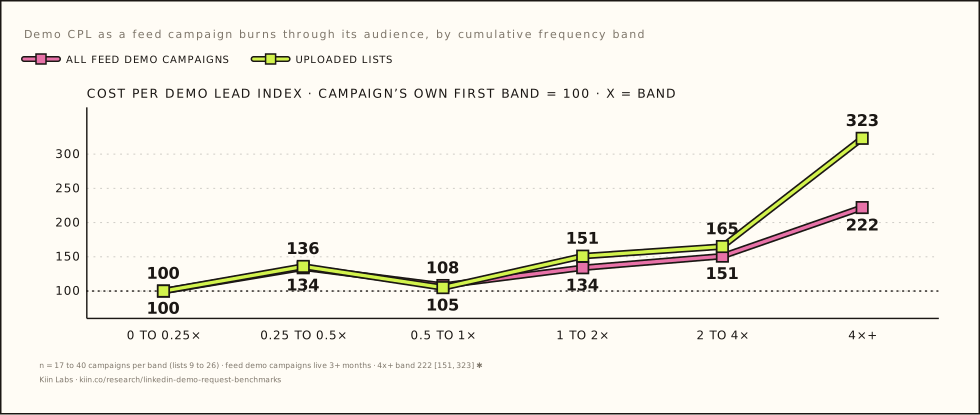
That is the whole "full-funnel" story in one table. The losers are retargeting-and-list-heavy accounts hammering an 11,000-person pool. The winners run cold at 32,000 to 52,000, or lists in the inbox. Retargeting converts best per person; it just has the fewest people. The fix is not to abandon it; it is to rotate the pool before the fourth pass, and to build a bigger one, which is what chapter 07 says demand generation is actually for.
Opposite rules for feed and inbox
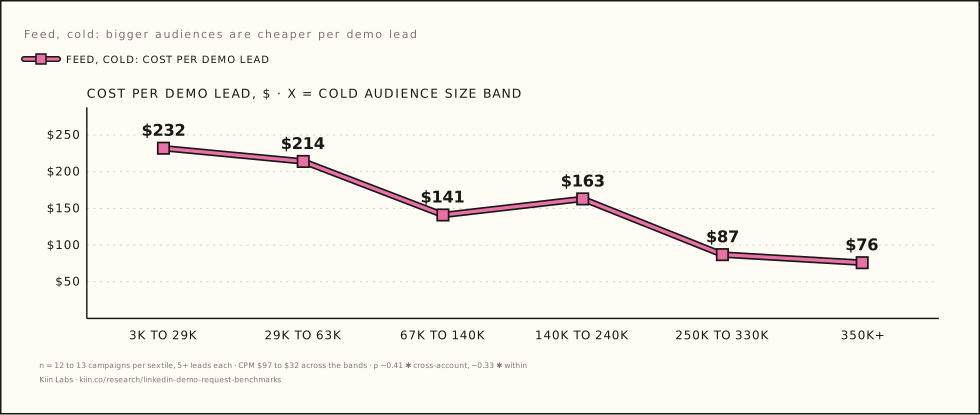
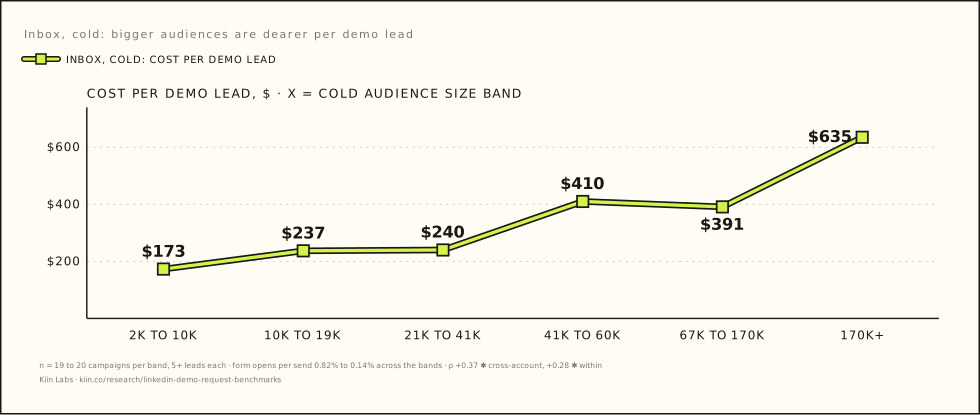
In the feed, bigger audiences are cheaper per demo lead. In the inbox, bigger audiences are dearer. Both hold within account. The reason is the pricing model.
Feed, cold: go broad
Inbox, cold: go tight
| Inbox, retargeting, by audience size | Campaigns | Median CPL | Form open per send | Completion |
|---|---|---|---|---|
| 330 – 1,200 | 14 | $150 | 1.12% | 52% |
| 1,200 – 2,300 | 14 | $214 | 0.66% | 60% |
| 2,500 – 4,400 | 14 | $308 | 0.44% | 50% |
| 4,800 – 12,000 | 14 | $146 | 0.70% | 38% |
| 13,000 – 27,000 | 14 | $320 | 0.35% | 50% |
| 35,000 – 490,000 | 15 | $530 | 0.40% | 40% |
The cheapest demo leads in the study are inbox retargeting on pools under 2,300 people: $150 to $214. They are cheap because everyone in the pool has already met the brand; they are few because the pool is tiny. ρ +0.30 ✱ cross-account, +0.35 ✱ within.
Scale, bids, the ask, the format, and who you target: function, seniority, company size, region, industry
Diminishing returns are real but not a wall. Let LinkedIn's max delivery set the bid and you pay double. The word "demo" costs more than "call", but only in the inbox. The senior floor everyone fears is free, company size does not move the number, and the technical buyer costs twice the commercial one.
1. Scale
Within account, with fixed effects, cost per demo lead rises 25% for every e-fold (2.7x) of spend, about 17% per doubling ✱. Within a campaign, month to month, the correlation between spend and CPL is +0.30 ✱. Across accounts the slope is steeper (+66% per e-fold) but confounded: big accounts also run dearer set-ups, enterprise lists, US markets, healthcare. Read it as: doubling demo budget in the same set-up costs 17 to 20% more per lead, which is the in-market pool being drained, not a cliff. The volume tier (C) pays $533 at $8,428 a month; they bought volume with lists in the inbox and accepted the price. Volume comes from adding pools, not from adding spend to one.
2. Bid
The correction. Version 1.0 said enhanced-conversion accounts pay $515 a demo lead against $342 on manual CPM, and "let LinkedIn optimise for leads and you pay more". That comparison was placement in disguise. Every inbox campaign in the panel bids manual CPM (a cost per send) or LinkedIn's max delivery; every feed campaign bids enhanced conversion, max delivery or manual CPC. The bid column was re-measuring chapter 01. The like-for-like test is inside one placement, paired within account, and it says something different and more useful.
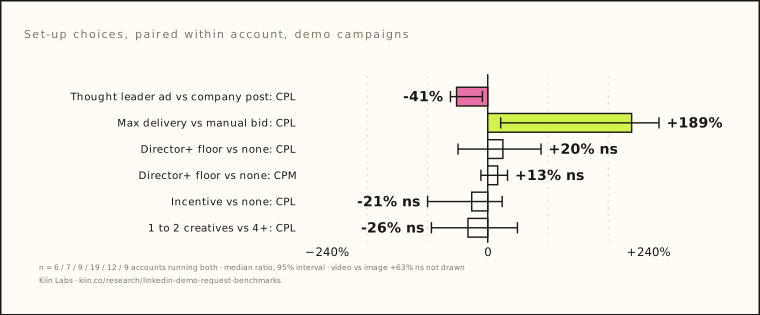
![Bid strategy paired within account inside one placement: inbox manual CPM vs max delivery CPL −50% [−82, −6] significant; feed enhanced conversion vs max delivery CPL −38% [−65, −24] significant](/research/demand-2026/ch05-fig02-bid.svg)
In the inbox, set the cost per send yourself. Manual CPM against max delivery: −50% [−82%, −6%] per lead, cheaper in 14 of 17 accounts ✱. Cross-account the same shape: $286 at the median manual-CPM account (101 accounts) against $684 on max delivery (27). This is the conversation-ads finding from Report No. 2 again: the inbox charges per send whatever happens, so the only lever on price is the price you set. In the feed, if a lead is what you want, bid for leads. Enhanced conversion against max delivery: −38% [−65%, −24%], cheaper in 10 of 11 ✱. Cross-account the sign is the other way (enhanced $622 on 69 accounts, max delivery $506 on 34) because the enhanced-conversion accounts are the bigger, dearer set-ups: US, lists, healthcare. The paired result inside one account is the one to act on. Manual CPC and cost cap in the feed: too few pairs to say.
So the rule is not "no enhanced conversions". It is: never let max delivery set the price. Inbox, manual CPM, low. Feed, enhanced conversion.
3. The ask
How the ask is read, and the correction. LinkedIn's form call-to-action field is nearly useless for this: it mostly carries the thank-you button (VISIT_COMPANY_WEBSITE, LEARN_MORE) and REQUEST_DEMO barely appears. So the ask is classified from the form's own words: name, headline, description, button label and thank-you text. Version 1.0 used the Report No. 3 rule, which matches keywords in the order trial → quote → audit → demo → call. That order leaks. "Schedule a demo … life-cycle assessment" lands in audit because "assessment" fires first; a demo form whose description says "get started in minutes" lands in free trial; a financing application whose thank-you text promises "our advisor will call you" lands in book a call. Re-classified headline-first, with the description only as a fallback, two of the four published numbers hold and two do not.
| Ask on the form | v1.0: accounts · median CPL | v1.1 strict: accounts · median CPL | Verdict |
|---|---|---|---|
| "Request a demo" | 104 · $611 | 112 · $566 | Holds |
| Book a call or meeting | 41 · $342 | 39 · $342 | Holds |
| Audit or assessment | 22 · $260 | 7 · $152 | Withdrawn. 83 of the campaigns classed as audit were demo forms that mention an assessment |
| Free trial | 11 · $362 | under 7 accounts | Withdrawn. Collapses into demo and unclear |
| No clear ask in the form | — | 34 · $116 | Not a demo benchmark: franchise enquiries, financing applications, low intent |
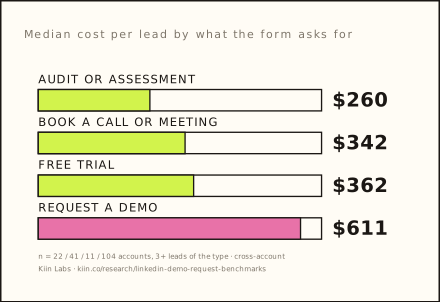
Split by placement, the gap is an inbox thing: inbox demo $431 against call $327 (69 / 23 accounts); feed demo $695 against call $684 (58 / 18), no difference. Within account, the eight advertisers that run both read the other way (demo −24%, ns). So this is a benchmark and a hint, not a rule: if you run demo asks in the inbox, test "book a call". In the feed the wording does not move the number; the placement does. The creative button says the same thing (LEARN_MORE $232, REQUEST_DEMO $578, campaign level, 116 / 97) and has the same weakness: advertisers who write "demo" tend to sell software with bigger deals.
4. Format, inside the feed
| Feed demo forms, within account | Effect on CPL | n |
|---|---|---|
| Document ad vs single image | −80% ✱ | fixed effects; few demo documents |
| Thought leader ad vs company post | −32% ✱ (paired −41% [−49%, −7%], 5 of 6) | ★ |
| Video vs single image | +63% ns [−13%, +508%] | ★ |
| More creatives (per e-fold) | −20% ✱ | fixed effects |
If it has to be feed, the form goes on a document or a thought leader ad. Winners have fewer creatives per campaign (3.3 vs 5.0) only because their inbox campaigns are single-message; within account, more creatives is cheaper.
5. Who you target: function, seniority, company size, region, industry
Cross-account benchmarks, not paired rules. The industry you sell into, the function you ask for and the size of company you target are all confounded with what the advertiser sells, and advertiser ACV, deal size and own industry are not recorded for any account in the panel, so none of this can be cut by what the demo is worth. Read them as floors: the number to expect before your set-up moves it. Every cell is accounts with three or more demo leads on campaigns that use that targeting; cells under seven accounts are not shown; LinkedIn Audience Network excluded. Every chart below has its full table underneath, with the accounts, spend, demo leads and quartiles behind each cell.
Job function. The technical buyer costs about twice the commercial one. Campaigns that include Business Development ($262), Sales ($304) or Marketing ($312) get a demo lead for a quarter less than the panel; Product Management ($700), Engineering ($532), Operations ($492), Finance ($486) and IT ($471) pay a quarter to three-quarters more. No function targeting at all sits at $393. Placement does not explain it: the inbox share is 71-85% across the cheap and the dear functions alike. Part of it is what is being sold (a product-management demo is usually a software demo with a bigger deal behind it); part is that technical buyers open fewer forms.
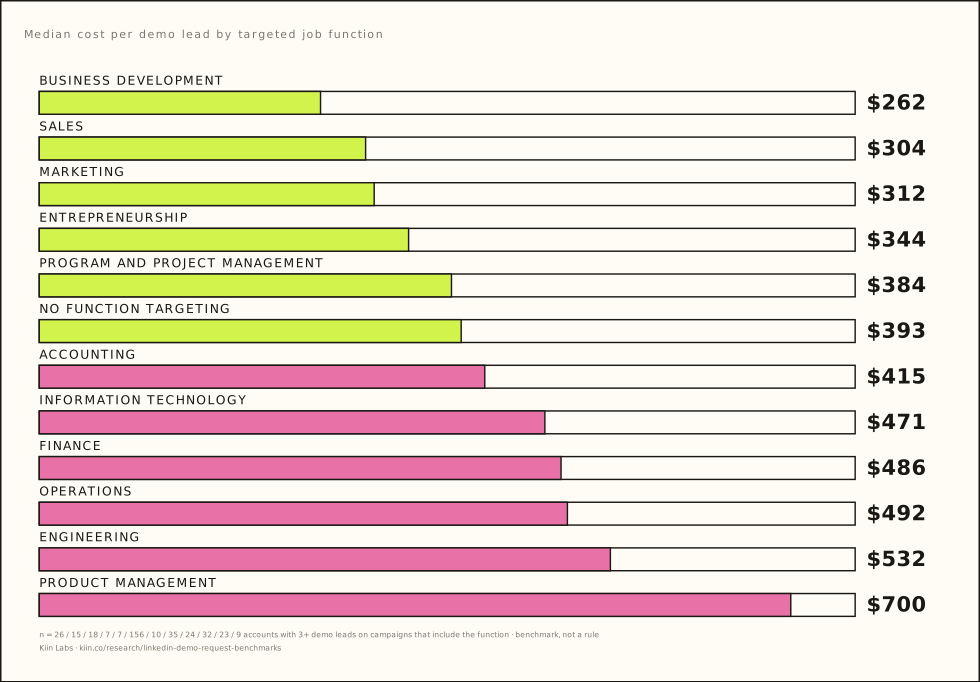
| Targeted job function (campaign includes it) | Accounts | Spend | Demo leads | p25 | Median demo CPL | p75 | Inbox share |
|---|---|---|---|---|---|---|---|
| Business Development | 26 | $510,457 | 1,820 | $137 | $262 | $809 | 74% |
| Sales | 15 | $240,274 | 1,389 | $88 | $304 | $356 | 71% |
| Marketing | 18 | $733,920 | 1,913 | $113 | $312 | $827 | 76% |
| Entrepreneurship | 7 | $313,030 | 437 | $179 | $344 | $462 | 85% |
| Program and Project Management | 7 | $89,253 | 422 | $157 | $384 | $523 | 37% |
| (no function targeting) | 156 | $5,586,603 | 13,879 | $153 | $393 | $802 | 63% |
| Accounting | 10 | $316,330 | 678 | $223 | $415 | $541 | 83% |
| Information Technology | 35 | $1,296,038 | 3,125 | $238 | $471 | $785 | 84% |
| Finance | 24 | $419,852 | 809 | $211 | $486 | $759 | 75% |
| Operations | 32 | $816,267 | 1,326 | $208 | $492 | $1,025 | 63% |
| Engineering | 23 | $1,043,783 | 2,587 | $305 | $532 | $1,081 | 83% |
| Product Management | 9 | $832,966 | 867 | $308 | $700 | $847 | 78% |
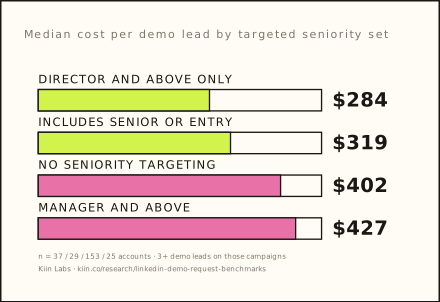
| Targeted seniority set | Accounts | Spend | Demo leads | p25 | Median demo CPL | p75 | Inbox share |
|---|---|---|---|---|---|---|---|
| Director+ only | 37 | $418,997 | 1,965 | $128 | $284 | $470 | 53% |
| includes Senior/Entry | 29 | $1,410,491 | 2,842 | $141 | $319 | $555 | 82% |
| no seniority targeting | 153 | $5,879,556 | 14,021 | $167 | $402 | $852 | 65% |
| Manager+ | 25 | $545,618 | 1,449 | $229 | $427 | $998 | 73% |
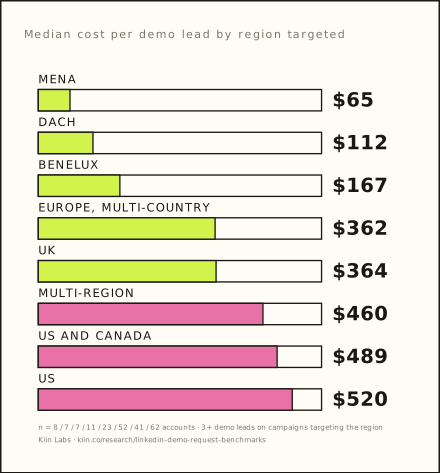
| Region targeted | Accounts | Spend | Demo leads | p25 | Median demo CPL | p75 | Inbox share |
|---|---|---|---|---|---|---|---|
| MENA | 8 | $26,678 | 455 | $36 | $65 | $145 | 34% |
| DACH | 7 | $161,484 | 1,687 | $57 | $112 | $285 | 14% |
| Benelux | 7 | $11,972 | 40 | $142 | $167 | $431 | 68% |
| Europe (multi) | 11 | $151,446 | 427 | $231 | $362 | $457 | 62% |
| UK | 23 | $505,077 | 1,296 | $197 | $364 | $747 | 59% |
| Multi-region | 52 | $2,404,082 | 4,360 | $252 | $460 | $971 | 73% |
| US+Canada | 41 | $2,658,891 | 5,795 | $250 | $489 | $808 | 72% |
| US | 62 | $1,902,631 | 4,067 | $252 | $520 | $994 | 67% |
Company size. Not a cost driver for demo asks. Every band from 201-500 up to 10,001+ sits within $328-352. Only the small-company bands are cheaper (51-200 $267, 11-50 $239, 2-10 $217), and campaigns with no size targeting at all pay the most, $439. The old advice to stay out of enterprise bands because they are dear is not in this data. Titles. No difference: $378 with title targeting (114 accounts), $391 without (127).
| Targeted company size (campaign includes band) | Accounts | Spend | Demo leads | p25 | Median demo CPL | p75 | Inbox share |
|---|---|---|---|---|---|---|---|
| (no size targeting) | 149 | $4,943,909 | 11,812 | $179 | $439 | $860 | 63% |
| 2–10 employees | 10 | $181,665 | 594 | $175 | $217 | $365 | 60% |
| 11–50 employees | 22 | $491,663 | 1,400 | $175 | $239 | $659 | 73% |
| 51–200 employees | 41 | $1,083,377 | 4,076 | $161 | $267 | $499 | 64% |
| 201–500 employees | 61 | $2,219,132 | 6,048 | $161 | $329 | $514 | 75% |
| 501–1000 employees | 62 | $2,591,941 | 6,385 | $158 | $346 | $727 | 77% |
| 1001–5000 employees | 65 | $2,651,322 | 6,322 | $172 | $344 | $892 | 78% |
| 5001–10000 employees | 57 | $2,371,747 | 5,603 | $167 | $328 | $697 | 76% |
| 10,001+ | 45 | $1,836,963 | 4,002 | $172 | $352 | $879 | 76% |
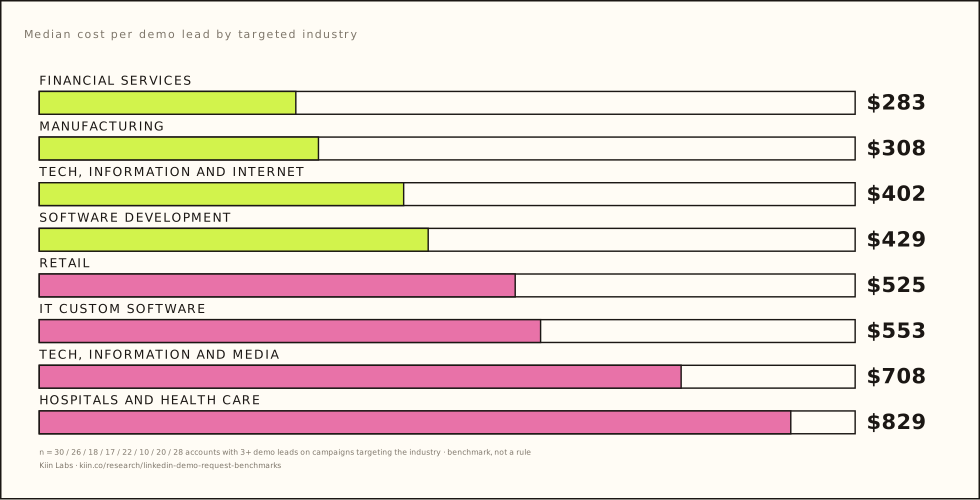
Industry. Targeted industry sets the floor before anything else does: Construction $215 and Banking $216 at one end; Software development $611, Food and beverage retail $676, Tech, information and media $708 and Hospitals and health care $829 at the other. The v1.0 chart carried eight industries and, in error, included LinkedIn Audience Network delivery and counted every account rather than those with three or more leads. Corrected, Software development moves from $429 to $611 and Retail from $525 to $414; the other six cells are unchanged, and eight more clear the seven-account rule.
| Targeted industry (campaign includes it) | Accounts | Spend | Demo leads | p25 | Median demo CPL | p75 | Inbox share |
|---|---|---|---|---|---|---|---|
| Construction | 10 | $114,365 | 410 | $91 | $215 | $713 | 6% |
| Banking | 7 | $52,088 | 148 | $165 | $216 | $414 | 79% |
| Financial Services | 22 | $324,410 | 986 | $150 | $283 | $606 | 73% |
| Manufacturing | 15 | $287,074 | 664 | $188 | $308 | $775 | 73% |
| Transportation, Logistics, Supply Chain and Storage | 12 | $99,582 | 187 | $106 | $308 | $541 | 24% |
| Pharmaceutical Manufacturing | 7 | $124,684 | 470 | $181 | $348 | $1,164 | 63% |
| Appliances, Electrical, and Electronics Manufacturing | 10 | $111,820 | 574 | $166 | $363 | $611 | 88% |
| Technology, Information and Internet | 14 | $299,405 | 851 | $156 | $402 | $651 | 85% |
| Retail | 14 | $170,390 | 403 | $207 | $414 | $1,487 | 50% |
| Industrial Machinery Manufacturing | 7 | $108,400 | 500 | $109 | $427 | $732 | 66% |
| IT System Custom Software Development | 7 | $252,909 | 743 | $285 | $553 | $964 | 89% |
| Medical Equipment Manufacturing | 8 | $110,743 | 487 | $200 | $574 | $839 | 70% |
| Software Development | 10 | $342,710 | 1,267 | $158 | $611 | $1,081 | 86% |
| Food and Beverage Retail | 7 | $51,710 | 246 | $155 | $676 | $968 | 61% |
| Technology, Information and Media | 12 | $355,660 | 610 | $400 | $708 | $937 | 79% |
| Hospitals and Health Care | 18 | $365,843 | 486 | $397 | $829 | $1,329 | 63% |
6. Audience type and format, by placement
Chapter 04 from the other side. Cold in the feed is the cheapest cell in the study at $194, and the only feed cell under $600; anything narrow in the feed, a list or a retargeting pool, costs $681-689. In the inbox the three audience types sit within $283-343 of each other. The inbox flattens the audience-type difference; the feed magnifies it. On format, message ads (the single-message inbox unit) read $180 against $417 for conversation ads on 40 accounts and are worth their own test; the $743 on thought leader ads is twelve dear set-ups, not evidence against the carrier, since the paired result in §4 (−41% against a company post in the same account) is the one to act on.
| Audience type × placement | Accounts | Spend | Demo leads | p25 | Median demo CPL | p75 | Inbox share |
|---|---|---|---|---|---|---|---|
| cold · feed | 36 | $506,878 | 2,585 | $120 | $194 | $431 | 0% |
| retargeting · inbox | 71 | $955,756 | 2,894 | $150 | $283 | $547 | 100% |
| cold · inbox | 51 | $1,631,420 | 4,425 | $136 | $315 | $502 | 100% |
| list · inbox | 56 | $2,987,909 | 7,022 | $225 | $343 | $691 | 100% |
| list · feed | 51 | $1,355,582 | 2,187 | $324 | $681 | $1,262 | 0% |
| retargeting · feed | 47 | $817,117 | 1,164 | $367 | $689 | $1,373 | 0% |
Audience size by placement, all audience types (chapter 04 charted the cold campaigns only):
| Audience size band × placement | Accounts | Spend | Demo leads | p25 | Median demo CPL | p75 | Inbox share |
|---|---|---|---|---|---|---|---|
| <10k · inbox | 73 | $826,568 | 2,394 | $163 | $293 | $591 | 100% |
| 10–30k · inbox | 53 | $1,004,527 | 2,710 | $165 | $282 | $546 | 100% |
| 30–100k · inbox | 48 | $1,331,266 | 3,631 | $153 | $318 | $546 | 100% |
| 100–300k · inbox | 18 | $1,186,857 | 3,202 | $232 | $319 | $686 | 100% |
| 300k+ · inbox | 22 | $874,131 | 1,990 | $243 | $376 | $856 | 100% |
| <10k · feed | 43 | $590,633 | 941 | $314 | $668 | $1,244 | 0% |
| 10–30k · feed | 29 | $441,140 | 844 | $434 | $647 | $1,140 | 0% |
| 30–100k · feed | 35 | $396,730 | 1,121 | $168 | $525 | $932 | 0% |
| 100–300k · feed | 34 | $706,316 | 1,774 | $178 | $330 | $723 | 0% |
| 300k+ · feed | 24 | $266,410 | 982 | $86 | $395 | $1,045 | 0% |
| Format | Accounts | Spend | Demo leads | p25 | Median demo CPL | p75 | Inbox share |
|---|---|---|---|---|---|---|---|
| document | 8 | $25,603 | 263 | $87 | $93 | $172 | 0% |
| message ad | 40 | $664,450 | 2,538 | $124 | $180 | $300 | 100% |
| video | 15 | $353,440 | 677 | $150 | $291 | $1,563 | 0% |
| conversation ad | 89 | $4,910,635 | 11,803 | $218 | $417 | $700 | 100% |
| single image | 80 | $1,993,903 | 3,817 | $185 | $640 | $1,377 | 0% |
| thought leader ad | 12 | $267,886 | 1,009 | $629 | $743 | $962 | 0% |
7. Free trials, briefly
Version 1.0 put cost per free trial at $362 on 11 accounts. Under the strict classifier the free-trial set falls below seven accounts, because most of its campaigns were demo forms whose description mentioned getting started, and the number is withdrawn. What survives: free-trial asks are rare on LinkedIn, about 2.5% of demo-type spend, mostly non-tech advertisers on uploaded lists; feed trial forms complete at 8%; and the panel is too small to price them.
The best demo campaign vs the worst, in the same account
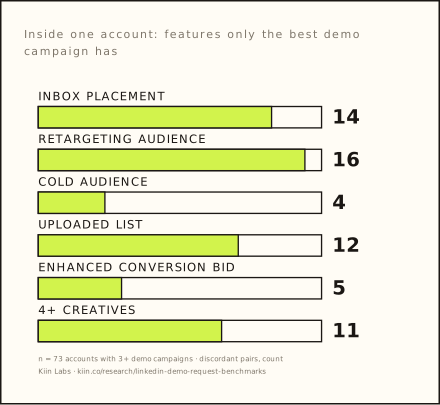
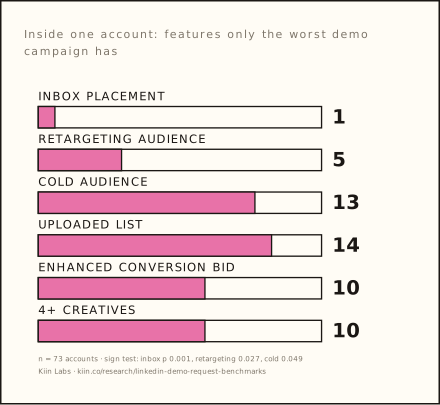
Take every account with three or more demo campaigns and compare its best campaign to its worst. The worst costs 4.8x the best. Then ask what the best one has that the worst does not.
73 accounts qualify. Placement, audience type and bid are choices made before the outcome, so reading them off the best and worst campaigns is safe from regression to the mean; the metric gaps (form open +68%, completion 40% vs 22%) are partly mechanical and are not the finding. The set-up shares are.
| Regression-to-the-mean check | Accounts | Worst ÷ best CPL | Inbox, better-only vs worse-only | p |
|---|---|---|---|---|
| Best vs worst | 73 | 4.8x | 14 vs 1 | 0.001 ✱ |
| Second-best vs second-worst | 55 | 2.4x | 11 vs 0 | 0.001 ✱ |
| Best vs worst, same 55 accounts | 55 | 6.6x | 13 vs 1 | 0.002 ✱ |
The second-best/second-worst pass is the check that the pattern is not carried by one lucky and one unlucky campaign per account. Placement is the only feature that survives it. Retargeting (8 vs 4) and cold (7 vs 3) do not.
Note what this table says about retargeting: inside one account, the retargeting campaign is more often the best than the worst. Retargeting converts. The accounts in chapter 03 that lose on it are the ones that run only retargeting on a pool too small to feed the volume they want.
Copy, form design, "intent", and the demand-gen question
Four things people tune that the data does not reward, and one belief of ours the data reframed.
Messaging
641 feed demo campaigns have their post text. Thirteen copy features were tested: hook length, a question in the hook, "you", first person, a number, an emoji, a link, a percentage, social-proof words, pain-point words, whether it says "demo", whether it says "call". Every one is significant across accounts. Not one survives within account (n = 214, all ns). Different advertisers write differently, and their CPL differs for other reasons; the copy is a marker of the advertiser, not a lever. The same pattern as the thought leader ad report. Inbox copy was never synced, so message-ad copy is untested.
Form design
Question count, a phone field, a calendar on the thank-you page, an incentive: nothing significant on cost per lead at this n (phone −28% completion, ns, 12 of 20; short forms −62% completion, ns, 7 of 9; incentive −21% CPL, ns, 8 of 12). Completion is driven by placement, not by the field list. The one finding in Report No. 3 that a phone field costs two thirds of completions was on content forms; on demo forms the effect is smaller and not significant.
"In-market share"
Form-open rate per impression, the closest thing to an intent signal, barely separates winners from losers in the feed (0.48% vs 0.40%) and explains 12% of feed CPL variance. The in-market fraction is real, but it shows up as saturation (the pool drains as you repeat) and as audience size, not as a static property of a segment you can target for.
Demand generation and the price of a demo lead
The full-funnel claim, ours included, is that awareness and engagement spend makes demand capture cheaper. The panel cannot confirm it. 80% of winners, 92% of losers and 100% of the volume tier run $1,000 or more of demand generation (engagement, brand awareness, video views, content lead gen) alongside demo capture, so the only testable question is whether more of it makes the demo lead cheaper. Matched by total-spend band the sign favours demand gen (n = 7-8 per cell). Within account, comparing months after demand-gen spend to months without, demo CPL is +9% [−7%, +65%], cheaper in 11 of 29. No evidence either way at this n.
| Demand-gen spend in the year | Accounts | Median retargeting pool | Retargeting demo leads | Retargeting demo CPL | Demo CPL, all |
|---|---|---|---|---|---|
| Under $1,000 | 11 | 19,000 | 8 | $309 | $342 |
| $1,000 – 10,000 | 21 | 4,500 | 7 | $251 | $312 |
| $10,000 – 50,000 | 48 | 5,350 | 9 | $525 | $348 |
| $50,000+ | 31 | 7,600 | 29 | $604 | $530 |
Accounts that run retargeting demo campaigns. Demand-gen spend correlates with retargeting demo volume (ρ +0.23 ✱) and not, favourably, with retargeting CPL (ρ +0.40, the big accounts run dearer set-ups). Influenced pipeline is not observable here; that needs a CRM join.
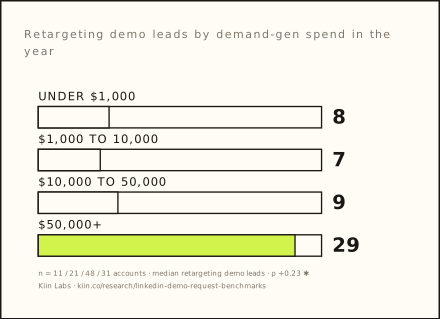
So the reframe: demand generation does not lower the price of a demo lead. It raises the ceiling on how many the warm pool can yield, which, after chapter 03, is the constraint that actually binds. Buy it for volume, not for price.
Eleven accounts that get demo leads at volume, at or under the median cost
The top accounts by demo leads at ≤ $350, de-identified. One pattern, and one counter-example worth a case study.
| # | Region | Demo spend | Leads | CPL | Leads / mo | Formats | Audiences | Ask | Audience | Completion | Cost / send | Bid |
|---|---|---|---|---|---|---|---|---|---|---|---|---|
| W1 | Multi | $821k | 2,396 | $343 | 240 | Conversation 91% | List 78%, retargeting 22% | Demo | 179k | 26% | $0.75 | Manual CPM |
| W2 | DACH | $71k | 1,000 | $71 | 83 | TLA 52%, video 27% | Cold 66%, retargeting 21% | Call | 96k | 8% | $0.17 | Enhanced |
| W3 | US+CA | $217k | 929 | $233 | 71 | Conversation 64%, TLA 16% | List 96% | Demo | 12k | 41% | $1.42 | Manual CPM |
| W4 | US+CA | $176k | 628 | $281 | 70 | Conversation 100% | List 85%, retargeting 10% | Demo | 137k | 23% | $0.29 | Manual CPM |
| W5 | Nordics | $186k | 595 | $312 | 60 | Conversation 81% | List 70%, cold 30% | Demo | 51k | 23% | $0.71 | Manual CPM |
| W6 | India | $53k | 563 | $93 | 47 | Single image 91% | Cold 90% | Call | 184k | 3% | — | Max delivery |
| W7 | US | $66k | 409 | $161 | 41 | Conversation 100% | List 54%, cold 46% | Demo | 154k | 53% | $0.32 | Manual CPM |
| W8 | US | $141k | 409 | $345 | 37 | Conversation 97% | List 77%, cold 23% | Call | 39k | 79% | $1.61 | Manual CPM |
| W9 | US | $126k | 369 | $342 | 37 | Conversation 93% | Cold 93% | Demo | 33k | 58% | $0.60 | Manual CPM |
| W10 | DACH | $41k | 366 | $112 | 73 | Single image 65%, message 26% | Cold 51%, list 47% | Call | 196k | 5% | $0.13 | Enhanced |
| W11 | Multi | $108k | 350 | $308 | 44 | Conversation 73% | List 98% | Demo | 235k | 23% | $1.01 | Manual CPM |
De-identified; a twelfth account at $10 a lead was excluded as an almost certainly misclassified form. Above-median volume months inside an account run at a CPL index of 87 against the account's median; below-median months at 122. Volume and price are not in tension inside a working set-up.
The pattern: conversation ads on a list or a warm pool of 5,000 to 40,000, manual CPM at $0.30 to $0.70 a send, 30 to 50% completion, 10 to 60 demo leads a month at $60 to $250. Eight of the eleven fit it. The counter-example: W2, thought leader ads and video, cold, DACH, asking for a call, $71 a lead on 1,000 leads. It is the feed done the way chapter 05 says the feed has to be done: a person not a logo, a broad cold audience, and the word "call". It is worth a case study of its own.
Twenty-one numbers to quote, with what they rest on
Each one a full sentence, free to cite with a link. The base line says what it rests on: accounts, whether it is paired, and the star.
The median demo request on LinkedIn costs $350. A quarter of accounts pay under $161; a quarter pay over $754.
So: the spread between accounts is 5x; that spread is the study.
Accounts with cheap, high-volume demo leads spend the same per month as the ones paying six times more: $2,168 vs $2,058.
So: budget is not the difference. Set-up is.
Putting a demo ask in the inbox instead of the feed cuts cost per demo lead by 57% in the same account.
So: the demo ask belongs in a conversation ad.
A demo form completes 42% of the time in the inbox and 3.9% of the time in the feed.
So: the inbox costs 5x more per thousand and converts 11x more often; net, a lead at 43 cents on the dollar.
Inside one account, the best demo campaign is in the inbox and the worst is in the feed in 14 of 15 cases where they differ.
So: placement is the one set-up choice that survives every test in the study.
"Request a demo" costs $566 a lead at the median account; "book a call" $342. The gap is in the inbox ($431 vs $327); in the feed there is none ($695 vs $684).
So: in the inbox, test asking for a call; in the feed, change the placement, not the words.
Cold audiences produce demo leads at $210. Retargeting produces them at $467. The reason is not the audience, it is the pool: the median retargeting pool is 4,600 people.
So: retargeting is not worse per lead; it runs out.
Once a feed demo campaign has shown its ads more than four times per person in the audience, cost per lead is 2.2x where it started. On an uploaded list, 3.2x.
So: rotate the pool, not the creative.
In the feed, a cold demo audience of 250,000+ gets a lead for $76 to $87. Under 30,000, $232.
So: feed demo campaigns want broad audiences.
In the inbox it flips: a cold audience under 10,000 gets a demo lead for $173; over 170,000, $635.
So: inbox demo campaigns want tight audiences, under 40,000.
Doubling demo budget in the same set-up costs 17 to 20% more per lead. Volume comes from adding pools, not from adding spend to one.
So: diminishing returns are real but not a wall.
Letting LinkedIn's max delivery set the bid costs double. Manual CPM in the inbox is 50% cheaper per demo lead in the same account; enhanced conversion in the feed is 38% cheaper than max delivery.
So: set the price yourself in the inbox; bid for leads in the feed. Corrects v1.0's "no enhanced conversions".
The accounts that win on demo leads run 86% of their demo spend in the inbox. The accounts that lose run 23%.
So: the winners' set-up is a conversation ad on a 5-40k audience at manual CPM.
Winners and losers pay the same per send in the inbox ($0.60 vs $0.64) and get the same open rate (43% vs 40%). Winners get 2.24 leads per thousand sends; losers get 0.60.
So: the whole difference is offer and audience fit after the open.
In the feed, form completion explains 51% of the difference in demo cost per lead between accounts. In the inbox, completion explains 10%: cost per send and who opens the form explain the rest.
So: feed is a friction problem; inbox is a targeting problem.
A thought leader ad carrying a demo form is 32% cheaper per lead than a company post in the same account. A document ad, 80% cheaper.
So: if it must be feed, put the form on a document or a thought leader ad.
A Director-and-above seniority floor does not make demo leads dearer: Director+ only is the cheapest seniority set at $284, against $402 with no seniority targeting.
So: target senior for demo asks.
A demo lead targeting the US costs $520 at the median account; the UK $364; DACH $112.
So: benchmark by region before you judge the number.
A demo lead targeting hospitals and health care costs $829; targeting construction or banking, $215.
So: the industry you sell into sets the floor.
A demo lead from a technical buyer costs about twice a commercial one: Product Management $700, Engineering $532, against Sales $304 and Business Development $262.
So: benchmark by function before you judge the number; the inbox share is the same across them.
Running demand generation alongside demo capture does not make the demo lead cheaper (+9%, not significant). It raises how many demo leads the warm pool can yield.
So: demand gen buys volume, not price.
Thirteen demo-request myths, with the verdict
| Myth | Verdict | What the data says |
|---|---|---|
| A good demo CPL on LinkedIn is about $300 | Meaningless | Median $350, but p25 $161 and p75 $754. The tier you are in matters more than the average. Ch. 00. |
| Expensive demo leads mean the budget is too small | Killed | Winners and losers spend the same ($2,168 vs $2,058 a month). Set-up, not budget. Ch. 00. |
| Conversation ads are too expensive for lead gen | Killed | 5x the cost per thousand, 11x the completion: −57% per demo lead in the same account. Ch. 01. |
| Retargeting is the cheap demo audience | Half right | Cheaper per lead inside one account (−10 to −20%, ns), but the pool is 4,600 people and drains. Accounts that depend on it pay $467. Ch. 03. |
| Uploaded lists are the best demo audience | Killed on price | $548 at the account level, +27% vs cold in the inbox (ns), and they saturate hardest (323 past four passes). They buy volume, not price. Ch. 03. |
| Keep audiences tight for demo campaigns | Half right | True in the inbox (under 10k: $173; 170k+: $635). False in the feed (250k+: $76–87; under 30k: $232). Ch. 04. |
| Fresh creative fixes rising CPL | Killed | CPL rises with cumulative frequency, not time: 222 past four passes. Rotate the pool. Ch. 03. |
| Let LinkedIn optimise for leads | Half right (corrected) | v1.0 said killed; that was inbox vs feed in disguise. Inside one placement: manual CPM beats max delivery by 50% in the inbox ✱, and enhanced conversion beats max delivery by 38% in the feed ✱. Bid for leads in the feed; set the price yourself in the inbox. Ch. 05. |
| The copy is what converts | Not in this data | 13 copy features, all significant across accounts, none within. Copy marks the advertiser; it is not the lever. Ch. 07. |
| Fewer form fields, cheaper leads | Not in this data | Nothing on question count, phone, calendar or incentive is significant on demo CPL. Completion is placement. Ch. 07. |
| Senior targeting makes demo leads dearer | Killed | Director+ only is the cheapest seniority set, $284 vs $402 with none; a Director+ floor −36% ✱ cross-account, +17% ns within. Target up. Ch. 05. |
| Enterprise company bands are the expensive demo | Killed | Flat $328–352 from 201–500 up to 10,001+ employees. Only sub-200 bands are cheaper ($217–267); no size targeting at all is the dearest, $439. Ch. 05. |
| Demand gen makes demo leads cheaper | Reframed | +9% ns within account. It raises the ceiling on how many the warm pool can yield (volume ρ +0.23 ✱), not the price. Ch. 07. |
Terms used in this report
| Demo lead | A LinkedIn lead gen form submission (oneClickLeads) where the form asks for a demo, a call or meeting, an audit or assessment, a quote, or a free trial. Form opens are not leads. |
| Inbox / feed | Inbox: conversation ads and message ads (one send per person per 30–45 days, priced per send). Feed: single image, document, video, carousel and thought leader ads carrying the form, priced per impression. |
| Cost per thousand | CPM for feed placements; cost per 1,000 sends for inbox placements. Used interchangeably in the decomposition. |
| Form open rate | Form opens ÷ impressions (feed) or ÷ sends (inbox). The intent signal. |
| Completion | Leads ÷ form opens. The friction signal. |
| Main audience | The audience type (cold, uploaded list, retargeting) carrying the largest share of an account's demo spend. |
| Pool | The LinkedIn-estimated audience size of a campaign. Cumulative frequency = lifetime impressions ÷ pool. |
| Paired | The same advertiser account running both settings; the median of each account's own ratio, with a 95% bootstrap interval. |
| Fixed effects | A campaign-level model that compares campaigns only to other campaigns in the same account, removing everything that differs between accounts. |
| Tier A / D | Accounts below median CPL and above median volume (A, "winners"); above median CPL and below median volume (D, "losers"). Split at $350 and 6.6 leads a month. |
| ★ / ✱ / ns | ★ 5+ paired accounts, ★★ 25+, ★★★ 100+. ✱ the 95% interval excludes zero. ns: it does not. |
How it was built, how robust it is, what it cannot answer, how to cite
Method
Data. Kiin Intelligence, LinkedIn Marketing API, every lead-generation-objective campaign with delivery across connected accounts, 8 Sep 2025 to 7 Sep 2026, campaign-daily grain, 14 currencies normalised to USD. Forms classified as demo by the Report No. 3 keyword rule on the form's own headline, description, CTA and thank-you text (English plus six languages); content, mixed and unclear forms excluded; 14% of lead gen spend is unclear and 7% has no form synced. LinkedIn Audience Network off. Campaigns ≥ $100. Real leads only (oneClickLeads). 1,644 campaigns, 268 accounts, $8,254,662, 20,277 demo leads. Snapshot taken 21 Sep 2026.
Benchmarks are medians across advertiser accounts; no cell with fewer than seven accounts is shown; pooled figures are labelled pooled. Paired comparisons take the same account running both settings, compute the ratio per account, and report the median ratio with a 95% bootstrap interval (2,000 samples) and the share of accounts where the first setting was cheaper. Fixed-effects models are OLS on log CPL at campaign level with account dummies (661 campaigns with 3+ leads in accounts with 2+ such campaigns, within-R² 0.69). Variance decomposition splits between-account variance of log CPL into log CPM, log form-open rate and log completion. Saturation is per campaign, month buckets by cumulative impressions ÷ audience, indexed to the campaign's own first bucket.
Robustness. The headline paired results were re-run at five thresholds (from 1 lead and $100 per side to 10 leads and $500). Inbox vs feed: −57% at four of five, −36% at the strictest, n = 21-48, inbox cheaper in 18-40. Inbox retargeting vs cold: −9% to −20% at every threshold, significant only at ≥3 leads. Lists vs cold in the inbox: +25% to +35% at every threshold, never significant. The best-vs-worst chapter was re-run as second-best vs second-worst (55 accounts): placement survives (11 vs 0), audience type does not.
Revision 1.1, 22 September 2026. Two chapter 05 findings were withdrawn and replaced. (1) The bid comparison: every inbox campaign bids manual CPM or max delivery and every feed campaign bids enhanced conversion, max delivery or manual CPC, so the cross-account "enhanced $515 vs manual $342" and the paired "max delivery vs manual +189% (n=7)" were inbox versus feed. Re-run inside one placement and paired: inbox manual CPM vs max delivery −50% [−82, −6] n=17; feed enhanced conversion vs max delivery −38% [−65, −24] n=11. (2) The ask type: re-classified headline-first; demo ($566, 112 accounts) and call ($342, 39) hold, audit and free trial fall under seven accounts. (3) The targeted-industry chart had included Audience Network delivery and counted all accounts rather than those with 3+ leads; corrected and extended to 16 industries. Five targeting cuts added (function, seniority set, company size, region, audience type and format by placement). Chapter 05 §5 and §6 carry the full table behind every cell.
Reconciliation with Report No. 2. Report No. 2 found retargeting vs cold −18% [−38%, +9%] on all conversation-ad lead types (frozen snapshot). This study finds −11% to −20% on demo asks specifically. Same direction, different scope; the site cites each for its own scope and never averages them.
No account, campaign, form, creative or person is identifiable in any table.
What we cannot answer
Whether a $146 demo lead and a $926 demo lead are the same quality. Nothing after the form submit is in the data. Lead quality, meetings held, pipeline and influenced revenue need a CRM join. The next chapter.
What the inbox message says. Conversation and message ad copy, sender and bid amounts are not synced. Placement is proven; the message is not.
What the advertiser sells. Seller industry is empty on every account; targeted industry is the only proxy.
Who actually converted. LinkedIn's demographic reporting carries lead counts on only ~17 feed demo campaigns; it is in the appendix as illustrative, not as a finding.
Seasonality. The account mix changes too much across the year (9 accounts in Sep 2025, 153 in Jun 2026) to read the monthly CPL series as a calendar effect.
Whether demand gen pays back. It does not lower demo CPL at this n; whether it pays back through pipeline is the CRM chapter.
LinkedIn vs Google or Meta. LinkedIn-only panel.
Related reports in the series: Thought Leader Ads (No. 1), Conversation Ads (No. 2), Lead Gen Forms (No. 3). Same panel, same method, same rules. The whole-panel cut is on the benchmarks page.
Ilic, P. (2026). The Cost of a Demo on LinkedIn: 2026 benchmarks. Kiin Labs. kiin.co/research/linkedin-demo-request-benchmarks. Figures are medians across advertiser accounts and paired within-account comparisons, USD, 8 Sep 2025 to 7 Sep 2026, demo-request forms only. Free to cite with a link.
Frequently asked questions about demo requests on LinkedIn
The questions people ask, answered with a number, the n and the method.
How much does a demo request cost on LinkedIn?
$350 at the median advertiser account, across 155 accounts with five or more demo leads in the 12 months to September 2026. The useful answer is the range: a quarter of accounts pay under $161 and a quarter pay over $754. The pooled figure (all spend ÷ all leads) is $407 and is dominated by the largest advertisers.
What is a good cost per demo on LinkedIn?
Under $161 puts you in the top quarter of accounts; under $71 in the top tenth. The accounts that get there run 86% of demo spend in the inbox, half of it to cold audiences of 30,000 to 50,000, and get 17.6 demo leads a month on $2,168.
How many demo leads a month should a LinkedIn campaign produce?
6.6 at the median account on $2,142 a month; 17 at the 75th percentile; 44 at the 90th. Volume comes from the number and size of pools, not from budget: doubling spend in one set-up costs 17 to 20% more per lead.
Are conversation ads or feed ads better for demo requests?
Conversation ads, by 57% per lead in the same account (23 accounts running both, inbox cheaper in 20). The inbox costs five times more per thousand but the form completes 42% of the time against 3.9% in the feed. If the form has to be in the feed, put it on a document ad (−80%) or a thought leader ad (−32%), not a single image.
Is retargeting cheaper than cold for demo leads?
Per lead inside one account, slightly: −10% to −20%, not significant. At the account level, accounts that depend on retargeting pay $467 against $210 for cold, because the median retargeting pool is 4,600 people and gets shown ads 4 to 16 times over; past four passes cost per lead is 2.2x where it started. Use retargeting, and rotate the pool.
How big should the audience be for a LinkedIn demo campaign?
It depends on the placement. Feed: 100,000 or more; 250,000+ audiences get a demo lead for $76 to $87, under 30,000 for $232. Inbox: under 40,000; under 10,000 gets a lead for $173, over 170,000 for $635. Inbox retargeting on pools under 2,300 people is the cheapest demo lead in the study at $150 to $214.
Does "request a demo" or "book a call" convert better on LinkedIn?
Book a call: $342 a lead at the median account against $566 for a demo request (39 / 112 accounts, strict headline-first classifier). The gap is in the inbox ($327 vs $431); in the feed there is none ($684 vs $695). Cross-account and the sign flips within account on eight advertisers, so treat it as a hint to test, not a rule. The audit ($260) and free-trial ($362) prices in the first version of this report were classifier leakage and are withdrawn.
Should I use enhanced conversions on LinkedIn lead gen?
In the feed, yes: paired within account, enhanced conversion beats max delivery by 38% per demo lead [−65%, −24%], cheaper in 10 of 11 accounts. In the inbox, bid manual CPM: it beats max delivery by 50% [−82%, −6%], cheaper in 14 of 17. The first version of this report said "no enhanced conversions"; that compared inbox campaigns (all manual CPM) with feed campaigns (all enhanced or max delivery) and was placement in disguise. The rule is: never let max delivery set the price.
Does running brand awareness or engagement campaigns make demo leads cheaper?
Not in this data. Within account, demo CPL in the months after demand-gen spend is +9% [−7%, +65%], cheaper in 11 of 29 accounts. Demand-gen spend correlates with how many demo leads the retargeting pool yields (ρ +0.23), not with what they cost. It raises the ceiling; it does not lower the price.
Does senior targeting make demo leads more expensive?
No. Director-and-above only is the cheapest seniority set, $284 at the median account against $402 with no seniority targeting and $427 for Manager-and-above; the cross-account model puts a Director+ floor at −36%; within account the difference is +17%, not significant. The senior filter costs nothing in CPM (+13%, ns).
Which job functions are the most expensive to get a demo from on LinkedIn?
Product Management ($700 a demo lead at the median account), Engineering ($532), Operations ($492), Finance ($486) and IT ($471). The cheapest: Business Development ($262), Sales ($304) and Marketing ($312). Roughly, the technical buyer costs twice the commercial one; placement does not explain it, since the inbox share is similar across functions. Cross-account benchmark on 9 to 35 accounts per function.
Does targeting bigger companies make demo leads more expensive?
No. Every company-size band from 201-500 up to 10,001+ employees sits within $328-352 a demo lead. Only the small-company bands are cheaper ($217-267), and campaigns with no size targeting at all pay the most, $439. 45 to 149 accounts per band.
What does a demo lead cost in the US vs the UK?
Campaigns targeting the US: $520 at the median account (62 accounts); US and Canada $489 (41); the UK $364 (23); Europe multi-country $362 (11); DACH $112 (7); MENA $65 (8). The cross-account model puts the US premium at 48%. By targeted industry: construction $215, banking $216, financial services $283, manufacturing $308, software development $611, hospitals and health care $829.
How is this different from the lead gen forms report?
Report No. 3 covers every lead gen form, content and demo side by side, across 489 advertisers. This report takes only the demo-request half (268 advertisers, $8.25M), goes deeper on placement, pool size and saturation, and adds the within-account best-vs-worst and demand-gen tests. Where they overlap the numbers agree; where they differ in scope, cite each for its own.
Which tier is your account in? Kiin runs LinkedIn Ads for sales-led B2B companies and benchmarks every account against the 1,000+ connected to Kiin Intelligence: demo CPL, pool sizes, placement split and cumulative frequency, on every table in this report. The demand-capture layer, the warm pool it needs, and the report on what it costs.