
LinkedIn counts a click as any chargeable click, including clicks to the company page, and a landing page click as one "which take[s] the user to the creative landing page" (LinkedIn Marketing API reporting schema (Microsoft Learn)); every Kiin Labs click figure uses the second. For context on why most of a market will not respond to any ad this quarter: LinkedIn's B2B Institute estimates 95% of potential buyers are not ready to buy today (The 95-5 Rule, LinkedIn B2B Institute).
One of the largest thought leader ads datasets outside LinkedIn. Audience Network excluded throughout.
Ilic, P. (2026). LinkedIn Thought Leader Ads Benchmarks 2026. Kiin Labs. kiin.co/research/linkedin-thought-leader-ads-benchmarks. Figures are medians of paired within-account comparisons, USD, 8 Sep 2025 to 7 Sep 2026, LinkedIn Audience Network excluded.
This study comes from Kiin Intelligence, the analytics layer behind Kiin, a London LinkedIn Ads agency with three ex-LinkedIn Marketing Solutions staff and 200+ B2B accounts under management.
See where your account sits. We'll benchmark it against the 1,000+ accounts connected to Kiin Intelligence, every table in this report, with your numbers in it.Free. Read-only access. Takes us about an hour; we audit accounts every week.
What we did, and what surprised us
We took 365 days of LinkedIn spend from Kiin Intelligence: $31M across 464 accounts running thought leader ads and 447 running sponsored content, 411 of them running both. Audience Network is excluded throughout.
Then we did the thing most benchmark reports skip. Most benchmark studies compare Company A using setting X with Company B using setting Y. We don't. Wherever possible we compare the same advertiser using both. Every comparison is paired within account: the same advertiser running both objectives, both bid types, both audience types, in the same window. Fatigue is measured per creative against its own launch. Seasonality is indexed to each account's own typical month. Every paired ratio carries a 95% bootstrap confidence interval, and every stat in this report is starred by how well it survived.
Pairing costs headlines. Several findings that look strong across different accounts vanish inside the same one. Only what survived is in here.
What confirmed what we thought. Fatigue is frequency, not time. Video is the wrong format for a thought leader ad. Executives engage more. Weekends are cheap.
What surprised us. Brand awareness is not cheaper or more expensive than engagement. It buys a different thing, and whether that thing is worth having depends almost entirely on audience size. Your frequency is a third of the real number. Higher bids bought worse inventory. Top authors get 8.6× the engagement of bottom authors, and no hook, length or link decision survives holding the author constant. The lowest median landing page click in the data is not a thought leader ad. And 55% of the variance in what a click costs is CPM, not creative, you can't creative your way out of a bad CPM.
How to read this report
| ★★★ | paired within account, significant, n over 100 |
| ★★ | paired within account, significant, n 25 to 100 |
| ★ | directional: cross-account or small n. "ns" next to a number = not statistically significant |
| LP | landing page. LP CPC = cost per landing page click, LP CTR = landing page click rate. "Cost per click" alone = total cost per click as Campaign Manager reports it |
| ENG | engagement = every reaction, comment, share, follow and click (including "see more" and profile visits). Engagement rate = engagements ÷ impressions. A landing page click is the subset that reaches your site |
| TLA | thought leader ad: a company-sponsored post from a person's profile. Sponsored content: a post from the company page. Cold = attribute targeting, no list. Retargeting = site visitors and ad engagers. Dwell = seconds on screen |
Who is in the data
2,563 thought leader ad campaigns, 464 accounts, $8.4M, Audience Network excluded. B2B tech advertisers, US first and Europe second, aimed at Director to C-suite at mid-market companies. Mostly US-billed, targeting decision makers in marketing, revenue, operations and IT. Three quarters do it by title list or uploaded account list rather than seniority or function filters, on audiences of about 20,000 people, at $4 to 5k a year.
| Dimension | Share |
|---|---|
| Geography · share of spend | US only 37% · Global/multi-region 22% · Europe ex-UK 10% · North America + Europe 9% · US + Canada 8% · UK only 5%. 68% of spend touches the US, 23% the UK, 20% continental Europe. |
| Billing currency | USD 225 accounts (73% of spend) · EUR 140 (13%) · GBP 38 (8%) · Other 61 (6%). Median account $4,345 a year. Accounts over $100k a year are 45% of spend. |
| Seniority · where set (21% of spend) | Director / VP / CXO 20% each · Manager 15% · Owner / Partner 13% each · Senior IC 6%. 79% of spend sets no seniority filter. 53% of campaigns target by job title instead, median 28 titles. |
| Job function · where set (24% of spend) | Marketing 13% · Business development 12% · Operations 11% · IT 8% · Engineering 7% · Product / Sales / Finance 6% each. Industry filter on 30% of spend: Technology and Internet 17%, Software 6%, Financial Services 5%, Telecoms 5%. |
| Audience type | Cold 33% (n=913) · Uploaded list 49% (1,213) · Retargeting 19% (437). Median audience 21,000. Under 10k 21% of spend, 10 to 30k 25%, 30 to 100k 27%, 100k+ 25%. |
| Setup | Engagement / BA 60% / 34% · Single image / video 76% / 23% · CPM / CPC bid 51% / 46% · Manual / max reach 44% / 28%. A campaign counts under every value it targets, so facet shares can exceed 100%. |
The six numbers to take away
Medians across B2B tech advertisers, paired within account, Audience Network excluded. Each links to the chapter it rests on.
How Kiin runs thought leader ads now
The findings are what the data says. These are the nine decisions we took from it, the operating rules on every account we run. Each links to the chapter it rests on.
Objective
Brand awareness on cold audiences of 30,000 or more, single image, CPM bid. Engagement on retargeting pools, uploaded lists, anything under 10,000, video, and any campaign we need acted on. We never split a small audience across both objectives, there is nothing for the second one to add.
The evidence →Frequency
We read every frequency cap, fatigue alert and creative-refresh decision against the account-level deduplicated number, not the campaign number, and we expect it to be two to three times the campaign figure once more than a handful of campaigns are live.
The evidence →Fatigue
Alerts on engagement rate and landing page click rate against cumulative frequency, never on cost per click, never on days live. Refresh cadence comes from audience size: under 10,000 a new creative every two weeks, over 100,000 monthly. What those audience sizes cost to buy in the first place is in Report No. 7: LinkedIn audience targeting. We hold monthly frequency at 1.5 to 2× and treat 4× on a small audience as a budget problem, not a creative one.
The evidence →Bidding
Bid low, the bid-amount result is the one that moved. We bid CPM because LinkedIn bills engagement on CPC, not because CPM is cheaper; bid type makes no difference. Audience Network off.
The evidence →Cost — the checklist
First thing on any account we take over, in this order: widen the audience past 30,000 · budget pressure under $2 a day per 1,000 members · at least half the spend on cold targeting · bid capped at $3. Creative comes after. We size budget to the audience: if a campaign needs more spend, we widen the audience before we raise the daily budget.
The evidence →Creative
We stop A/B testing the container. Single image, the author's own voice, a link if the post needs one. The two variables that move results are who is posting and how often the same person has seen it, so we pick the person before we worry about the post. If the post is a video and the view is the goal: video views objective, "maximise video views" bidding, cold audience over 100,000, judged on completions.
The evidence →Targeting
Always a seniority filter, usually Director and above, and one or two job functions, it costs nothing extra to reach the C-suite, and no-filter campaigns pay the most per click. An uploaded list is a cold audience with a higher CPM, not retargeting. We report reach as a share of the target audience: 20% in 90 days is normal, 40% is the top quarter.
The evidence →Calendar
Weekends stay on, they are the cheapest, highest-clicking 18% of delivery. Annual budgets front-loaded into Q1. December stays on.
The evidence →Measurement
Thought leader ads are reported on engagement rate, cost per engagement and cost per landing page click, never on total CTR or CPC. Total CTR is engagement rate with a different name; total CPC makes a TLA look 80% cheaper than it is.
The evidence →
Which objective should thought leader ads use — engagement or brand awareness?
Neither is cheaper per landing page click. Brand awareness buys reach on big cold audiences. Engagement buys everything else.
Brand awareness reaches 77% more people per dollar. Engagement gets 88% more engagement. The landing page click costs the same: $17.24 vs $17.22.
The headline: brand awareness reaches 77% more people per dollar, engagement gets 88% more engagement, and the landing page click costs the same ★★
$17.24 vs $17.22. Paired within 36 accounts, brand awareness cheaper in 20 of them. A tie in every split we tested.
| Metric | Brand awareness vs engagement, paired within account | Winner |
|---|---|---|
| Cost per landing page click | $17.24 vs $17.22 · BA −6% [−30%, +39%] · n=36 | Tie |
| Cost per engagement | BA +36% [−2%, +87%] · n=59. Tied overall; the audience-size split below resolves it | Tie |
| People reached per dollar | +77% [+45%, +96%] · n=59 | Brand awareness |
| CPM | −39% [−52%, −30%] · n=59 | Brand awareness |
| Engagement per impression | +88% (BA −47% [−64%, −39%]) · n=59 | Engagement |
| Landing page click rate | +82% [+22%, +117%] (BA −45% [−54%, −18%]) · n=35 | Engagement |
| Tracked conversions per dollar | BA −19% ns (leans engagement); −50% with a seniority filter · n=66 | Tie |
| Daily frequency | 1.10 vs 1.16 · n=59 | Tie |
Engagement gets 82% more landing page clicks per impression; brand awareness pays 39% less per impression. The two cancel. A tie in every split we tested: audience size, cold vs list, format, region, budget (every interval spans zero). The one exception: against engagement campaigns bid on CPM (n=16), brand awareness landing page clicks are 21% cheaper. Retargeting could not be tested; almost nobody runs brand awareness on a retargeting pool with a link.
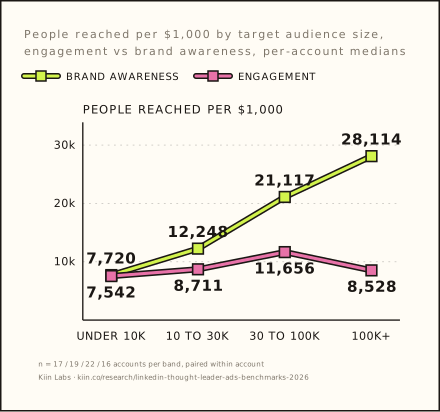
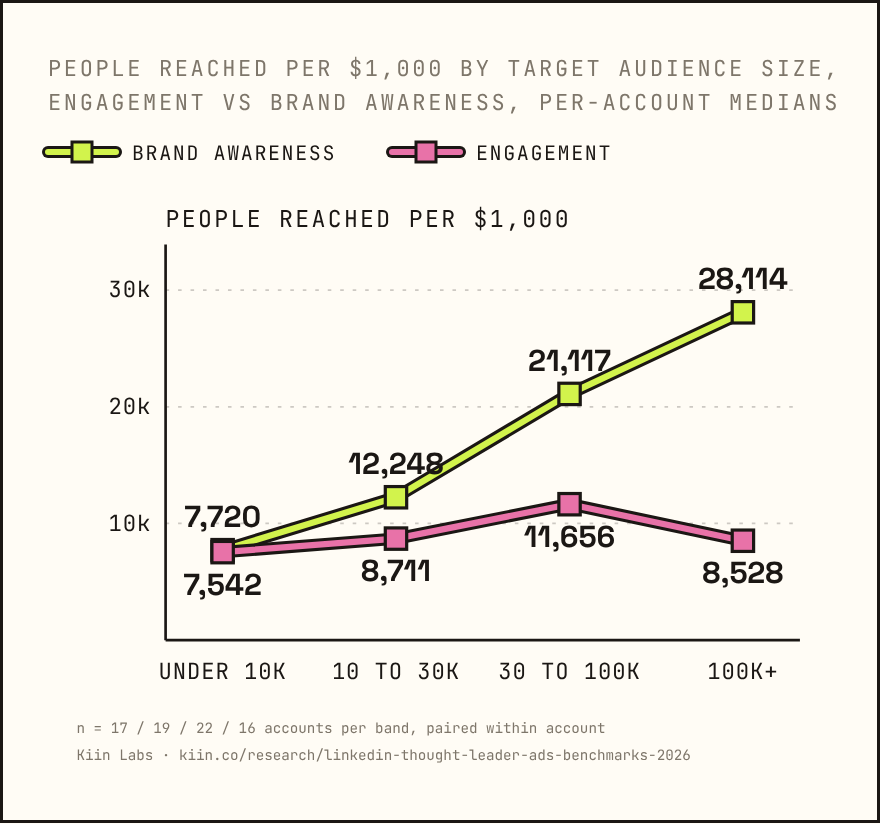
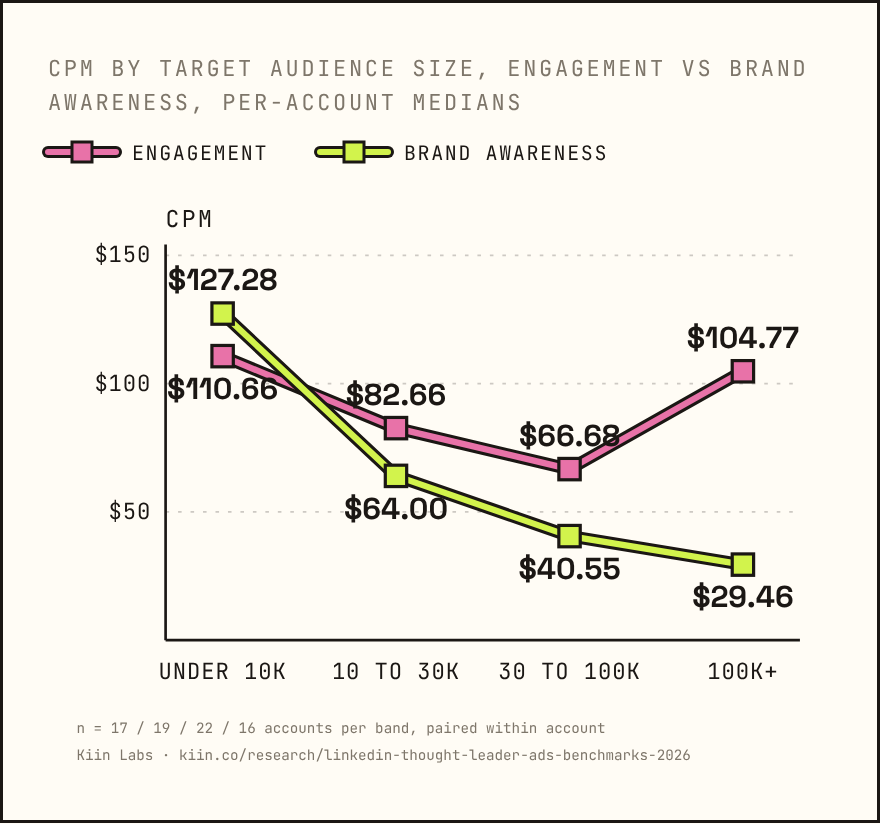
The lookup: under 10,000 people, brand awareness costs $4.75 per engagement vs $1.79. Over 100,000, it costs $1.06 vs $1.89 ★★
Under 10,000 people there is no one extra to reach, so brand awareness, the cheaper-impression objective, just pays more per engagement. Overall, brand awareness reaches 77% more people per dollar. That average hides the split: over 100,000 people it reaches 3.8× as many (+276%, paired), under 10,000 only +1%.
| Audience | n | Reached per $1k · Eng | Reached per $1k · BA | CPM · Eng | CPM · BA | Cost/eng · Eng | Cost/eng · BA |
|---|---|---|---|---|---|---|---|
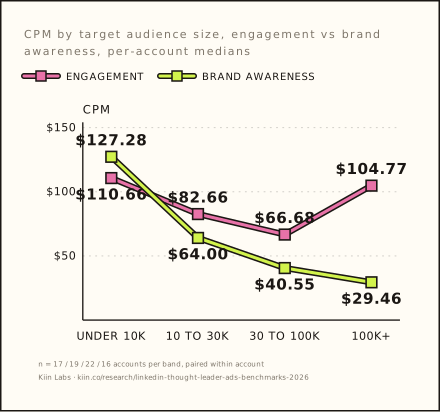
| Under 10k | 17 | 7,542 | 7,720 | $110.66 | $127.28 | $1.79 | $4.75 |
| 10k to 30k | 19 | 8,711 | 12,248 | $82.66 | $64.00 | $2.12 | $2.28 |
| 30k to 100k | 22 | 11,656 | 21,117 | $66.68 | $40.55 | $2.20 | $2.15 |
| 100k+ | 16 | 8,528 | 28,114 | $104.77 | $29.46 | $1.89 | $1.06 |
Per-account medians, accounts running both objectives. Reach per dollar paired: under 10k +1% · 10 to 30k +62% · 30 to 100k +120% · 100k+ +276%. CPM at 100k+: −74%.
The use cases: on a 30k+ cold audience, brand awareness reaches +184% more people at −59% CPM. On a retargeting pool it costs more per engagement
The rule. Brand awareness for big, cold, single-image audiences where you want to be seen. Engagement for retargeting, lists, small audiences, video, and anything you need acted on. Neither is cheaper per landing page click. They buy different outcomes.
Use brand awareness when
- The audience is big and cold — 30,000+ people you have not reached. Reach +184%, CPM −59%, cost per engagement level (+12%, ns). n=18
- The job is to be seen, not clicked. +77% more people per dollar; landing page click rate 45% lower but proportionally cheaper per impression, so the click costs the same.
- The creative is a single image post. Reach +74%, CPM −42%. Never on video: cost per engagement +99%, dwell −27%. n=53 / 17
- The audience is 10,000 to 30,000 — no universal winner. Reach +62%; cost per engagement $2.12 vs $2.28, ns. Pick by outcome. n=19
- You would bid CPM anyway. Against CPM-bid engagement: same click rate (+8%, ns), same cost per engagement (−4%), double the reach, landing page clicks 21% cheaper. n=16, directional
Use engagement when
- You are retargeting website visitors or ad engagers. On a retargeting pool, brand awareness costs more per engagement — use engagement.
- You are running an uploaded list. BA on a list: reach +72% but cost per engagement +49%. A small list (under 30k) is the worst case: conversions per dollar −77%. n=32 / 19
- The audience is under 10,000. BA reaches 1% more, CPM +13%, cost per engagement +49% ($4.75 vs $1.79). Nobody extra to reach. n=17
- You need comments, shares or clicks. +88% engagement per impression, +82% landing page clicks per impression, 3 to 4× the comments, 2 to 5× the organic amplification.
The decision, as two dimensions: audience size, then audience type — and type overrides size
"Above 30,000 → brand awareness" is only true for cold audiences. The full map, paired within account. The middle band is genuinely a judgement call, and the click never decides it: cost per landing page click is a tie at every size.
| Audience size (cold) | Reach per $ (BA ÷ eng) | Cost per engagement | Verdict |
|---|---|---|---|
| Under 10k | +1% — nothing to reach | BA +49% worse ★★ | Engagement — clear |
| 10k to 30k | +62% ★★ | $2.12 vs $2.28, ns | Depends on the goal — reach → BA, action → engagement. Neither is a mistake |
| 30k to 100k | +120% ★★ | $2.20 vs $2.15, ns | BA if the job is reach — cost per engagement is not worse |
| 100k+ | +276% ★★ | $1.06 vs $1.89 (medians, n=16) | BA — the reach is the solid part |
| Audience type — overrides size | What the data says | Verdict |
|---|---|---|
| Retargeting pool, any size | Brand awareness costs more per engagement — use engagement | Engagement |
| Uploaded list, under 30k | BA cost per engagement +49%, conversions per dollar −77% (n=32 / 19) | Engagement |
| Uploaded list, 30k+ | BA reach +144% but cost per engagement +51%, ns (n=13, directional ★) | Lean engagement |
| Cold, 30k+ | BA reach +184%, CPM −59%, cost per engagement +12% ns (n=18) | Brand awareness — the best case |
| Video, any audience | BA cost per engagement +99%, dwell −27% (n=17) | Engagement |
The rule, stated as tightly as the data allows. Engagement: under 10,000, or any uploaded list, or any retargeting pool, or video, or anything you need clicked, commented or converted. Brand awareness: cold audiences of 30,000 or more where the job is to be seen. 10,000 to 30,000 cold: pick by outcome, reach → brand awareness, action → engagement. A 40,000-person uploaded list is not a "big audience" for this purpose; it is a list, and it leans engagement.
What the extra reach is made of: 77% more reach with 65% to 78% fewer comments and 22% less dwell ★
Brand awareness does not reach more people by showing the ad fewer times. Daily frequency is identical, 1.10 vs 1.16. It reaches more because it buys cheaper impressions and spreads them slightly wider: 90.8% of its impressions are unique vs 85.9%.
| BA ÷ engagement, 66 accounts paired | |
|---|---|
| Daily frequency | −2% |
| Dwell | −22% |
| Comments per 100k impressions | −65% to −78% |
| Organic impressions earned from reactions, comments and shares | −42% to −81% |
| Share of clicks that don't reach the landing page | +0% |
Per impression, reach is the same: at equal impressions per member, penetration is identical up to 1×. At 2 to 4×, engagement reaches 90% of the audience, brand awareness 54%. The advantage is entirely the CPM.
Brand awareness above 30,000 cold, engagement below 10,000 and on every list. The objective is a purchasing decision, not a performance setting. Paired within account, neither is cheaper: the click costs the same and cost per engagement is tied. What changes is what a dollar buys. Brand awareness buys new people at a lower CPM. Engagement buys reactions, comments, clicks and conversions from the people it reaches. Pick the outcome first and the objective follows. The objective choice on its own is in engagement vs brand awareness; how it fits a whole account is on the LinkedIn Ads agency page.
Audience size is the whole decision. The cheaper impression only helps if it lands on someone new. On 100,000 people it does, so brand awareness reaches 3.8× more per dollar. On 10,000 it cannot, so the cheaper impression just repeats and the cost per engagement goes to $4.75.
Most of engagement's click edge is the bidding, not the objective. Against engagement campaigns that also bid CPM, brand awareness has the same click rate and the same cost per engagement, with double the reach. If you were going to bid CPM anyway, brand awareness on a big cold audience is close to free reach.
How we run it. Big cold audiences (30k+), single image, CPM bid: brand awareness. Retargeting pools, uploaded lists, anything under 10k, video, and any campaign we need acted on: engagement. We never split a small audience across both. Two caveats: the retargeting cell is 7 to 8 accounts, so directional; and 'conversions' means whatever each account tracks, so read those lines within account only.
What is the real frequency of a LinkedIn thought leader ad?
Every campaign reports its own frequency. Add them up at account level and 3.5 becomes 9.5.
Your campaign reports frequency 3.5. Your account's true frequency is 9.5.
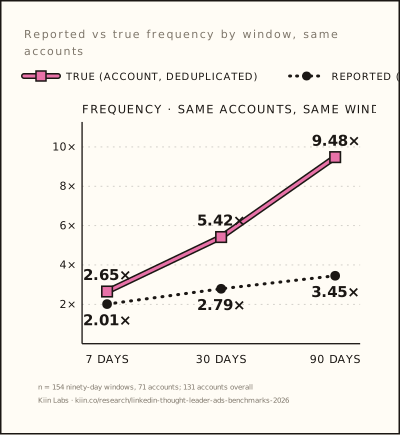
Your campaign reports frequency 3.5. Your account's true frequency is 9.5 ★★★
| Window | Overlap | Reported | True | Understated |
|---|---|---|---|---|
| 7 days | 18% | 2.01 | 2.65 | 1.4× |
| 30 days | 36% | 2.79 | 5.42 | 1.9× |
| 90 days | 47% | 3.45 | 9.48 | 2.7× |
| Campaigns live over 90 days | Overlap | Reported | True |
|---|---|---|---|
| 2 | 3% | 3.96 | 4.24 |
| 4 to 5 | 19% | 2.72 | 3.91 |
| 7 to 11 | 36% | 3.39 | 8.61 |
| 13+ | 55% | 3.48 | 10.60 |
n = 154 ninety-day windows, 71 accounts; 131 accounts overall. Understated 1.4× at 7 days, 1.9× at 30, 2.7× at 90.
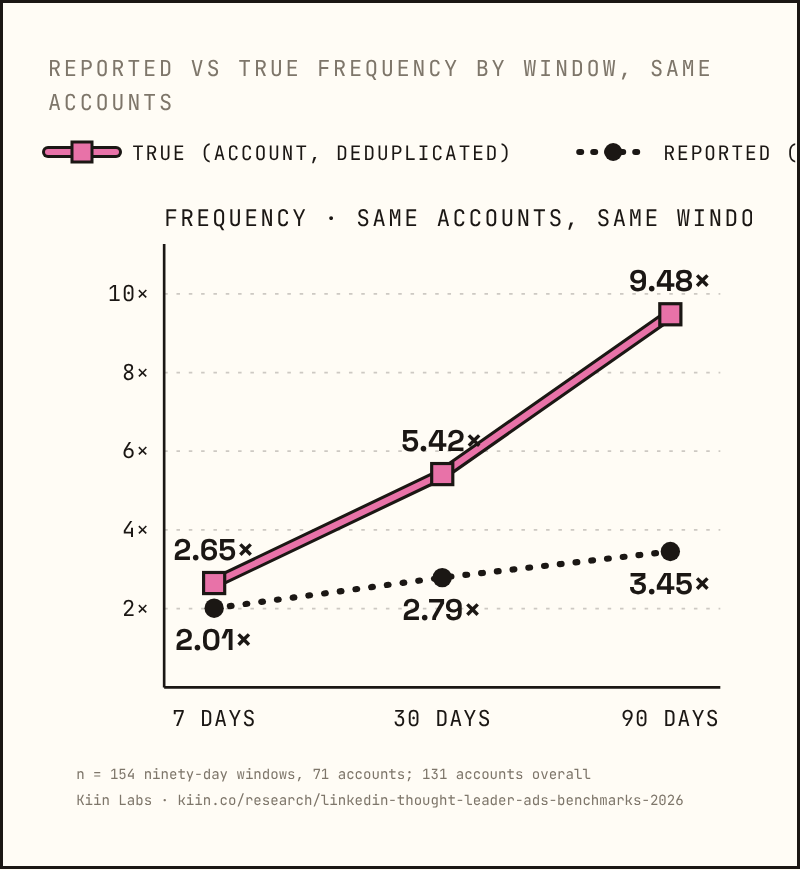
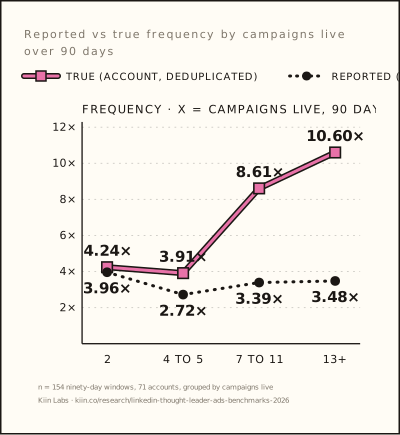
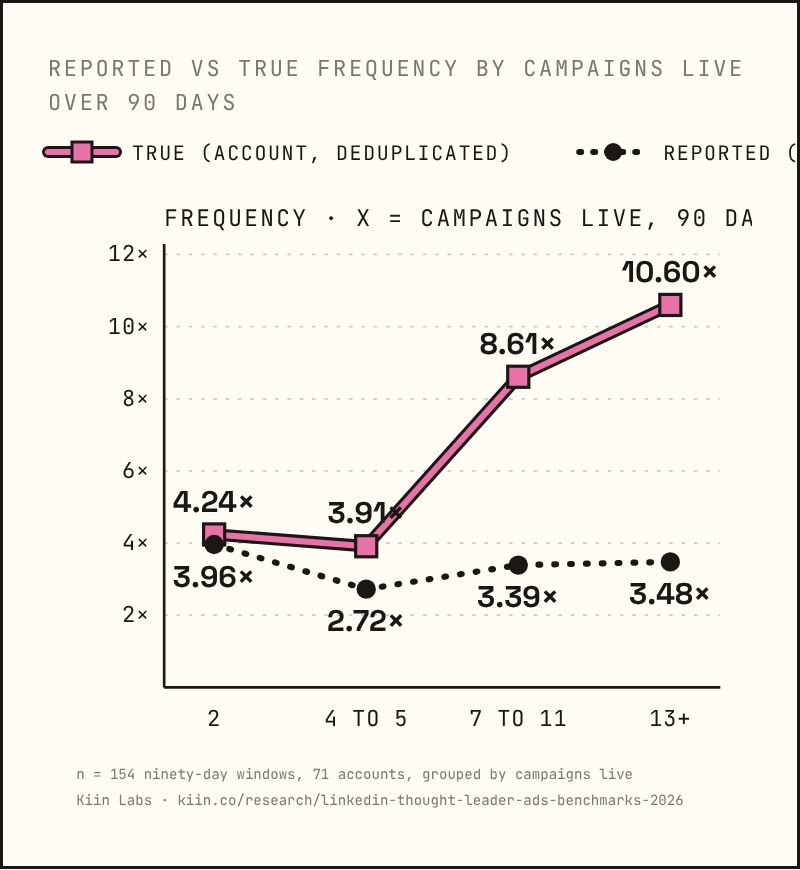
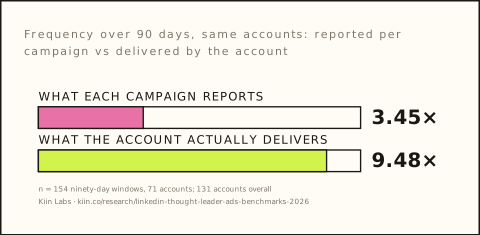
What this changes. An account running 13 or more campaigns over a quarter shows each person the brand 10.6 times while every campaign report says 3.5. A person who has seen one creative once has typically seen the brand two or three times. Whether account-level frequency explains fatigue better than campaign frequency is untestable at current data (21 accounts). The fatigue curves in the next chapter are measured per creative and are unaffected.
Campaign frequency is the number LinkedIn shows you. Account frequency is the number your audience experiences. We read every frequency cap, fatigue alert and creative-refresh decision against the deduplicated account figure, and we expect it to be two to three times the campaign figure once more than a handful of campaigns are live. The frequency and refresh rules we run are in LinkedIn ad frequency and fatigue.
When do thought leader ads fatigue — and is it time or frequency?
Engagement falls with frequency, not time. Cost per click is the last metric to notice.
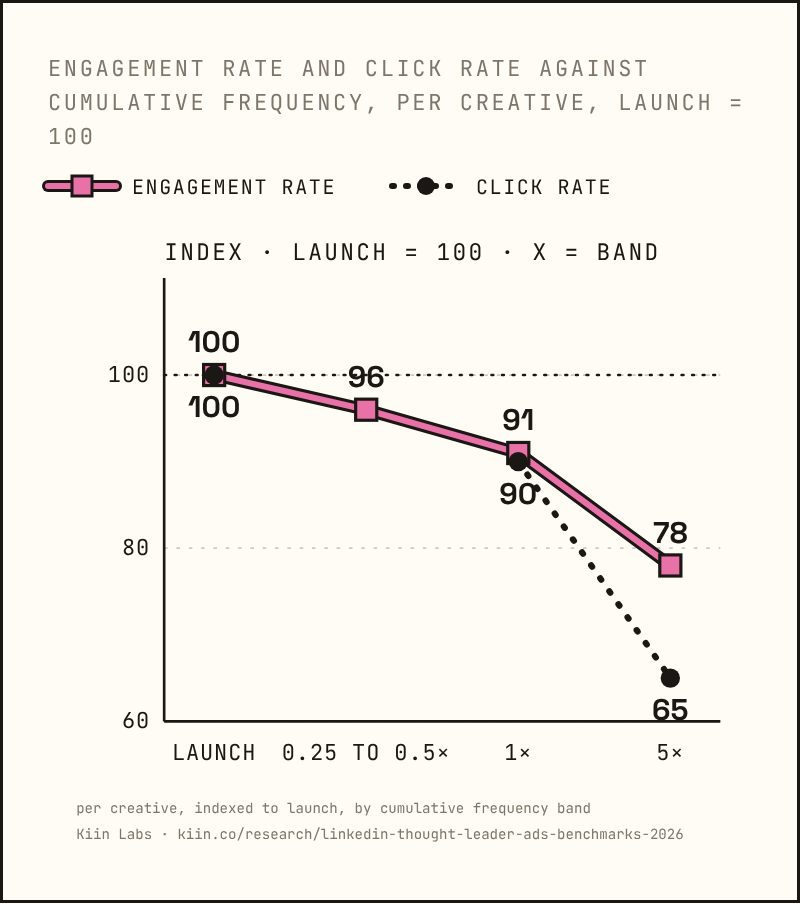
Time doesn't kill a thought leader ad. Frequency does: −9% engagement at one full pass, −22% at five.
Time doesn't kill a thought leader ad: cost per click, CPM and dwell flat over 8 weeks. Frequency does: −9% engagement at one pass, −22% at five ★★★
Cumulative frequency is impressions divided by audience. At 0.25 to 0.5×, the average person has seen the ad less than once, and engagement is already 4% below launch. By the time everyone has seen it once, it is down 9%.
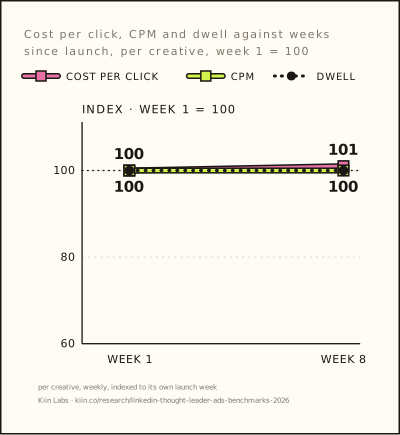
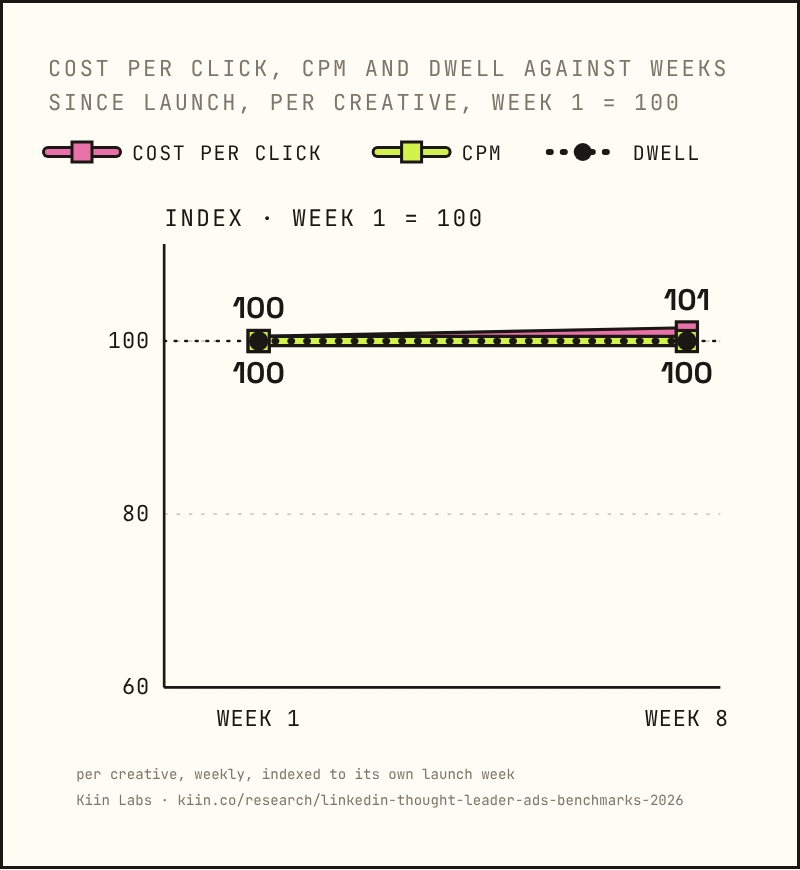
Cost per click won't warn you. Cost per click (total, as Campaign Manager reports it) shows no significant change until 3 to 5× frequency. CPM falls as a campaign matures (index 94 by half a pass) and cancels out the collapsing click rate. By the time the cost line moves, you are a month late.
What to watch instead. Engagement rate and landing page click rate, against cumulative frequency, not against the calendar. A creative that is 60 days old is not tired because it is old.
We set fatigue alerts on engagement rate and landing page click rate by cumulative frequency, never on cost per click and never on days live. The cost line moves a month after the problem starts.
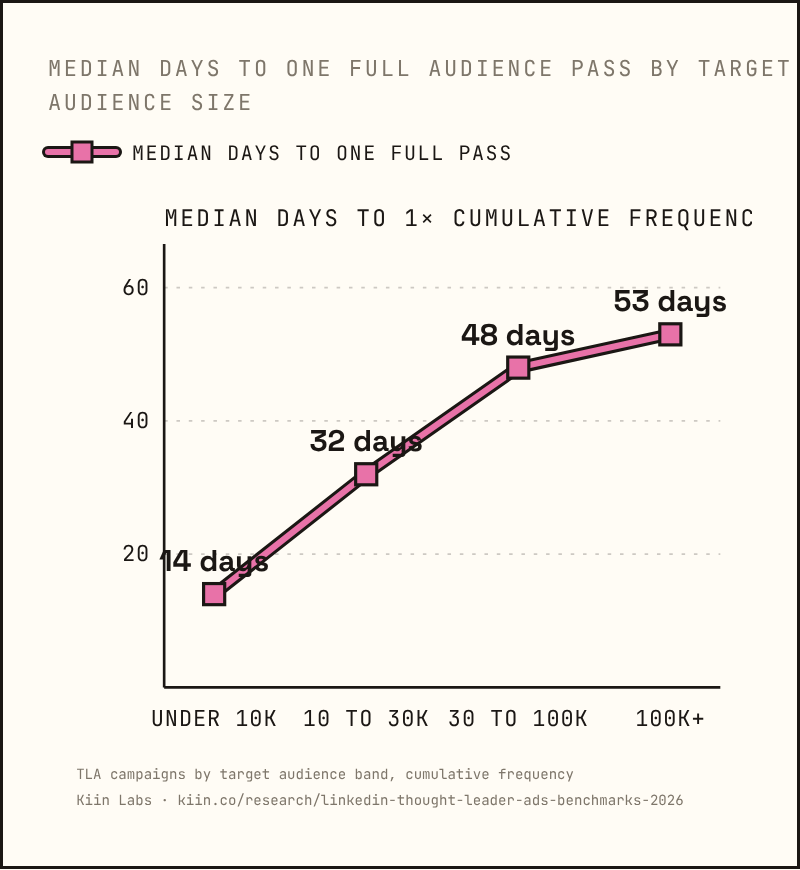
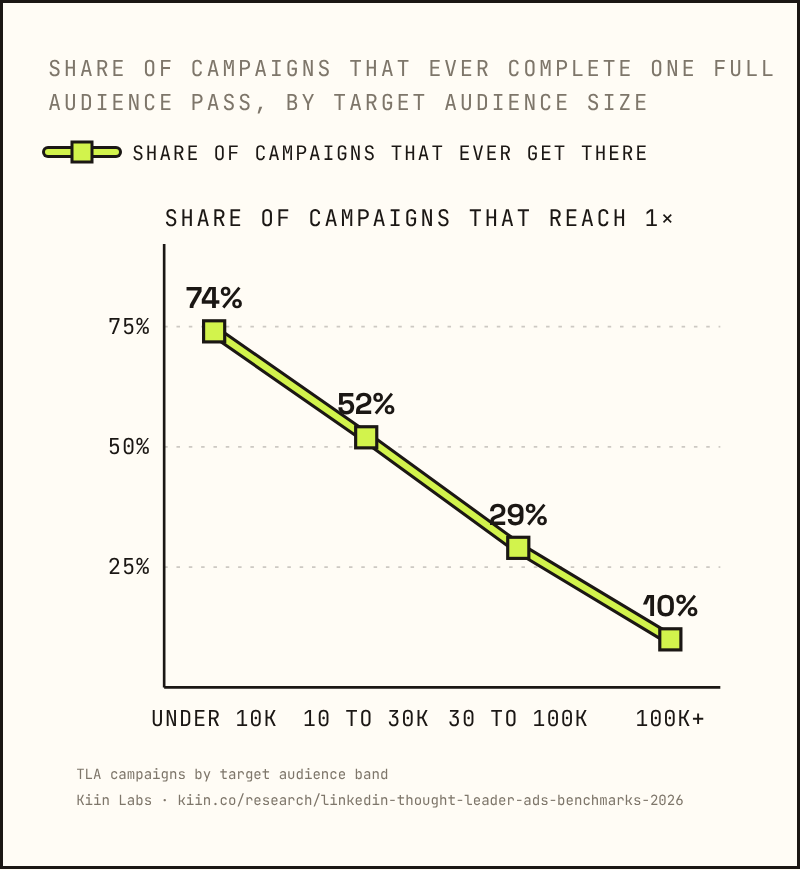
The refresh lookup: an audience under 10,000 burns a creative in 14 days. A 100,000-person one takes 53 ★★★
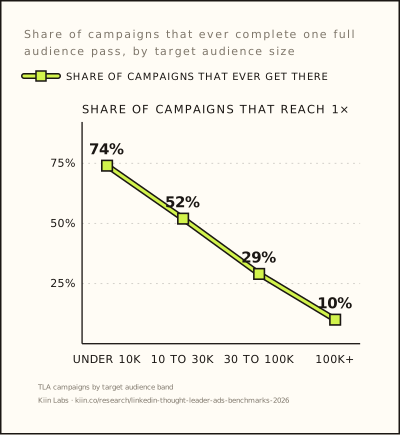
| Target audience | Median days to one full pass (1×) | Share of campaigns that ever get there |
|---|---|---|
| Under 10,000 | 14 | 74% |
| 10,000 to 30,000 | 32 | 52% |
| 30,000 to 100,000 | 48 | 29% |
| 100,000+ | 53 | 10% |
Swap the creative on audience size, not the calendar. One full pass is cumulative frequency 1×, as many impressions as there are people in the target audience, and it is the point where engagement is 9% below launch. On a small audience it arrives in two weeks. On a large one most campaigns never reach it at all.
Refreshing stops the bleed, it doesn't buy a better ad. A freshly added creative scores 91 on engagement against the creatives already running (they = 100) and beats them only 42% of the time (p = 0.002). But campaigns that keep adding creative hold engagement flat; those that don't lose 8% a month. ★★
Many small creatives or few big ones: no difference. Within account, more creatives live moves nothing: CPM +6%, engagement −4%, cost per LP click +10%, all spanning zero. Concentrating budget on fewer creatives costs +20% CPM [+3%, +26%], and that is the only effect. Fatigue is per creative, driven by frequency, not by what runs next to it. ★★
Refresh cadence comes from audience size, not the calendar. Under 10k people we plan a new creative every two weeks; over 100k, monthly is plenty. We keep monthly frequency at 1.5 to 2× and treat 4× on a small audience as a budget problem, not a creative one. A sub-10k list gets a new creative in the plan from day one, because the first one is spent inside a fortnight.
Should you bid CPC or CPM on thought leader ads, and does the bid amount matter?
Higher bids bought more expensive, lower-engagement inventory. Bid type does nothing. Engagement never lowers CPM.
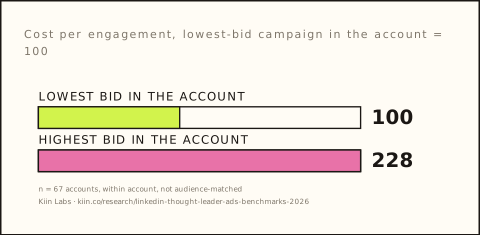
The highest-bid campaign paid +128% per engagement and got 32% less of it. Bid type does nothing.
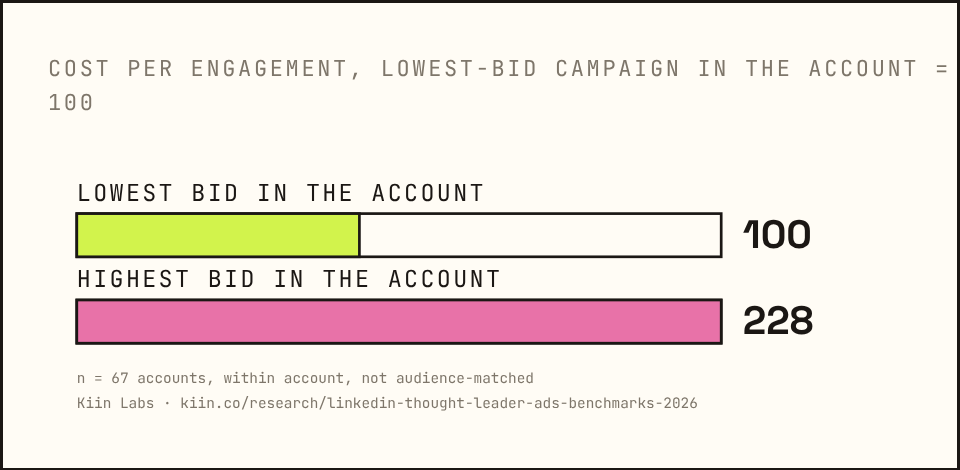
Within the same accounts, the highest-bid campaign paid +128% per engagement and got −32% engagement rate vs the lowest-bid campaign ★★
| Same account, highest-bid vs lowest-bid campaign · n=67 | High vs low bid | 95% CI |
|---|---|---|
| CPM | +59% | [+19%, +104%] |
| Cost per engagement | +128% | [+99%, +161%] |
| Engagement rate | −32% | [−39%, −14%] |
| Cost per LP click | +104% | [+40%, +154%] |
Within account, bid to cost per engagement r = +0.70, positive in 85% of 78 accounts. Bid to engagement rate r = −0.40. This comparison is within account, not matched on audience: the highest-bid campaign in an account may also be the one on the smallest list, and the study did not control for that here (it did for the bid-type test). Read it as: higher bids went with more expensive, lower-engagement inventory in the same accounts.
On CPM bidding, engagement has zero effect on CPM (r = −0.02). On CPC bidding, the most engaging creative costs +101% per 1,000 impressions ★★★
Within campaign, the most-engaging creative costs +66% per 1,000 impressions vs the least [+56%, +74%], cheaper in only 20% of 227 campaigns. Days at 2× a campaign's normal engagement are followed by a week at 109 CPM, not a cheaper one. What does fall is cost per engagement: −48% for the most-engaging vs least-engaging campaign in an account, cheaper in 74 of 85. Cheaper per reaction, never per impression.
Bid low, and stop optimising the bid type. We keep bids low, because the bid-amount result is the one that moved: +128% per engagement for the highest bid in an account. We bid CPM because LinkedIn bills engagement on CPC, not because CPM is cheaper; the data says bid type makes no difference. We turn Audience Network off: it makes the dashboard look brilliant and the pipeline look empty. What that does to the click price is in what is a good cost per click on LinkedIn.
How much do thought leader ads cost?
The lowest median landing page click is $11.75 and it is not a TLA. Big spenders pay more. Four settings separate a $25 click from a $6 one.
The lowest median landing page click is $11.75, and it is sponsored content, not a thought leader ad.
In this dataset the lowest median landing page click is $11.75. It is sponsored content, not a thought leader ad ★★★
| Setup | Accounts | Median LP CPC |
|---|---|---|
| Sponsored content · single image · traffic (website visits) objective | 219 | $11.75 |
| Sponsored content · video · traffic objective | 74 | $12.01 |
| TLA · single image · engagement | 193 | $13.51 |
| Sponsored content · single image · engagement | 133 | $16.61 |
| TLA · single image · brand awareness | 59 | $16.73 |
| TLA · video · engagement | 63 | $32.34 |
The top 25% of TLA campaigns match the best sponsored content in their own account (−18%, ns). Below the top quarter, sponsored content wins by 34 to 120%. This table places sponsored content against thought leader ads across different advertisers; it is not a paired objective comparison. Within the same account, engagement and brand awareness TLAs are tied on cost per landing page click ($17.24 vs $17.22, chapter 01).
Buy TLAs for what they do, not for the click. 91% of clicks on a thought leader ad never reach a landing page (chapter 09). If the click is the job, sponsored content on traffic is the cheapest way to buy it. If the job is being read and remembered, that is a different purchase.
Half of all TLA spend comes from 23 accounts. They pay the most per landing page click: $20.18 vs $10.53 ★★★
| Accounts | Share of TLA spend |
|---|---|
| Top 5% (23) | 51% |
| Top 10% (46) | 64% |
| Top 20% (92) | 80% |
| Top 50% | 96% |
Median account $4,345 over 12 months. Mean $18,119. 464-account base.
| Spend tier · engagement single-image TLAs | CPM | Cost / eng | LP CPC | Spend on lists / retargeting |
|---|---|---|---|---|
| Top 10% | $105.79 | $2.18 | $20.18 | 81% |
| 10 to 25% | $80.45 | $1.95 | $19.80 | 99% |
| 25 to 50% | $77.32 | $1.46 | $13.24 | 37% |
| Bottom 50% | $46.87 | $1.11 | $10.53 | 0% |
Top 10% vs middle: cost per engagement +50% [+2%, +117%], LP CPC +52% [0%, +218%]. ★★ And within the same advertiser: +15% per landing page click in high-spend months vs low-spend months (n=176), CPM +18% [+11%, +23%]. Even holding the advertiser constant, spending more costs more per unit. ★★★
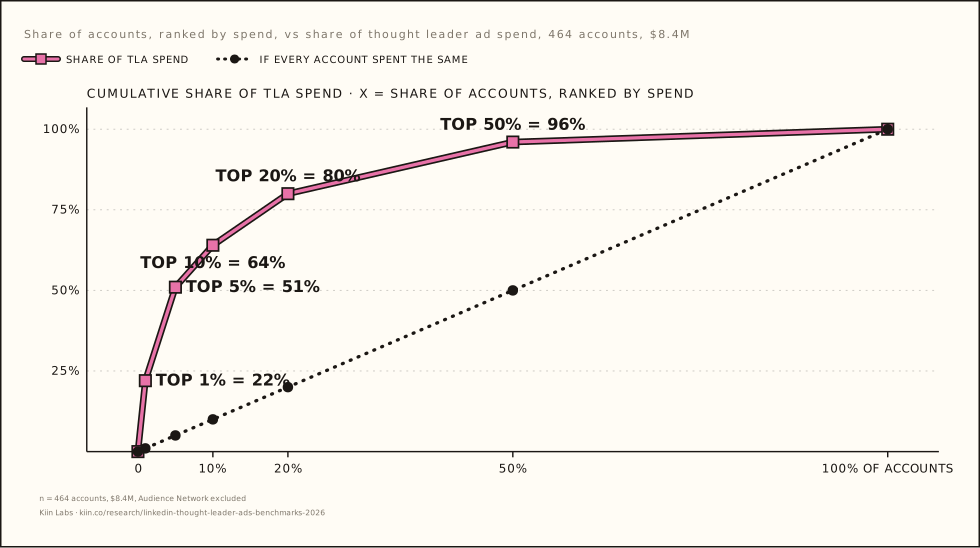
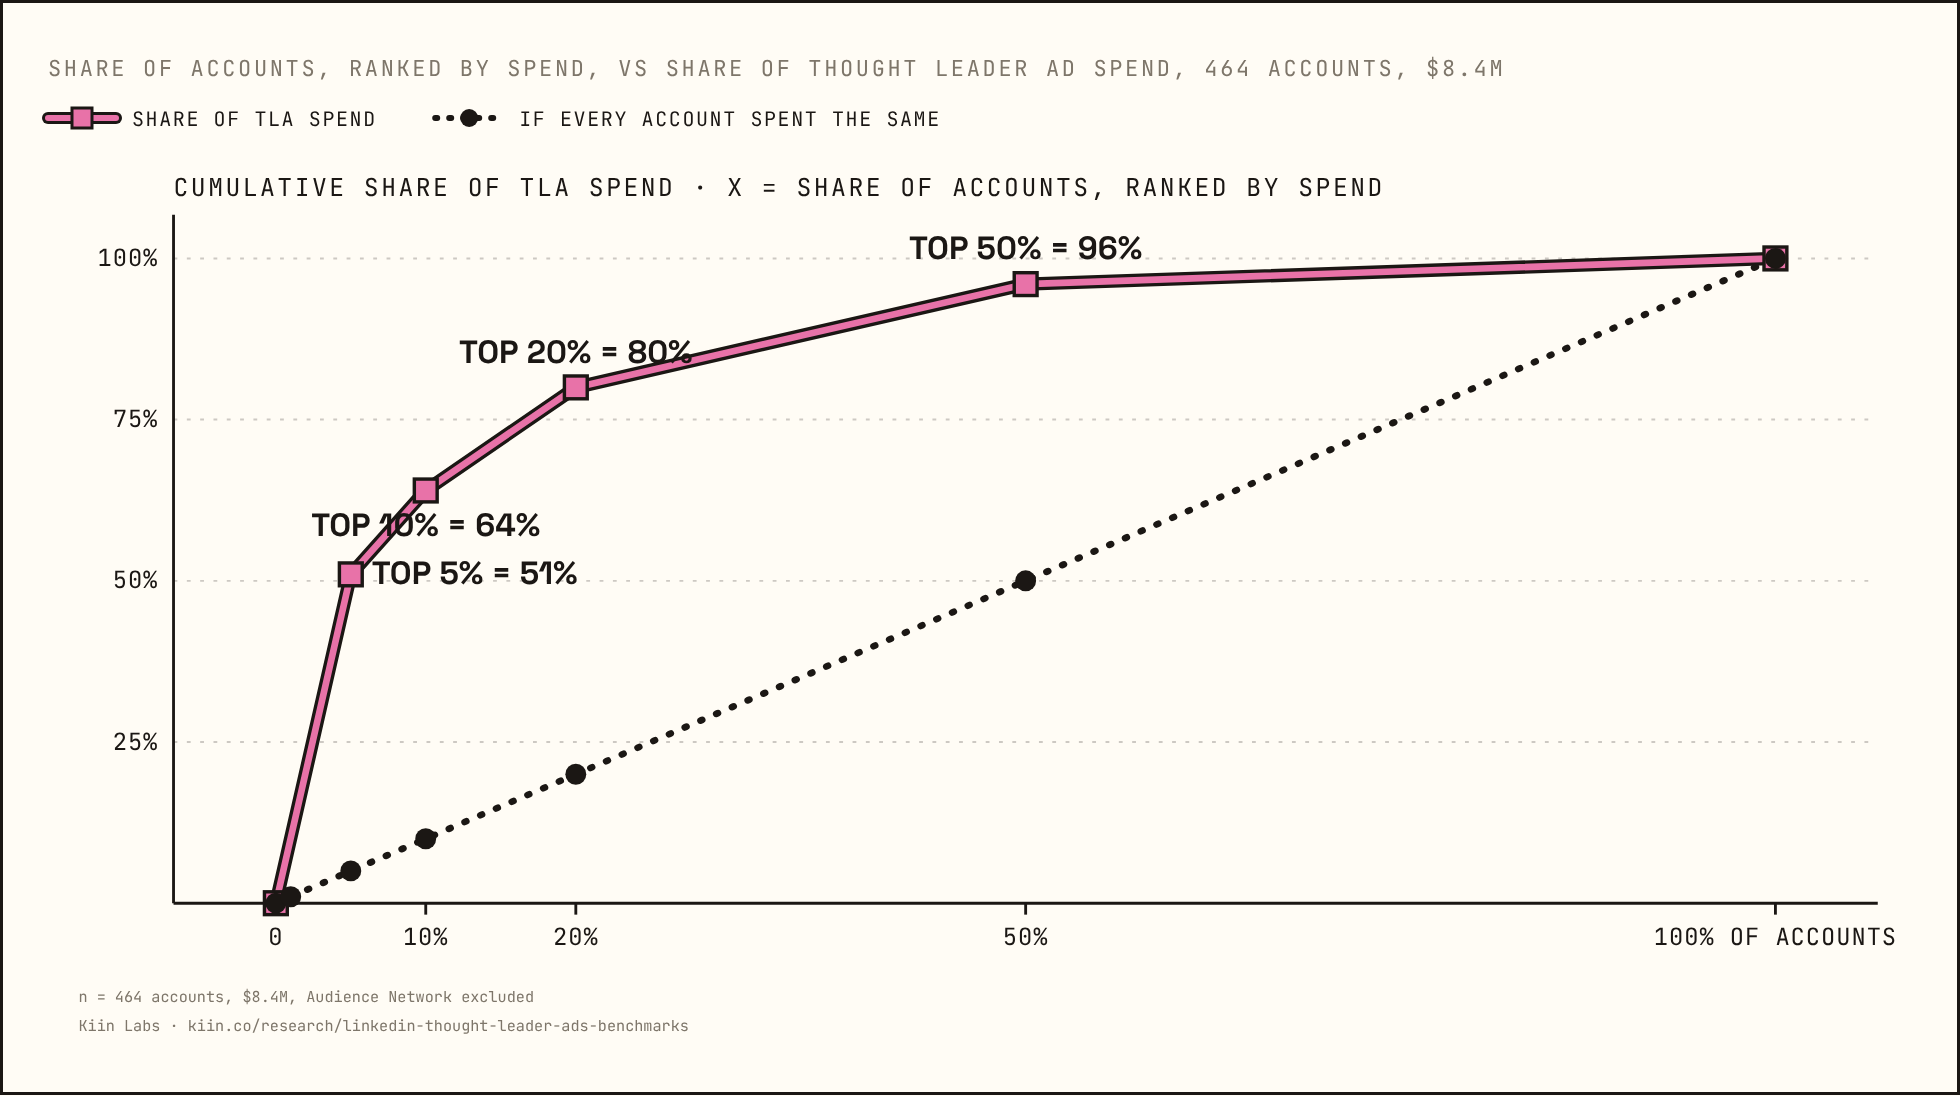
Scale does not get cheaper on LinkedIn. Two things drive it. The big spenders run 81 to 99% of their money on uploaded lists and retargeting, which are smaller, denser, more expensive audiences. And they simply spend more per person targeted, which is the variable that sets CPM. Any benchmark that averages across accounts is describing the 46 accounts in the top 10%. That is why every headline number in this report is a median of per-account figures.
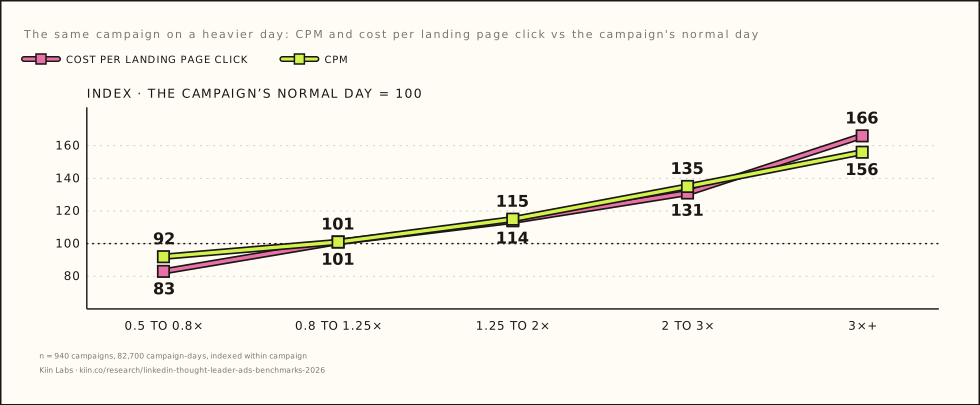
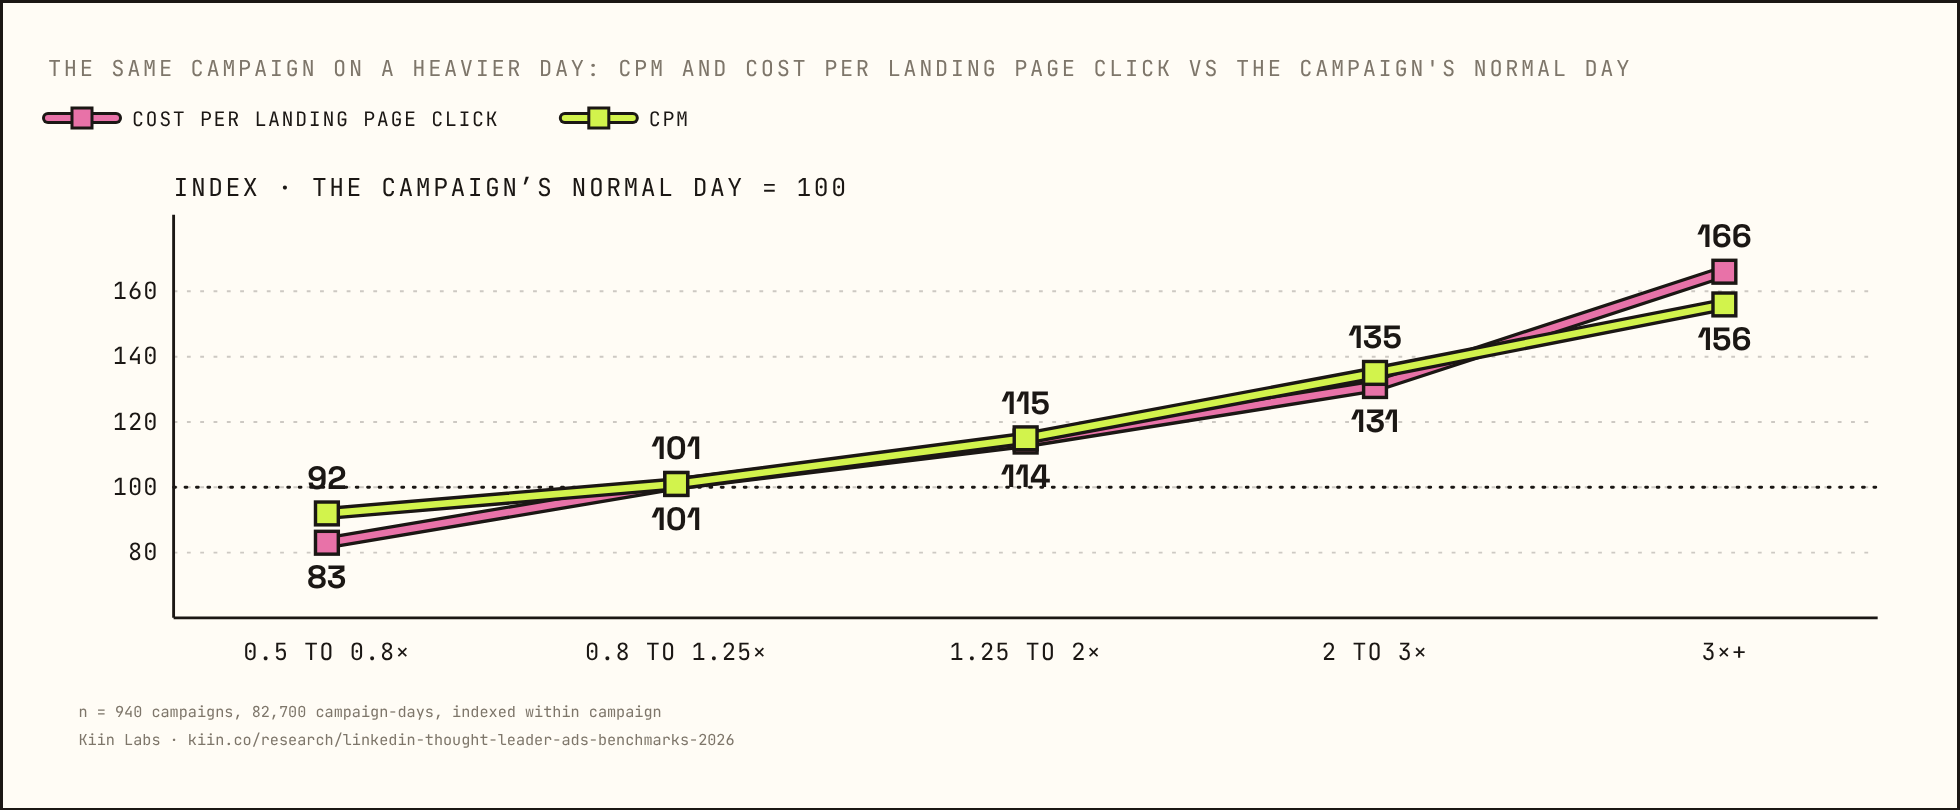
Double a campaign's daily spend: +26% per landing page click, +59% more clicks ★★★
| Day's spend vs the campaign's normal day | CPM index | LP CPC index |
|---|---|---|
| 0.5 to 0.8× | 92 | 83 |
| 0.8 to 1.25× | 101 | 101 |
| 1.25 to 2× | 115 | 114 |
| 2 to 3× | 135 | 131 |
| 3×+ | 156 | 166 |
Within campaign, 940 campaigns, 82,700 campaign-days. Cost per LP click ∝ daily spend0.33. Double a campaign's spend: each landing page click costs 26% more, you get 59% more clicks. Quadruple: +66% per landing page click.
The right unit: dollars per day per 1,000 targeted members.
| $ / day per 1k members | Typical audience | CPM | LP CPC |
|---|---|---|---|
| Under $0.50 | 130,000 | $39.57 | $8.07 |
| $0.50 to 1 | 40,500 | $62.86 | $12.57 |
| $1 to 2 | 26,000 | $78.10 | $16.19 |
| $2 to 5 | 11,000 | $82.66 | $15.69 |
| $5 to 10 | 5,000 | $121.81 | $22.00 |
| $10+ | 3,200 | $121 to 128 | $18 to 20 |
Cost per landing page click doubles between $0.50 and $2 per day per 1,000 members. That is the elbow. $35.04 vs $13.59 per landing page click for the same $50 a day on an audience under 10,000 versus one over 100,000. Spend per targeted member drives CPM (r = +0.50), and CPM drives cost per landing page click (r = +0.745).
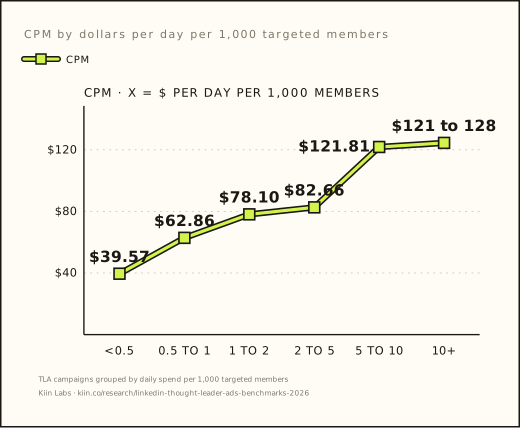
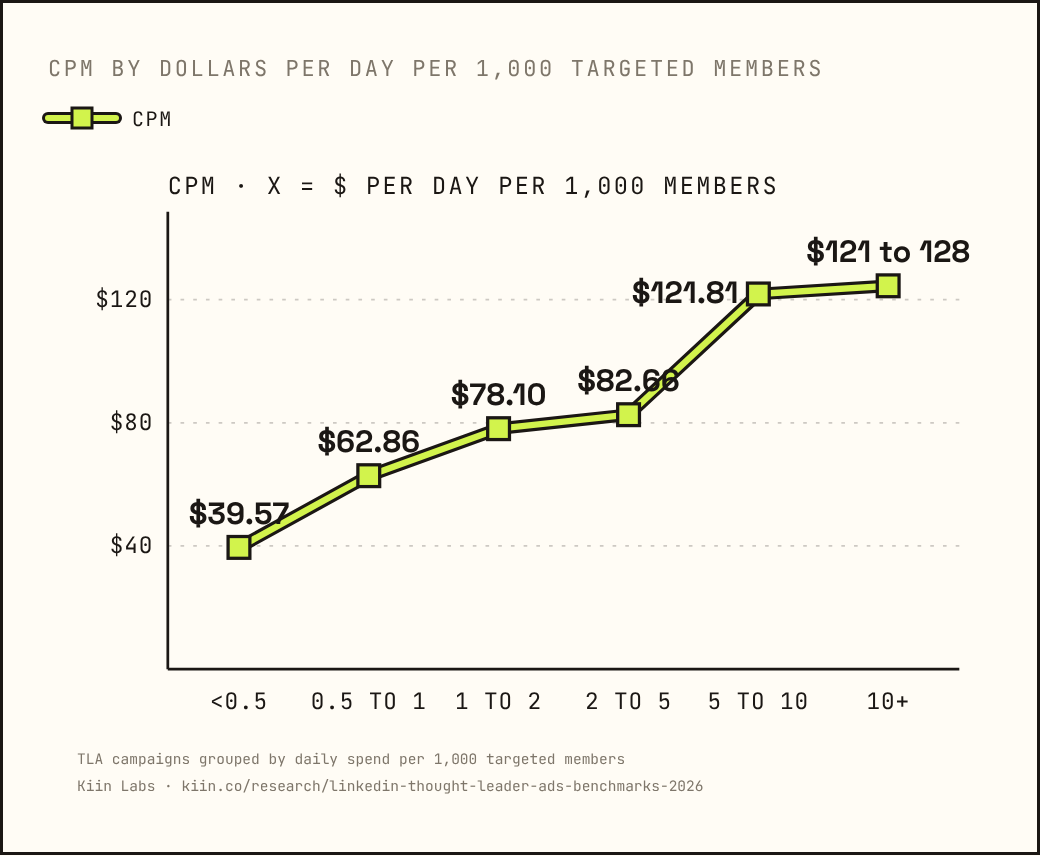
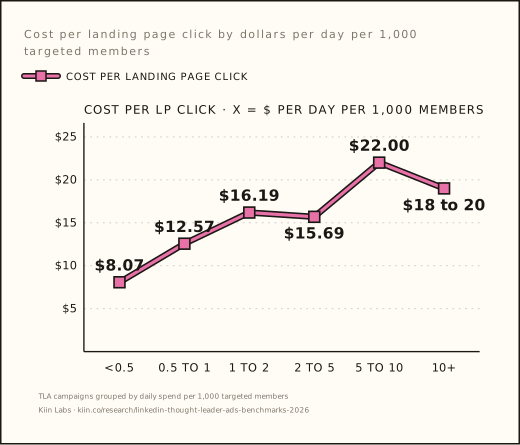
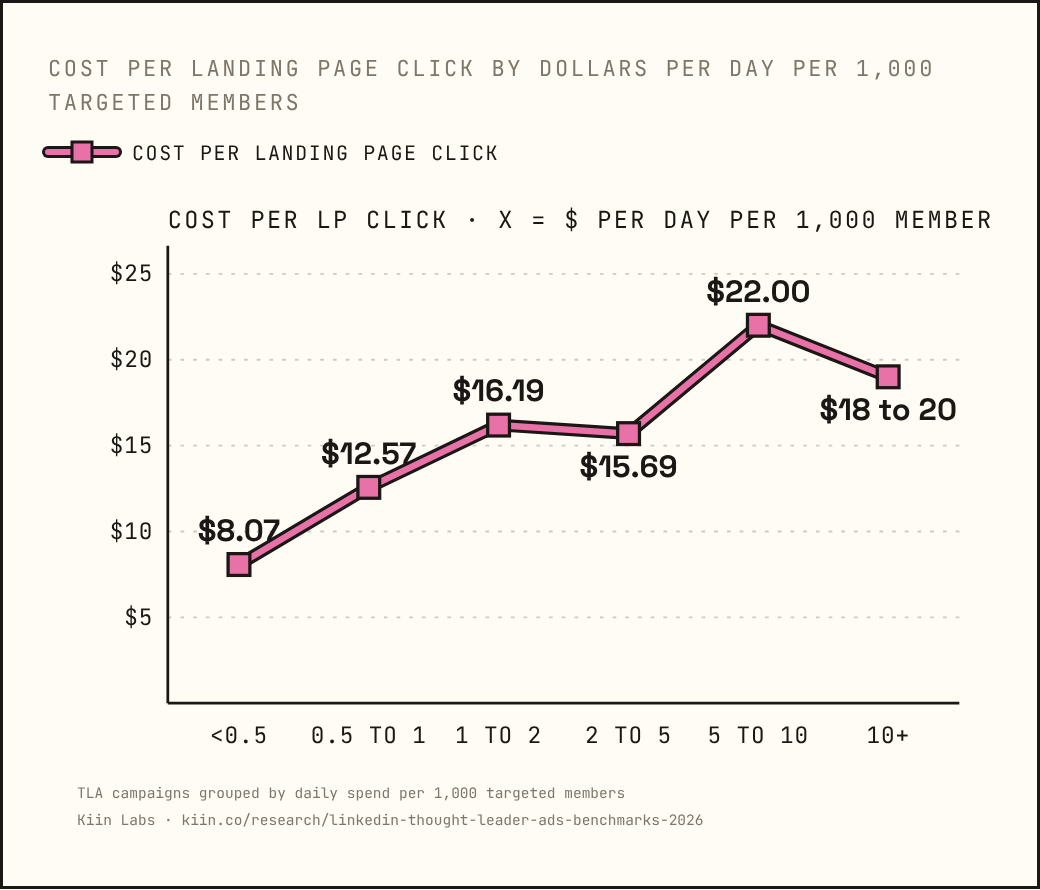
We size budget to the audience, not the other way round. The number we watch is dollars per day per 1,000 targeted members; past $2 the click has doubled in price. If a campaign needs more spend, we widen the audience before we raise the daily budget.
The checklist: four settings separate $25.46 and $6.42 per landing page click ★★★
55% of the variance in cost per landing page click is CPM. 28% is click rate. You can't creative your way out of a bad CPM.
Across 181 accounts, cost per landing page click spreads 15.6× from the 10th to the 90th percentile: the cheapest 10 accounts pay $1.22, the most expensive 10 pay $61.92. The same four settings separate them.
| What differs · cheapest 10 vs most expensive 10 | Cheapest | Most expensive |
|---|---|---|
| Audience size | 105k | 17k |
| $ per day per 1,000 members | $0.26 | $8.38 |
| Bid | $1.82 | $6.96 |
| List / retargeting share | 4% | 94% |
| What doesn't | Cheapest | Most expensive |
|---|---|---|
| Campaigns | 2 | 3 |
| Creatives per campaign | 6 | 6 |
| Frequency | 1.3 | 1.2 |
| Bid type | CPC | CPC |
| Seniority filter | none | none |
55% of the variance in cost per landing page click is CPM, 28% click rate. CPM predicts cost per landing page click at r = +0.745, the strongest relationship in the data. You can't creative your way out of a bad CPM.
The checklist, each box alone is worth 1.6 to 2.2×: ✓ Audience 30,000 or more · ✓ Under $2 a day per 1,000 members · ✓ At least 50% cold targeting · ✓ Bid $3 or under. LinkedIn feed inventory only, Audience Network excluded.
This is the first thing we check on any account we take over. Four settings, in this order: widen the audience past 30,000, drop budget pressure under $2 a day per 1,000 members, move at least half the spend to cold targeting, cap the bid at $3. Creative comes after. It is also the first hour of every managed account we onboard, and the CPM side of it is broken out in LinkedIn CPM benchmarks.
What makes a thought leader ad perform — the author, the hook, or the format?
Author identity explains 67% of engagement variance. Hooks, length, links, boosting and launch timing are noise. Video is 2.4× worse.
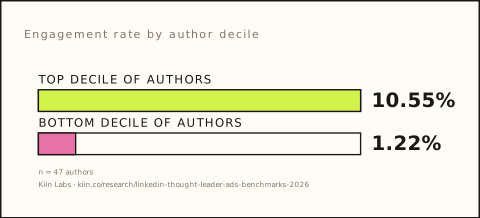
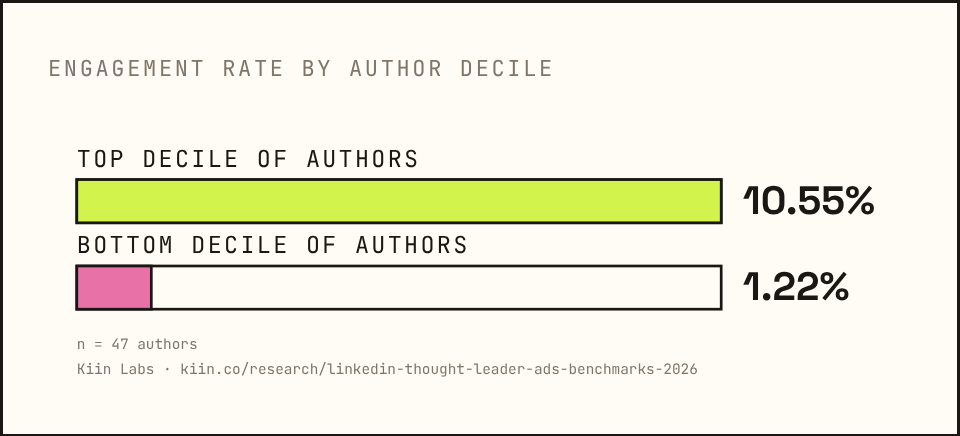
The author explains 67% of engagement variance. Top decile 10.55%, bottom decile 1.22%.
The author explains 67% of engagement variance across accounts, 20% within one company. Top decile 10.55%, bottom decile 1.22% ★★
What this means in practice ★★
Same company, same targeting, same month: two people post, and one consistently gets two to five times the engagement of the other. Within a single company the author still explains 20% of post-to-post variance, the largest single factor we measured, and nothing we could see in the text accounts for it. Hook style, length, question openers, "you", first person, whether there's a link: every one of these vanishes once you hold the author constant. An author's first few posts predict their later ones at r = +0.82, so the difference shows up fast and stays.
It is not the auction favouring them: CPM does not fall for high-engagement creatives on CPM bidding (r = −0.02). It is not their category: named vs unresolved, frequent vs occasional posters, none of it predicts the gap. What is left is the person's standing with the audience, and the organic spillover that standing earns. The study can show the effect and its size; it cannot yet show which of those two carries it.
Base, 47 authors; the within-company figure is across multi-author accounts. ★★
Pick the person, then worry about the post. Most creative testing on thought leader ads is testing the wrong variable. The first 48 hours predict a campaign's life at r = 0.81, and that is the post being good on day one and still good on day 21, not the launch time or the hook formula. Setting up the author, the post and the campaign is in the thought leader ads guide.
Video TLAs cost $32.34 per landing page click vs $13.51. Links, boosting and launch timing: no effect
When posts go paid. 23% of TLA creatives are promoted within 2 days of posting, 39% within a week. Median post age at promotion: 16 days. 22% are over 90 days old. Cross-account, old posts look 43% better; the accounts that boost old posts are better, the boosting isn't. (3,394 creatives, 361 accounts.)
No launch-day or launch-hour effect. Fri to Sun launch vs Tue to Thu, cost per engagement −4% [−13%, +5%]. Afternoon vs morning: +1%. Launch weekday to cost per engagement within account: r = 0.00. Launch habits: Mon 21% · Tue 20% · Wed 23% · Thu 17% · Fri 16% · weekend 3%. ★★
We stop A/B testing the container. Single image, the author's own voice, a link if the post needs one. The variables that move results are who is posting and how often the same person has seen it.
Who should thought leader ads target, and how far do they reach?
Executives engage more and cost the same. A list is a cold audience. A median TLA reaches 20% of its target.
CXOs engage 4.42% vs 3.46% for senior ICs, at the same cost per click. A median TLA reaches 20.5% of its audience in 90 days.
Video thought leader ads: if the view is the goal, use the video views objective and let LinkedIn bid ★★
Video views is a real third objective for thought leader ads, but a small one: 4.4% of TLA spend, and only 12 accounts run video TLAs on it alongside another objective. Too few to pair on their own. So we measured the question on every sponsored video campaign in the panel (Audience Network excluded, $50 and 2,000 impressions minimum, paired within account) and then checked whether the thought leader subset agrees. It does. A view is LinkedIn's two-second view; a completion is the full watch. Added 17 Sep 2026; HTML edition only.
Audience. Cold and big is cheapest: $0.072 a view over 100,000 people, $0.148 under 10,000 (cross-account). Retargeting vs cold, paired in 27 accounts: view rate +13% [+4%, +21%], cost per view +17% ns, landing page CTR +37%. An uploaded list vs cold, 44 accounts: nothing.
Benchmarks, thought leader video on the video views objective (36 accounts, median): cost per view $0.123 · view rate 46.5% · CPM $60.61 · completion 2.6% of views · cost per completion $5.79. Sponsored video on the same objective, 229 accounts: $0.108 · 36.8% · $38.21 · 3.3% · $2.73. Thought leader video is watched more and costs more per view.
A video thought leader ad has one job it is good at: being watched. So when we run one, the objective is video views, the bid is LinkedIn's "maximise video views", the audience is cold and over 100,000, and we judge it on completions and cost per view, never on clicks, which it will not get. If the post also needs comments or a site visit, it is a static post on engagement. Video on brand awareness stays the one setup we never run.
CXOs engage 4.42% vs 3.46% for senior ICs, at the same cost per click. 74% of engagement TLA campaigns (79% of spend) set no seniority filter ★★
| Seniority tier | Engagement rate |
|---|---|
| Senior IC | 3.46% |
| Manager | 3.88% |
| Director | 4.33% |
| VP | 4.31% |
| CXO | 4.42% |
| Owner | 4.30% |
| Partner | 4.42% |
Cost per LP click $12.51 to $13.47 across every tier. No-seniority-filter campaigns pay the most: $16.88.
| Job function | LP CPC |
|---|---|
| Entrepreneurship | $9.60 |
| HR | $13.67 |
| Marketing | $13.98 |
| Sales | $16.66 |
| Operations | $18.22 |
| IT | $19.21 |
| Quality assurance | $22.17 |
HR engages 5.52%, QA 1.70%: 3×. Technical and operational functions cost 50 to 100% more to reach.
We always set a seniority filter, usually Director and above, and one or two functions. It costs nothing extra to reach the C-suite with a thought leader ad, and the no-filter campaigns pay the most per click of any group. Which audiences are warm and which are secretly cold is in LinkedIn retargeting for B2B.
An uploaded list performs like cold: every paired interval spans zero. True retargeting: +25% engagement at +58% CPM
Of 1,927 TLA campaigns: 33% cold (median audience 63,500), 48% uploaded company or contact lists (23,000), 19% true retargeting of website visitors and ad engagers (5,900). Most of what gets called retargeting is a list.
| Paired within account · vs cold | CPM | Eng rate | Cost / eng | LP CPC |
|---|---|---|---|---|
| Uploaded list (n=43) | +11% | −2% | +22% | −3% |
| True retargeting (n=52) | +58% | +25% | +14% | +14% |
List: every CI spans zero. Retargeting: CPM and engagement significant, both costs span zero. Retargeting beats a list in the same account: engagement +40%, cost per engagement −9%, LP CTR +23%. Conversions +20% per click, cost per conversion −47%, n=16 ★
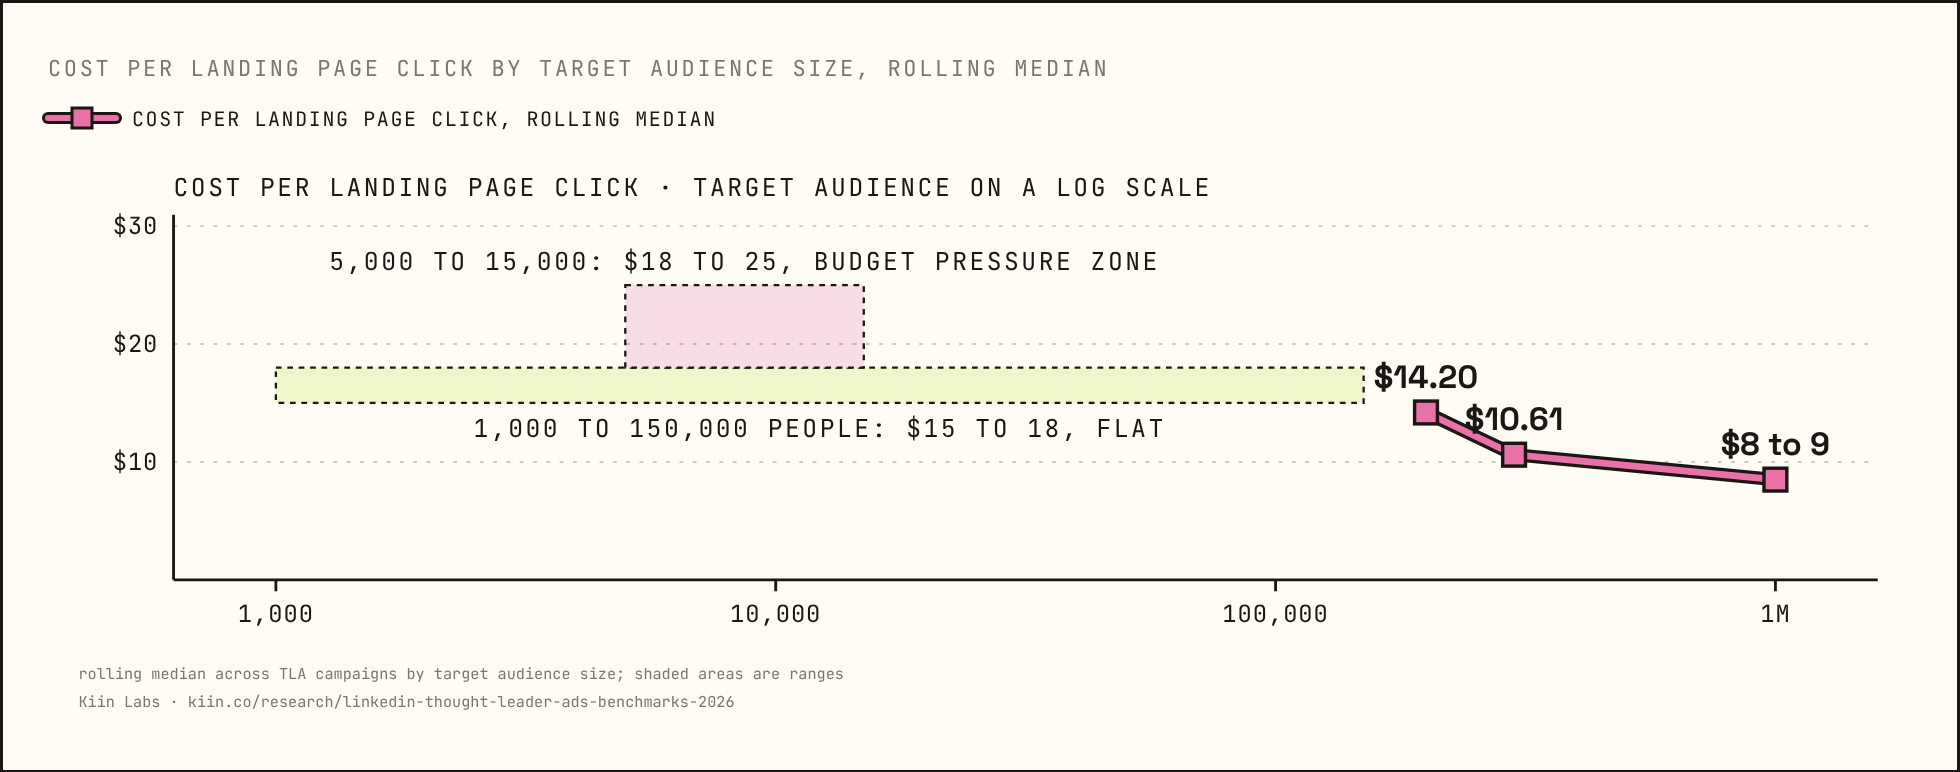
| Audience size | LP CPC (rolling median) | Note |
|---|---|---|
| 1,000 to 150,000 | $15 to 18 | flat |
| 5,000 to 15,000 | $18 to 25 | budget pressure zone: a normal $30 to 50 a day overspends here |
| 200,000 | $14.20 | |
| 300,000 | $10.61 | |
| Over 1M | $8 to 9 |
LP CTR flat across the whole range (0.41 to 0.59%). Size changes what an impression costs, not whether people click. At equal budget pressure, size doesn't matter. A list costs $340 per 1,000 people reached vs $159 cold, 2.1×. ★★★
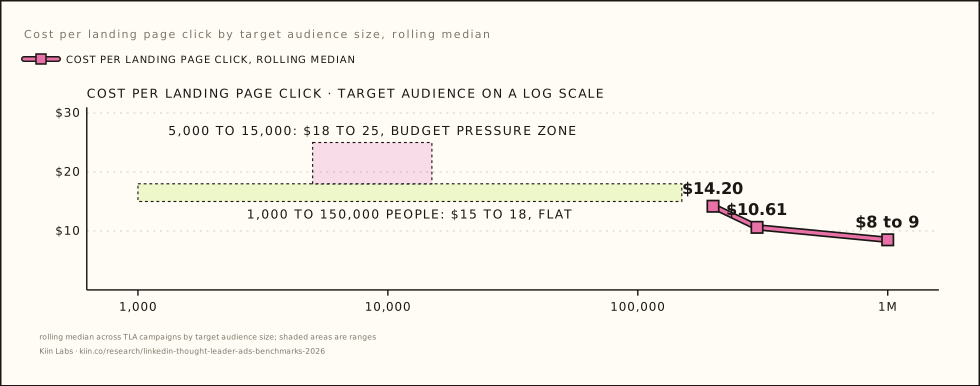
We treat an uploaded list as a cold audience with a higher CPM, not as retargeting. Real retargeting is website visitors and ad engagers, and it buys attention for its premium: same cost per click, +25% engagement, +20% dwell. A list costs 2.1× more per person reached than cold.
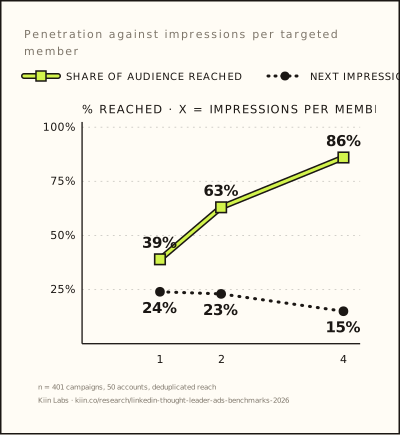
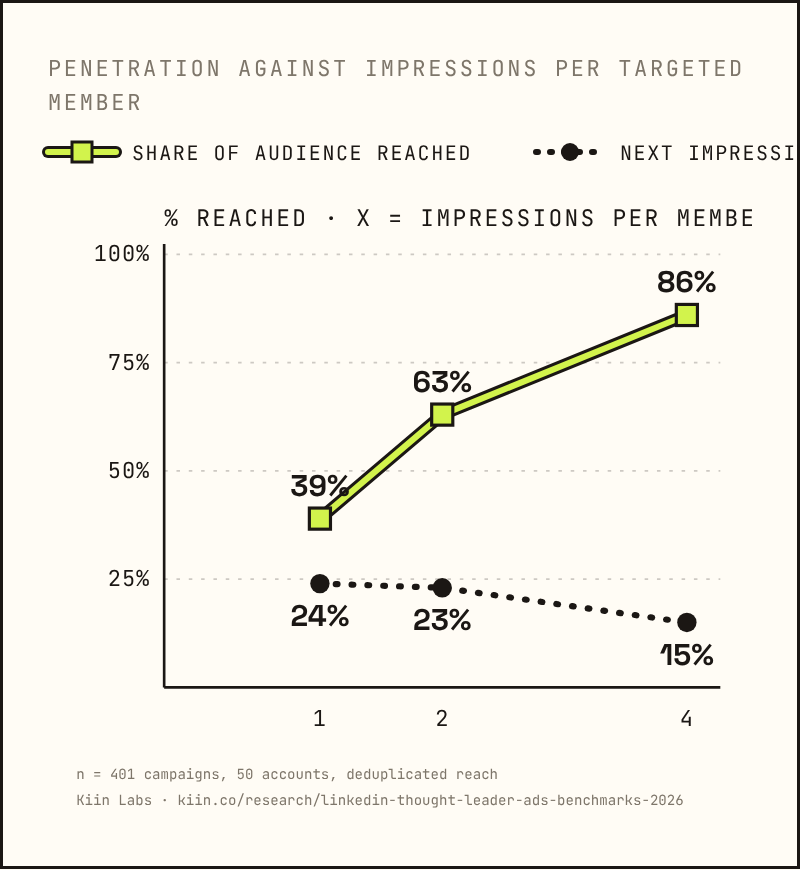
The median TLA reaches 20.5% of its audience in 90 days. Only 1 in 4 ever pass 40% ★★
| Impressions per member | Reached | Next impressions to someone new |
|---|---|---|
| 1 | 39% | 24% |
| 2 | 63% | 23% |
| 4 | 86% | 15% |
Penetration = 1 − e−(impressions per member ÷ 2). Frequency doesn't buy reach: at 1× cumulative, only 24% of the next impressions go to anyone new. LinkedIn re-serves before it prospects.
| Audience | Cost to reach 50% |
|---|---|
| 3,400 people | $448 |
| 9,800 | $1,752 |
| 27,000 | $3,544 |
| 81,000 | $9,740 |
| 260,000 | $15,832 |
Modelled from 1.39 impressions per member at each band's observed median CPM. Cost per 1,000 reached rises with depth: $122 at 0 to 5% penetration, $500 at 35 to 50%. Reaching deeper doesn't dilute engagement, the 75 to 100% band engages 5.58%, the highest. ★★
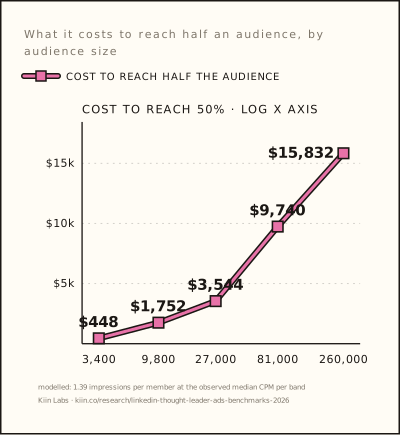
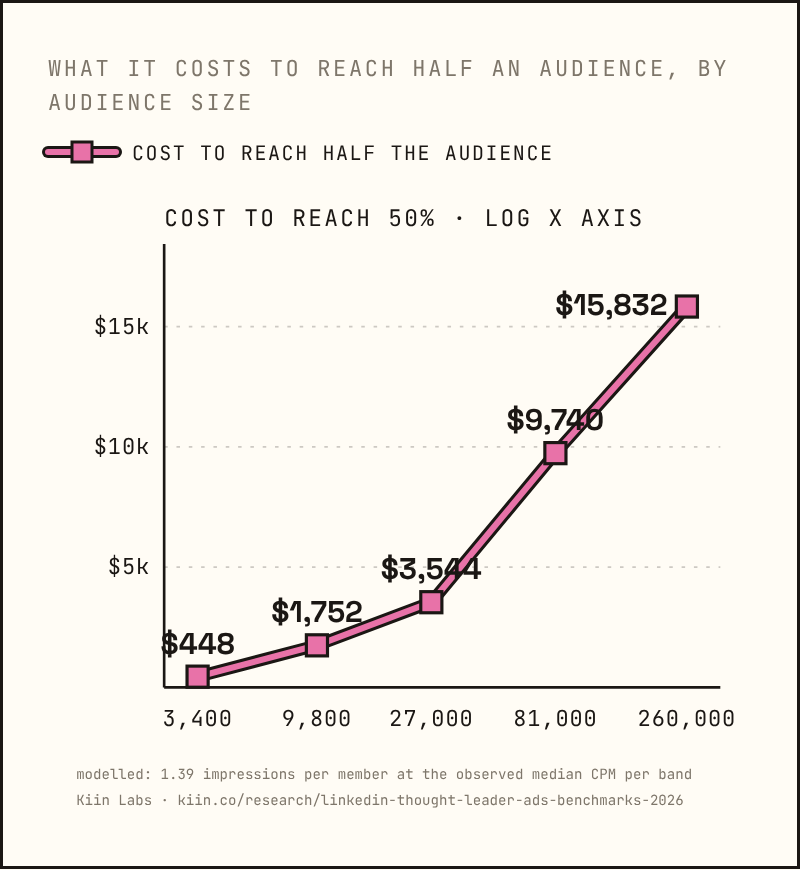
We report reach as a share of the target audience, not as an impression count. A campaign that has reached 20% of its list is normal; one at 40% is in the top quarter. The 40th percent costs 4× the first 5%, and it engages just as well.
When should thought leader ads run?
Weekends click 9 to 10% better. March is 16% cheaper. Q1 to Q2 is a 30% CPM step.
Weekends click 9 to 10% better. March CPM is 16% under the year. Q1 to Q2 is a 30% CPM step.
Weekend impressions cost 1 to 4% less and click through 9 to 10% better than weekdays ★★★
Within campaign: each serving day indexed against the campaign's own typical day (100). 823 engagement single-image TLA campaigns.
| Serving day | CPM | Engagement rate | Landing page CTR | Cost per engagement |
|---|---|---|---|---|
| Monday to Friday | 100 to 102 | 98 to 102 | 97 to 100 | 99 to 101 |
| Saturday | 99 | 98 | 110 [106 to 113] | 100 |
| Sunday | 96 [95 to 98] | 100 | 109 [106 to 113] | 97 [96 to 98] |
Weekends carry 18% of spend. The landing page click-rate lift is the only day-of-week effect in the data that isn't noise. Don't daypart out the weekend: excluding Saturday and Sunday removes your cheapest, highest-clicking 18% of delivery. No launch-day effect either: Fri to Sun launch vs Tue to Thu, cost per engagement −4% [−13%, +5%]; launch weekday to cost per engagement within account, r = 0.00. ★★
Weekend scheduling is one of the most common 'optimisations' in thought leader ad accounts, and it costs money. People scroll LinkedIn on Saturday; the auction is quieter; the click rate is higher. Leave it on.
March CPM is 16% under the year. Q2 vs Q1, same advertisers: +30% CPM, +47% per landing page click ★★
| Month · within account, typical month = 100 | CPM | Eng rate | Cost / eng |
|---|---|---|---|
| March | 84 | 96 | 91 |
| February | 90 | 100 | 93 |
| December | 104 | 105 | 100 |
| August | 104 | 97 | 105 |
| September* | 107 | 92 | 116 [104 to 124] |
*First 8 days of September, 86 accounts. Provisional; re-checked when the month completes. Full within-account range: 27 points (84 to 107). Raw dataset CPM doubled over the year ($45 to $90): account mix, not calendar.
| Quarter on quarter, same advertisers | CPM | Eng rate | Cost / eng | LP CPC |
|---|---|---|---|---|
| Q4 to Q1 (n=63) | −16% [−27%, −3%] | −6% | −13% | −4% |
| Q1 to Q2 (n=153) | +30% [+22%, +44%] | −1% | +29% | +47% [+24%, +70%] |
| Q2 to Q3 (n=150) | +1% | −10% [−15%, −8%] | +8% | +11% |
Q1 index 86: 14 to 16% under the typical quarter. No January premium. Q2 to Q3 price holds, engagement −10%. One year, one cycle; Q4 rests on 63 to 73 accounts. ★★★ March cheapest, early September most expensive so far (CPM 84 vs 107; September is 8 days, provisional). December is not dead: engagement 105, CPM 104.
We front-load annual budgets into Q1 and keep December on. September looks expensive so far, but that is eight days of data; we are not planning around it yet.
LinkedIn thought leader ads benchmarks: CTR, engagement, dwell and cost per click
91% of TLA clicks never reach a landing page. Median LP CTR 0.46%, engagement 4.46%, dwell 7.0s.
91% of clicks on thought leader ads never reach a landing page. Total CTR 4.56%. Landing page CTR 0.43%.
91% of clicks on thought leader ads never reach a landing page. Total CTR 4.56%. Landing page CTR 0.43% ★★★
Because LinkedIn counts reactions, comments, "see more" and profile visits as clicks. Only about 9% of total TLA clicks in this dataset were clicks to a landing page. Nothing failed to load; most clicks were never headed there. Measured on total CPC, TLAs look 80% cheaper than traffic ads. On cost per landing page click, 102% more expensive. A 9× swing from the denominator alone.
| What predicts what | r |
|---|---|
| Engagement rate → LP click rate, within account | +0.57 |
| Engagement rate → LP click rate, across accounts | +0.19 |
| Dwell → engagement rate | +0.65 |
| Dwell → LP click rate | +0.05 |
| Total CTR → engagement rate | +0.998 |
| CPM → LP CPC | +0.745 |
| CPM → LP click rate | −0.01 |
Engagement rate tells you which post in your account will get landing page clicks, not which account will. Attention converts to reactions, not visits. Total CTR is engagement rate with a different name.
The benchmarks: 212 accounts, median / good / exceptional ★★★
| Metric | Median | Good | Exceptional |
|---|---|---|---|
| Landing page CTR | 0.46% | 0.67% | 0.99% |
| Engagement rate | 4.46% | 6.44% | 9.26% |
| Dwell | 7.0s | 9.0s | 10.4s |
| Cost per landing page click | $14.71 | $8.37 | $3.15 |
| CPM | $65 | $36 | $21 |
Three medians for a TLA landing page click appear in this report and they are different subsets: $14.71 here (212 engagement-TLA accounts, the benchmark), $13.51 in chapter 05 (single-image engagement TLAs, 193 accounts) and $17.22 in chapter 01 (the 36 accounts running both objectives, paired). Cite $14.71 as the benchmark. Spread 15.6× p10 to p90 (181 accounts); company ads 9×.
We report thought leader ads on engagement rate, cost per engagement and cost per landing page click, never on total CTR or CPC. Total CTR is engagement rate with a different name (r = 0.998), and total CPC makes a TLA look 80% cheaper than it is. Every format's medians on one page: LinkedIn Ads benchmarks 2026. If you would rather have someone run it to these numbers, the agencies that do, Kiin among them, are compared in the best B2B SaaS marketing agencies.
Ten numbers to quote, with what they rest on
Ten findings, each as a sentence you can quote, with what it means and what it rests on. Medians across B2B tech advertisers, 8 Sep 2025 to 7 Sep 2026, USD, Audience Network excluded. Free to cite and reproduce with a link to this page.
Each one is a complete sentence you can copy. ★★★ = same advertisers compared within their own accounts, 100 or more of them · ★★ = same, 25 to 100 · ★ = directional.
Brand awareness reaches 77% more people per dollar than engagement.
So: use it for reach on cold audiences of 30,000 or more. On anything smaller, or on any list, it just pays more per engagement.
A landing page click costs the same on brand awareness and engagement: $17.24 vs $17.22.
So: the click never decides the objective. Choose by what you want, reach or action.
On an audience under 10,000, brand awareness costs $4.75 per engagement. Over 100,000, $1.06.
So: same objective, opposite answer. The audience size decides, the cheaper impression only helps if it lands on someone new.
Campaigns report a frequency of 3.5. The account actually delivers 9.5.
So: campaigns share people and each counts them separately. Every frequency cap and fatigue alert should use the account number, not the campaign one.
Engagement is down 9% once everyone in the audience has seen the ad once, and 22% after five times.
So: fatigue is caused by frequency, not by how long the ad has run. Cost per click won't warn you, it moves a month late.
An audience under 10,000 sees a creative once in 14 days. An audience over 100,000 takes 53.
So: refresh creative on audience size, not the calendar. A small list needs a new creative every two weeks.
The highest-bid campaign in an account pays 128% more per engagement than the lowest, and gets 32% less of it.
So: bid low. Bid type (CPC vs CPM) makes no difference; bid amount does.
The cheapest landing page click on LinkedIn is $11.75, and it is sponsored content, not a thought leader ad ($13.51).
So: buy thought leader ads to be read and remembered. If the click is the job, sponsored content on the traffic objective is cheaper.
The top 10% of authors get 8.6× the engagement of the bottom 10%: 10.55% vs 1.22%.
So: pick the person before you worry about the post. No hook, length or link decision survives holding the author constant.
91% of clicks on thought leader ads never reach a landing page.
So: total CTR (4.56%) is engagement rate with a different name. Landing page CTR (0.43%) is the traffic number. Report on that.
Ilic, P. (2026). LinkedIn Thought Leader Ads Benchmarks 2026. Kiin Labs. kiin.co/research/linkedin-thought-leader-ads-benchmarks. Figures are medians of paired within-account comparisons, USD, 8 Sep 2025 to 7 Sep 2026, LinkedIn Audience Network excluded.
How we did it, and what we can't answer
Method
The panel. $31M of LinkedIn spend over 365 days. 464 accounts running thought leader ads ($8.4M), 447 running sponsored content ($22.7M), 411 running both. LinkedIn Audience Network excluded throughout. Data via the LinkedIn Marketing API and reach API through Kiin Intelligence, at campaign, creative and daily level.
Paired within account. Every comparison is the same account running both sides in the same window. Ratios are per-account, then the median across accounts, with a 95% bootstrap confidence interval on the paired ratio. Where a split is cross-account it is marked with a single star and treated as directional.
Indexing. Fatigue is measured per creative against its own launch period (launch = 100), by cumulative frequency and separately by week. Calendar effects are indexed to each account's own typical month or quarter, so the mix of advertisers cannot move them. Diminishing returns are measured within campaign, each day against the campaign's median day.
Bid comparisons. The bid-amount result (highest vs lowest bid) is within account, not matched on audience. The bid-type result (CPC vs CPM) is matched within account on audience size (0.5 to 2×).
Deduplicated reach. True frequency uses account-level deduplicated reach from LinkedIn's reach API against the sum of campaign-reported reach in the same windows (131 accounts). Penetration figures rest on 401 campaigns across 50 accounts with deduplicated reach data, not the full panel.
Pipeline. LinkedIn API + reach API → Kiin Intelligence → pair within account → index within campaign → bootstrap CIs → report.
What we can't answer
Founder vs employee posting. Role isn't in the data; it needs 189 author lookups.
Whether TLAs lift sponsored content. Only 20 of 447 sponsored content accounts don't also run TLAs, so there is no control group. The observed −13% cost per landing page click and +19% engagement is mostly not significant.
Which objective drives pipeline. Needs CRM-matched deals by objective. Separate study.
Whether account-level frequency explains fatigue better than campaign frequency. 21 accounts have enough account-level reach windows; neither correlation reaches 0.25.
Whether the author effect is audience trust or feed-side amplification. Testable with viral share by author; not yet run.
A classification gap. 228 TLA campaigns misfiled as sponsored content by a flag-propagation gap. Reclassifying would make the sponsored-content-wins-on-clicks finding slightly stronger.
Two findings we measured and are not reporting. Dwell time and penetration rate both reversed direction between a 90-day and a 12-month window. They are not stable enough to publish as findings.
Frequently asked questions
Twenty-four questions people ask about thought leader ads, each answered with a number from this study.
What is a LinkedIn thought leader ad?
A LinkedIn ad where a company sponsors a post published from an individual's personal profile, a founder, an executive, an employee, rather than from the company page. It appears in the feed as a normal post with 'Promoted' beneath it. In this study, 464 accounts spent $8.4M on them over 12 months.
What is a good engagement rate for LinkedIn thought leader ads?
Across 212 engagement-TLA accounts, the median engagement rate is 4.46%. Good is 6.44% and exceptional is 9.26%. Engagement counts every reaction, comment, share, follow and click including 'see more' and profile visits, divided by impressions.
What is a good click-through rate for thought leader ads?
Landing page CTR, clicks that reach your site, has a median of 0.46%, good 0.67%, exceptional 0.99%. Total CTR, which LinkedIn reports by default, has a median of 4.56%, but 91% of those clicks never reach a landing page; total CTR is engagement rate with a different name (r = 0.998).
How much does a thought leader ad cost per click?
The benchmark median cost per landing page click across 212 accounts is $14.71; good is $8.37 and exceptional $3.15. The median CPM is $65. Sponsored content on the traffic objective is cheaper per landing page click at $11.75. Four settings, audience over 30,000, under $2 a day per 1,000 members, at least half cold targeting, bid $3 or under, separate a $25.46 click from a $6.42 one.
Should thought leader ads use engagement or brand awareness?
Paired within the same accounts, neither is cheaper per landing page click ($17.24 vs $17.22). Brand awareness reaches 77% more people per dollar; engagement gets 88% more engagement per impression. Use brand awareness on cold audiences of 30,000 or more; use engagement on retargeting pools, uploaded lists, audiences under 10,000, video, and anything you need acted on.
Which objective should a video thought leader ad use?
Video views, if the goal is people watching it. Paired within account across sponsored video, the video views objective costs 18% less per view and 32% less per completion than brand awareness (54 accounts) and 25% less per completion than engagement (90 accounts; Report No. 6, paired on its own window, finds that gap not significant, +13% ns); cost per two-second view is a tie with engagement, which also buys 78% more engagement and four times the landing page click rate, so engagement is the choice only when you want reactions as well as the view. Within video views, LinkedIn's automatic "maximise video views" bidding beats a manual CPV bid in the same account (Report No. 6, 26 accounts: CPM −17%; cost per view and per completion not significant; $0.076 vs $0.129 cross-account) and the highest-bid campaign pays 90% more per view than the lowest for a 4% higher view rate. The thought leader subset (12 accounts) points the same way. Thought leader video on video views: $0.123 per view, 46.5% view rate, $5.79 per completion, median of 36 accounts. Video on brand awareness remains the one setup this study says never to run.
How often should someone see a thought leader ad before it fatigues?
Engagement is down 4% before the average person has seen the ad once, 9% after one full pass of the audience, and 22% after five. Time does not cause it, cost per click, CPM and dwell are flat over eight weeks. An audience under 10,000 completes a pass in 14 days; over 100,000 takes 53 and only one in ten campaigns ever get there. The cheapest monthly frequency band is 1.5 to 2×.
Do video thought leader ads work?
Not for landing page clicks. Video TLAs cost $32.34 per landing page click against $13.51 for single image, 2.4× worse, and brand awareness on video costs 99% more per engagement. Sponsored content video on the traffic objective costs $12.01 cross-account, but paired within account Report No. 6 finds video 18% dearer per landing page click than an image on website visits.
Can better creative fix a high cost per click on LinkedIn?
Rarely. Across 181 accounts, 55% of the variance in cost per landing page click is CPM and only 28% is click rate. CPM predicts cost per landing page click at r = +0.745, the strongest relationship in the data. A bad CPM comes from audience size, budget pressure, bid and list share, four settings, and the cheapest ten accounts pay $1.22 per landing page click against $61.92 for the most expensive. You can't creative your way out of a bad CPM; fix the four settings first.
Does the author matter more than the post?
Yes. Author identity explains 67% of engagement variance across accounts and 20% within one company. The top decile of authors gets 10.55% engagement, the bottom decile 1.22%, an 8.6× spread. No hook pattern, post length, link decision, boosting choice or launch timing survives holding the author constant.
What is a good CPM for LinkedIn thought leader ads?
Across 212 engagement-TLA accounts the median CPM is $65; good is $36 and exceptional is $21. CPM is set mostly by audience size and budget pressure, dollars per day per 1,000 targeted members, and it predicts cost per landing page click at r = +0.745, the strongest relationship in the data.
What is a good dwell time for a LinkedIn ad?
For thought leader ads the median is 7.0 seconds, good is 9.0 and exceptional is 10.4. Dwell predicts engagement rate (r = +0.65) but not landing page clicks (r = +0.05), attention converts to reactions, not visits.
Should thought leader ads bid CPC or CPM?
It makes no measurable difference. Across 49 accounts running both, every confidence interval spans zero at every audience size. What does matter is the bid amount: the highest-bid campaign in an account pays 128% more per engagement than the lowest and gets 32% less engagement. Bid low; the type is a distraction.
How many people does a thought leader ad actually reach?
The median campaign reaches 20.5% of its target audience in 90 days. Only one in four ever pass 40%, and one in ten pass 75%. Reach builds fast and stalls: 68% of 90-day reach arrives in the first 30 days. At one impression per member, only 24% of the next impressions go to anyone new, LinkedIn re-serves before it prospects.
What is the best day to run LinkedIn ads?
Weekends. Within the same campaigns, Saturday and Sunday click through 9 to 10% better than weekdays at 1 to 4% lower CPM. They carry 18% of spend, and excluding them removes the cheapest, highest-clicking delivery in the week. There is no launch-day or launch-hour effect.
What is the cheapest month to run LinkedIn ads?
March, at a CPM index of 84 against each account's typical month. February is 90. Q1 as a whole runs 14 to 16% under the typical quarter, and the step from Q1 to Q2 is +30% CPM and +47% per landing page click for the same advertisers. December is not dead: engagement 105, CPM 104.
Should you use LinkedIn Audience Network for thought leader ads?
No. Audience Network delivers 3.7× the click rate at 83% cheaper clicks, and 9× worse conversion. Conversions per landing page click are 14.80% off-network versus 1.68% on it, and cost per conversion is 46% higher. Nine of 37 accounts got zero conversions from Audience Network while converting off it. Every figure in this report excludes it.
Does retargeting work for thought leader ads?
True retargeting, website visitors and ad engagers, earns +25% engagement and +20% dwell at +58% CPM, with cost per click no different from cold. An uploaded company or contact list is not retargeting: paired within account it performs like a cold audience with a higher CPM (every interval spans zero), and it costs 2.1× more per person reached, $340 per 1,000 against $159 cold.
How big should a LinkedIn ad audience be?
There is no sweet spot: cost per landing page click is flat at $15 to 18 from 1,000 to 150,000 people, and landing page click rate is flat at 0.41 to 0.59% across the whole range. What matters is budget pressure, dollars per day per 1,000 targeted members. Past $2 a day per 1,000 the click has doubled in price. The 5,000 to 15,000 band is the trap: a normal $30 to 50 a day overspends it.
Should you put a link in a thought leader ad?
It does not change engagement. Within 32 accounts running both, link-less posts engage +2%, nothing. Across accounts two thirds of 10%+ posts have no link, but that is who runs them, not the link. Removing your link will not raise engagement, and a post that needs a link should have one.
Is boosting an organic post better than a purpose-built ad?
No difference. Across 86 accounts, boosted posts engage +3% [−4%, +17%] against purpose-built creatives, with cost per landing page click −12% (not significant) and an identical 11% decay. A post's organic track record does not transfer to paid.
What seniority should thought leader ads target?
CXOs engage 4.42% against 3.46% for senior individual contributors, at the same cost per landing page click ($12.51 to $13.47 across every tier). Campaigns with no seniority filter pay the most per click of any group, $16.88, and 79% of spend sets no filter. Director and above, with one or two job functions, is the setting we use.
How much of LinkedIn ad spend goes to thought leader ads?
In this panel, $8.4M of $31M, about 27%, across 464 of 464 accounts that run them, with 411 also running sponsored content. Median account spend on thought leader ads is $4,345 a year; the top 5% of accounts (23 of them) account for 51% of all TLA spend.
What is the difference between a thought leader ad and sponsored content?
A thought leader ad is a company-sponsored post from a person's profile; sponsored content is a post from the company page. On the same objective a TLA is cheaper per landing page click, 22% cheaper on engagement, 47% on brand awareness, but sponsored content on the traffic objective beats both at $11.75, and TLAs get identical click rates (0.449% vs 0.441%) at a higher CPM ($74.71 vs $48.80). The whole TLA premium is media cost.
Kiin Labs is the research arm of Kiin, a London B2B demand generation agency and LinkedIn Ads intelligence platform. Kiin manages 200+ B2B ad accounts and runs thought leader ads for clients; this analysis draws on accounts connected to Kiin Intelligence, the analytics layer the study came out of. Three of Kiin's eight-person team came from LinkedIn Marketing Solutions.
Related: LinkedIn Ads agency · SaaS PPC agency · LinkedIn Ads · how to target CEOs with LinkedIn Ads · what a good LinkedIn Ads CTR actually is · the Kiin LinkedIn Ads MCP.