
Every LinkedIn campaign across every US dollar advertiser account connected to Kiin Intelligence, Audience Network excluded: $34.8M of spend, 491 advertisers, 10,248 campaigns, 714 million impressions and 1.39 million landing page clicks. 9,297 of those campaigns carry the target audience size LinkedIn reported before launch, which is what most of this report is built on. Every benchmark is a median across advertiser accounts. Every comparison described as paired is the same advertiser running both things in the same year.
Ilic, P. (2026). LinkedIn audience targeting: 2026 benchmarks. Kiin Labs. kiin.co/research/linkedin-audience-targeting-benchmarks. Figures are medians across advertiser accounts and paired within-account comparisons, USD, twelve months to October 2026, LinkedIn Audience Network excluded. Free to cite with a link.
This study comes from Kiin Intelligence, the analytics layer behind Kiin, a London LinkedIn Ads agency with three ex-LinkedIn Marketing Solutions staff and 200+ B2B accounts under management.
Is your targeting too tight? Send read access to your LinkedIn Ads account and we'll show you your audience sizes, your spend per thousand people and your cost per click against every table in this report.Free. Read-only access. No deck, no call, one page.
- ▶The industry teaches the opposite of what the data says
- ▶The eight findings that carry the report
- 01Does narrow targeting actually perform better?
- 02How much should you spend against an audience?
- 03Which targeting facet should you use?
- 04Should you layer filters on a list?
- 05Is retargeting cheaper than cold?
- 06Benchmarks by objective
- 07Ten numbers to quote
- 08Six industry beliefs, tested
- 09Method, and what we can't answer
- 10Frequently asked questions
The industry teaches the opposite of what the data says
Every B2B marketer is taught the same thing about LinkedIn: get the audience tight. Name the titles, stack the filters, keep it small, pay the premium because the people are worth it. It is the most repeated advice in the category and almost nobody has tested it at scale, because testing it needs cost data from hundreds of advertisers rather than one.
On this panel it is wrong, with one important exception. Narrowing a cold audience makes every impression and every click cost about a third more and does not improve the click rate at all. But narrowing a known audience, by layering a job filter onto an account list you already trust, makes the click 26% cheaper. The difference is not how tight the audience is. It is whether the narrowing is adding information or just removing people.
The eight findings that carry the report
Each one links to the chapter with the table behind it. Stars are the number of paired advertisers (★ 5+, ★★ 25+, ★★★ 100+).
Targeting is two different decisions that the platform presents as one. Choosing who matters is strategy and it should be tight. Choosing how few people to put the budget in front of is a media decision and on cold inventory it should be loose. Most accounts collapse the two, narrow on both axes at once, and pay a third more for traffic that performs identically.
Does narrow targeting actually perform better?
It costs more. It does not click better. Those two facts together are the finding, and they hold at every audience size, on every objective and inside the same advertiser account.
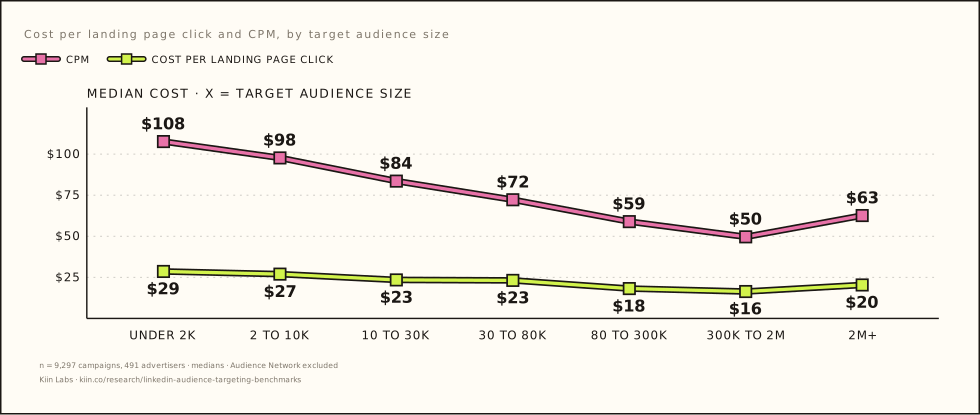
A target audience on LinkedIn is the number of members matched by a campaign's include rules. The platform reports it before launch, and it is the single strongest predictor of what an impression will cost. Across 9,297 campaigns with a reported audience size, cost falls steadily as the audience grows, bottoms out between 300,000 and 2 million people, and turns back up above that.
| Target audience | CPM | Landing page CTR | Cost per LP click | Cost per lead | Campaigns | Advertisers |
|---|---|---|---|---|---|---|
| Under 2,000 | $107.63 | 0.306% | $28.58 | $531 | 1,012 | 207 |
| 2,000 to 10,000 | $97.68 | 0.334% | $26.95 | $459 | 1,911 | 295 |
| 10,000 to 30,000 | $83.54 | 0.338% | $23.42 | $468 | 1,893 | 293 |
| 30,000 to 80,000 | $72.21 | 0.320% | $23.12 | $199 | 1,653 | 277 |
| 80,000 to 300,000 | $58.91 | 0.363% | $18.19 | $190 | 1,565 | 250 |
| 300,000 to 2M | $49.63 | 0.338% | $16.40 | $283 | 790 | 183 |
| 2M and above | $62.59 | 0.352% | $20.35 | $374 | 473 | 123 |
Medians, not averages. Audience Network excluded. US dollar accounts, 12 months to October 2026.
The cost spread is wide: a thousand impressions costs 2.2 times more against an audience under 2,000 people than against one of 300,000 to 2 million. Cost per landing page click runs 74% higher at the narrow end.
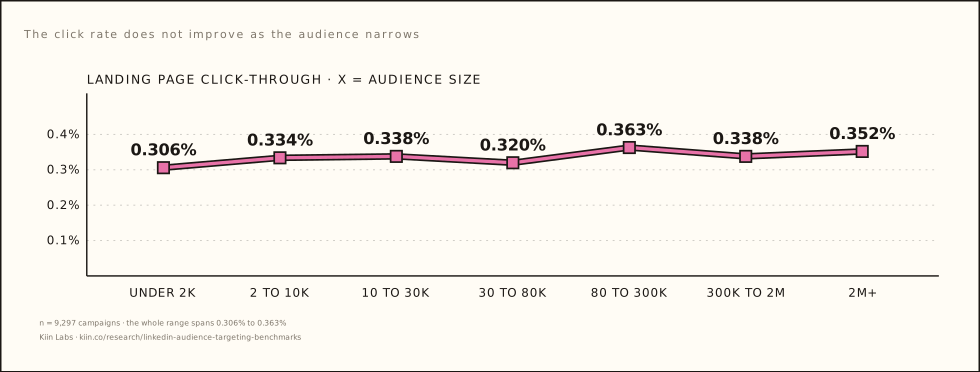
The defence of tight targeting is that the people are more relevant, so they engage more and the higher price buys better traffic. The click-through column is where that argument has to show up, and it does not. The entire range runs from 0.306% to 0.363%, with the best figure belonging to the 80,000 to 300,000 band rather than the tightest one.
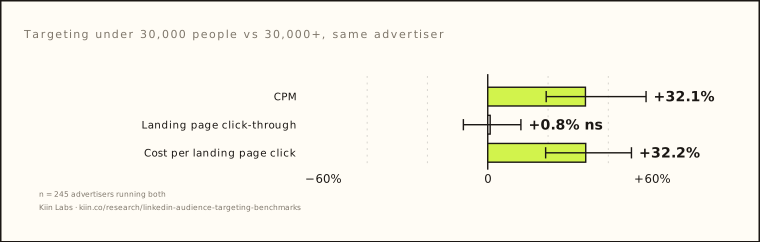
Cross-account comparisons invite an objection: perhaps small advertisers run small audiences, and the cost gap is really a budget or sophistication gap. So we paired it. Every advertiser that ran both a narrow and a broad audience in the same year contributes one ratio, and the median of those ratios is the result.
| Under 30,000 vs 30,000+, same advertiser | Result | 95% interval | Advertisers higher | Significant? |
|---|---|---|---|---|
| CPM | +32.1% | [+19.2%, +52.0%] | 165 of 245 | Yes |
| Landing page click-through | +0.8% | [−8.0%, +10.9%] | 123 of 245 | No |
| Cost per landing page click | +32.2% | [+19.0%, +47.2%] | 159 of 245 | Yes |
245 advertisers ran both. Bootstrap intervals, 4,000 resamples, median of per-account ratios.
Narrowing a cold audience is a cost decision dressed as a quality decision. If an audience is tight because the buyer really is rare, that is the job and the premium is the price of doing it. If it is tight because three extra filters felt rigorous, the account is paying a third more for the same click rate. Ask what each filter removed and what it cost.
How much should you spend against an audience of a given size?
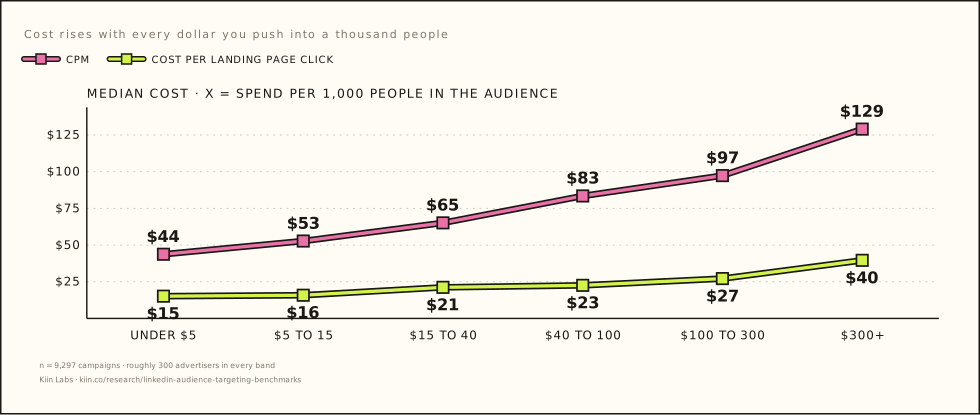
The platform never asks this question and almost no advertiser answers it. Spend per thousand people in the audience predicts cost better than audience size alone, and the relationship is close to perfectly ordered.
Audience size on its own is incomplete. What matters is how hard a budget is pushed through it. Budget sizing against an audience is covered practically in penetration rate and minimum budget and what a LinkedIn Ads monthly budget should be. We divided campaign spend by the audience size in thousands, which gives a clean intensity measure containing no cost term, and sorted the panel by it.
| Spend per 1,000 people in the audience | CPM | Landing page CTR | Cost per LP click | Campaigns | Advertisers |
|---|---|---|---|---|---|
| Under $5 | $43.75 | 0.312% | $15.18 | 1,848 | 317 |
| $5 to $15 | $52.79 | 0.348% | $15.84 | 1,197 | 295 |
| $15 to $40 | $65.16 | 0.319% | $21.21 | 1,322 | 303 |
| $40 to $100 | $83.45 | 0.346% | $22.57 | 1,405 | 299 |
| $100 to $300 | $97.38 | 0.354% | $27.18 | 1,557 | 309 |
| $300 and above | $129.04 | 0.340% | $39.63 | 1,968 | 286 |
Roughly 300 advertisers appear in every band, so this is not a handful of accounts driving the curve.
CPM rises three times over and cost per landing page click 2.6 times, in order, with no reversal. Click-through is flat across a sixty-fold range of spend intensity. Holding spend constant and varying audience instead gives the same answer, and the penalty widens as budgets grow: at under $500 of spend a small audience costs 1.56 times a large one, and at $10,000 and above it costs 2.31 times, with the landing page click at $161.96 against $32.56.
Paired within advertiser, the traffic result holds and a second result appears that runs the other way.
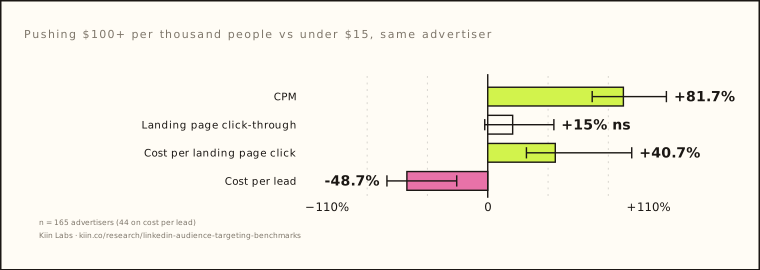
| $100+ per 1,000 vs under $15, same advertiser | Result | 95% interval | Significant? |
|---|---|---|---|
| CPM | +81.7% | [+62.9%, +107.6%] | Yes |
| Landing page click-through | +15.0% | [−1.8%, +39.8%] | No |
| Cost per landing page click | +40.7% | [+23.3%, +86.7%] | Yes |
| Cost per lead | −48.7% | [−60.7%, −18.7%] | Yes |
165 advertisers on the traffic measures, 44 on cost per lead.
Read the last row against the rest. Across accounts, cost per lead rises with spend intensity, from $111 to $601. Paired inside the same account it falls by half. Both are correctly calculated and they disagree, which is the signature of a confound: the advertisers who push hard into small audiences are not a random sample, and the small audiences they push into are warm lists and retargeting pools that convert far better than anything cold.
We do not publish the cross-account cost per lead column, and neither should anyone else. The honest version is narrower and more useful: pushing budget into a small audience makes the traffic markedly dearer, and it is worth doing only when the audience is warm enough to convert at a much higher rate. Buying clicks that way is a bad trade. Buying form fills from a known list is a good one. Most accounts are doing the first while believing they are doing the second.
Which targeting facet should you actually use?
Job titles are the most used and among the most expensive. Skills, seniorities, industries and years of experience are cheaper and barely touched. Most of that gap does not survive pairing, but the title premium does.
LinkedIn exposes roughly twenty targeting facets. Advertisers concentrate on four. Titles appear in campaigns from 383 of the 491 advertisers on the panel; skills appear for 151. Seniority and function cuts priced on their own are in the benchmarks by audience series, and the C-suite premium specifically in what it costs to reach the C-suite.
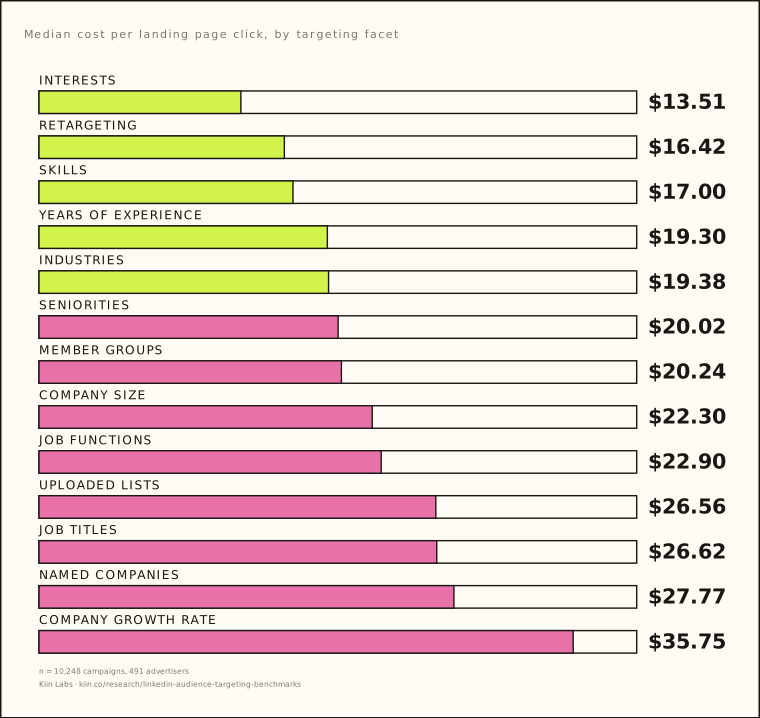
| Facet | Campaigns | Advertisers | Median audience | CPM | LP CTR | Cost per LP click | Cost per lead |
|---|---|---|---|---|---|---|---|
| Uploaded or matched lists | 5,677 | 359 | 23,000 | $91.66 | 0.335% | $26.56 | $426 |
| Job titles | 5,312 | 383 | 31,000 | $88.97 | 0.322% | $26.62 | $335 |
| Company size | 3,309 | 300 | 51,000 | $70.50 | 0.298% | $22.30 | $257 |
| Industries | 2,720 | 312 | 58,500 | $60.78 | 0.323% | $19.38 | $239 |
| Seniorities | 2,699 | 285 | 52,000 | $61.84 | 0.338% | $20.02 | $241 |
| Job functions | 2,491 | 275 | 33,000 | $68.12 | 0.315% | $22.90 | $334 |
| Retargeting segments | 1,934 | 310 | 5,350 | $76.55 | 0.406% | $16.42 | $653 |
| Skills | 1,152 | 151 | 69,000 | $57.59 | 0.359% | $17.00 | $204 |
| Named companies | 945 | 100 | 4,200 | $91.66 | 0.328% | $27.77 | $525 |
| Years of experience | 864 | 100 | 76,000 | $59.43 | 0.316% | $19.30 | $164 |
| Company revenue | 416 | 54 | 63,000 | $88.10 | 0.285% | $26.09 | $512 |
| Interests | 223 | 63 | 110,000 | $55.11 | 0.367% | $13.51 | $271 |
| Member groups | 133 | 37 | 44,500 | $72.59 | 0.371% | $20.24 | $175 |
| Company growth rate | 60 | 19 | 56,000 | $87.19 | 0.253% | $35.75 | $676 |
Cross-account medians. A facet counts if it appears anywhere in the campaign's include rules.
That table is a map of where the money goes, not a ranking of what works. Paired within advertiser, most of the differences disappear: titles against skills comes out at +19% CPM with an interval spanning zero on 60 advertisers, and titles against function-plus-seniority at +10.5%, also not significant. The advertisers who use skills may simply be better operators.
One difference survives everything. Comparing titles-only campaigns against functions-only campaigns inside the same audience-size band, so that narrowness is held constant, the premium is large and consistent.
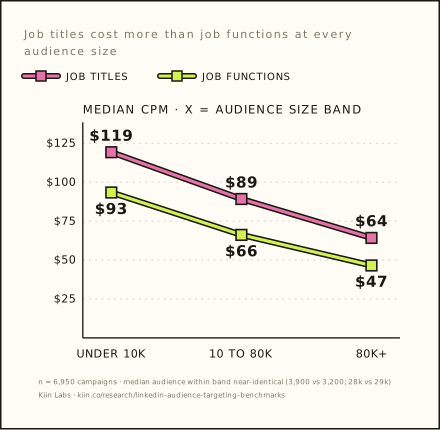
| Audience band | Targeting | Median audience | CPM | LP CTR | Cost per LP click |
|---|---|---|---|---|---|
| Under 10,000 | Job functions | 3,200 | $93.38 | 0.289% | $28.58 |
| Under 10,000 | Job titles | 3,900 | $119.24 | 0.295% | $36.22 |
| 10,000 to 80,000 | Job functions | 29,000 | $66.15 | 0.318% | $22.33 |
| 10,000 to 80,000 | Job titles | 28,000 | $89.16 | 0.318% | $26.53 |
| 80,000 and above | Job functions | 280,000 | $46.51 | 0.319% | $16.51 |
| 80,000 and above | Job titles | 190,000 | $64.19 | 0.351% | $20.36 |
Median audience within each band is near-identical, so this is a like-for-like comparison. Paired within advertiser the same comparison gives +13.0% CPM [+0.8%, +34.2%], significant on 142 advertisers.
The premium runs +28%, +35% and +38% across the three bands, and the click rate is the same to three decimal places in the middle band. Title targeting is the most crowded inventory on the platform and it prices accordingly.
Two smaller results. Adding seniority on top of job function lowers landing page click-through by 23.9% on 37 paired advertisers, significant. And campaigns that use exclusions run 19.2% lower CPM and 60.0% lower cost per lead than campaigns in the same account that use none, both significant, at a 24.4% lower click rate.
Function and seniority is the cheaper base layer and the data does not show titles earning their premium. Use titles where the function taxonomy genuinely mis-files the buyer, which happens often enough to matter, and not as the default first move. What we cannot test from advertiser-side data is how much of a title's true population LinkedIn's standardised facet actually captures; that needs member data nobody outside LinkedIn holds.
Should you layer job filters on top of an uploaded list?
Yes, and this is the clearest result in the report. The same list, with a person filter on top, costs 30% more per impression and delivers a landing page click 26% cheaper.
Account lists are the backbone of B2B targeting and the layering question is the one practitioners actually argue about. You upload 500 companies. Do you then add job titles, or let LinkedIn serve anyone at those companies? If you have not built the list yet, start with how to build a B2B account list for LinkedIn Ads.
Comparing layered campaigns against bare ones across the panel is misleading, because the lists are different sizes in each group. Instead we identified the individual audience segments by their LinkedIn identifiers, found the 362 segments that were run both ways, and compared the same list against itself.
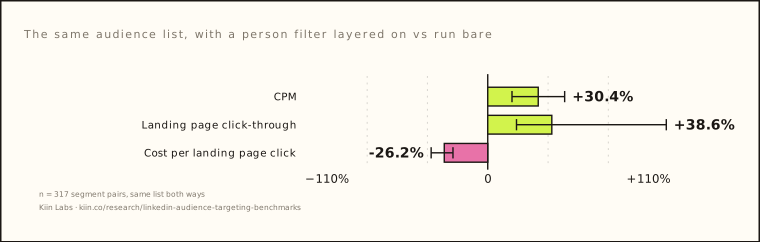
| Same list, layered vs bare | Result | 95% interval | Segments higher | Significant? |
|---|---|---|---|---|
| CPM | +30.4% | [+14.6%, +46.3%] | 197 of 317 | Yes |
| Landing page click-through | +38.6% | [+17.3%, +107.5%] | 136 of 227 | Yes |
| Cost per landing page click | −26.2% | [−34.1%, −20.9%] | 77 of 227 | Yes |
| Cost per lead | −6.7% | [−56.6%, +65.3%] | 25 of 51 | No |
317 segment pairs. A layer means job titles, seniorities or job functions added to the list's include rules.
This is the exact opposite of Chapter 1 and both results are correct. Narrowing a cold audience by shrinking it buys nothing. Narrowing a known audience by filtering to the right people inside it pays for itself twice over. The list establishes which companies matter; the layer establishes who inside them is worth reaching.
For completeness: lists themselves are not cheap. Paired within 165 advertisers, uploaded lists run +18.2% CPM and +19.7% cost per landing page click against cold native targeting, both significant, with click-through indistinguishable. Named-company targeting runs +23% on the same measure across 72 advertisers.
A bare list is an unfinished audience. The companies are right and the people are a lottery, and the panel says you pay for that lottery in click-through. The layer is not an extra filter to be justified; it is the half of the targeting that identifies a buyer. What a list buys you is permission to layer aggressively without paying the cold-audience narrowness penalty.
Is retargeting cheaper than cold targeting?
Across accounts it looks much cheaper. Inside the same advertiser the difference disappears entirely, on every measure we can test.
Retargeting carries the best headline numbers on the panel: the highest landing page click-through of any facet at 0.406%, and a landing page click at $16.42 against a panel median of $22.76. Those figures are real and they are also misleading. The practitioner setup is in LinkedIn retargeting for B2B, and the paired cold-versus-retargeting result for the inbox in conversation ads: retargeting against cold.
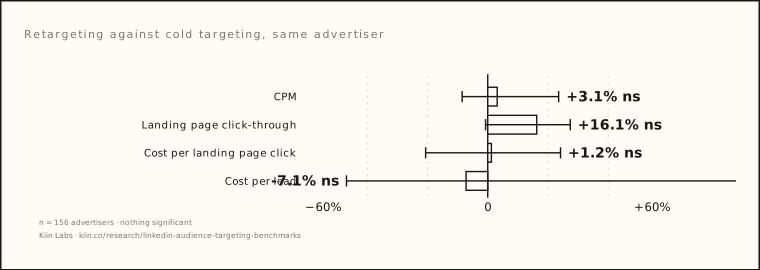
| Retargeting vs cold, same advertiser | Result | 95% interval | Significant? |
|---|---|---|---|
| CPM | +3.1% | [−8.4%, +23.3%] | No |
| Landing page click-through | +16.1% | [−0.7%, +27.1%] | No |
| Cost per landing page click | +1.2% | [−20.4%, +23.9%] | No |
| Cost per lead | −7.1% | [−46.4%, +218.5%] | No |
| Engagement rate | −10.1% | [−31.0%, +8.0%] | No |
156 advertisers ran both. Every interval spans zero.
Nothing is significant. The cross-account advantage is a selection effect: advertisers who build and maintain retargeting audiences are, on average, running better accounts in general, and that quality shows up in their cold campaigns too.
Retargeting does have one genuine structural property. Its click rate is flat across every audience size, from under 2,000 people to over 50,000, where cold targeting's click rate moves with size. Familiarity substitutes for precision.
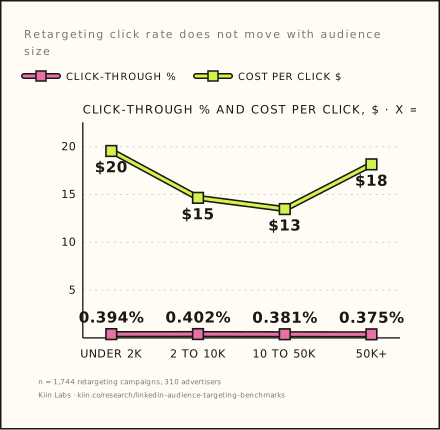
| Retargeting audience | CPM | LP CTR | Cost per LP click | Cost per lead | Campaigns |
|---|---|---|---|---|---|
| Under 2,000 | $95.54 | 0.394% | $19.56 | $598 | 451 |
| 2,000 to 10,000 | $79.41 | 0.402% | $14.65 | $534 | 634 |
| 10,000 to 50,000 | $58.55 | 0.381% | $13.48 | $994 | 353 |
| 50,000 and above | $63.71 | 0.375% | $18.16 | $688 | 306 |
Click-through varies by less than three hundredths of a percentage point across a 25-fold range of audience size.
The cost per lead column should be read with care. Only 17.5% of retargeting campaigns record any in-platform lead at all, because retargeting on this panel is a traffic and conversion play: 30.9% of its campaigns run on website visits and 12.2% on website conversions, against 4.1% for lists and 5.2% for cold. Judging it on lead form completions measures the wrong thing.
Retargeting earns its place by catching intent that already exists, not by being cheap. Nobody should budget for it expecting a discount on cold traffic, because inside a single account there is not one. The real argument for it is that audience size stops mattering, which means it is the one place where a tight audience carries no penalty.
Benchmarks: what the narrowness penalty costs on each objective
The penalty is universal and it is worst precisely where advertisers narrow hardest.
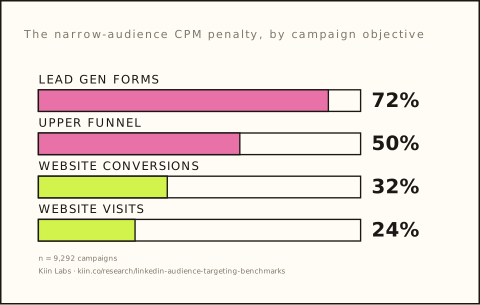
| Objective | Audience | CPM | Landing page CTR | Cost per LP click | Campaigns |
|---|---|---|---|---|---|
| Website visits | 30,000+ | $55.47 | 0.420% | $13.44 | 1,215 |
| Website visits | Under 30,000 | $69.03 (+24%) | 0.440% | $15.66 | 1,195 |
| Website conversions | 30,000+ | $70.98 | 0.431% | $15.82 | 286 |
| Website conversions | Under 30,000 | $93.41 (+32%) | 0.448% | $21.05 | 215 |
| Upper funnel | 30,000+ | $62.91 | 0.201% | $38.03 | 1,810 |
| Upper funnel | Under 30,000 | $94.46 (+50%) | 0.229% | $43.16 | 2,344 |
| Lead gen forms | 30,000+ | $71.00 | — | — | 1,169 |
| Lead gen forms | Under 30,000 | $122.22 (+72%) | — | — | 1,058 |
Upper funnel is brand awareness, engagement and video views combined. Landing page metrics are omitted for lead gen forms because the form opens in-platform and produces almost no landing page clicks.
Lead gen form campaigns carry the largest penalty and are also the campaigns advertisers narrow most aggressively, on the reasoning that a form submission from the wrong person is worse than no submission. The panel says that reasoning costs 72% on the price of an impression before a single form is opened.
If an account is going to run one narrow audience, it should not be the lead gen form campaign. That is where the inventory penalty is steepest and where a warm list, layered, would do the same job at a fraction of the impression cost.
Ten numbers to quote, and what each rests on
Every figure below is median-based, computed on US dollar accounts with LinkedIn Audience Network excluded, over the twelve months to October 2026.
| Number | What it is | Base |
|---|---|---|
| +32.2% | Cost per landing page click, audiences under 30,000 vs 30,000+, same advertiser | 245 advertisers, paired, significant |
| +0.8% | Landing page click-through for the same comparison. Not significant | 245 advertisers, interval [−8.0%, +10.9%] |
| $15.18 to $39.63 | Cost per landing page click, under $5 vs over $300 spend per thousand audience | 9,297 campaigns, roughly 300 advertisers per band |
| −26.2% | Cost per landing page click when a person filter is layered on the same list | 317 segment pairs, significant |
| +38.6% | Click-through gain from that same layer | 227 segment pairs, significant |
| +28% to +38% | CPM premium for job titles over job functions at matched audience size | 6,950 campaigns across three size bands |
| +19.7% | Cost per landing page click, uploaded lists vs cold native targeting, same advertiser | 165 advertisers, paired, significant |
| +1.2% | Cost per landing page click, retargeting vs cold, same advertiser. Not significant | 156 advertisers, interval [−20.4%, +23.9%] |
| +72% | CPM penalty for narrow audiences on lead gen form campaigns | 2,227 campaigns |
| $161.96 vs $32.56 | Cost per landing page click at $10,000+ spend, audience under 10,000 vs over 80,000 | 331 campaigns |
Cite as: Kiin Labs, LinkedIn audience targeting 2026 benchmarks, kiin.co/research/linkedin-audience-targeting-benchmarks
Six things the industry believes about LinkedIn targeting
Each verdict is the result of the test described, not an opinion.
| Belief | Verdict | The evidence |
|---|---|---|
| Tight targeting is worth paying for | False for cold audiences | +32% cost per click, +0.8% click-through, 245 paired advertisers |
| Narrow audiences bring more relevant clicks | Not supported | Click-through 0.306% to 0.363% across a thousand-fold size range |
| Job titles beat job functions | Costs 28 to 38% more, no measured gain | Matched audience bands, 6,950 campaigns; +13.0% paired, significant |
| Retargeting is cheaper than cold | False within an account | Every measure non-significant across 156 paired advertisers |
| Uploaded lists are more efficient | False on traffic cost | +18.2% CPM, +19.7% per click, 165 paired advertisers |
| Layering filters on a list over-restricts it | False, it is the best move in the report | Same list: −26.2% per click, +38.6% click-through, 317 pairs |
What this is built on, and what it cannot answer
10,248 campaigns from 491 advertisers, $34.8M of spend, 714 million impressions, 1.39 million landing page clicks and 52,372 form completions, in the twelve months to October 2026.
Inclusion. US dollar accounts only, so no currency conversion distorts a cost figure. LinkedIn Audience Network excluded throughout, because off-platform delivery prices differently and would flatter broad audiences. Campaigns need at least 1,000 impressions and non-zero spend. Target audience size is the figure LinkedIn reported for the campaign; 9,297 of the 10,248 campaigns carry one.
Medians, not averages. Every headline figure is a median, and paired tests take the median of per-advertiser ratios rather than pooling spend. One large advertiser cannot move a result.
Pairing. A paired test uses only advertisers that ran both things being compared, in the same year. Intervals are 95% bootstrap, 3,000 to 4,000 resamples. A result is called significant only when the interval excludes zero, and non-significant results are published with the same prominence as significant ones.
Targeting structure. LinkedIn's include rules are an AND of OR-groups. Facets inside one group are united; separate groups are intersected. Where a list and job titles both appear, 10,536 campaigns intersect them against 804 that unite them, so layering in this report means a genuine narrowing in 93% of cases.
What we cannot answer. Whether LinkedIn's standardised job title facet captures all, half or most of the members who hold a given title. That requires member-side data. Whether the extra clicks from including small companies convert worse, because only one advertiser ran both configurations with measurable lead volume. And anything about pipeline or revenue quality, because this panel sees platform outcomes, not CRM outcomes.
One analysis we discarded. Impressions divided by audience size looks like a frequency measure and produces a clean relationship with CPM. It is circular: impressions are spend divided by CPM, so the measure contains CPM in its denominator and the relationship is guaranteed. Spend per thousand audience members, used in Chapter 2, has no such problem.
Frequently asked questions about LinkedIn audience targeting
Does a smaller LinkedIn audience cost more?
Yes. Across 9,297 campaigns, a target audience under 2,000 people costs a median $107.63 CPM against $49.63 for an audience of 300,000 to 2 million. Paired inside the same advertiser, audiences under 30,000 people cost 32.1% more per thousand impressions and 32.2% more per landing page click than audiences above 30,000.
Do narrow LinkedIn audiences get better click-through rates?
No. Landing page click-through runs between 0.306% and 0.363% across the entire size range, and the best figure belongs to the 80,000 to 300,000 band rather than the narrowest. Paired within advertiser the difference is +0.8%, not statistically significant.
What is the ideal LinkedIn ads audience size?
On cost per landing page click the panel bottoms out between 80,000 and 2 million people, at $16.40 to $18.19. On cost per lead the best band is 30,000 to 300,000, at $190 to $199. Below 10,000 people both measures deteriorate sharply.
How much should I spend against a LinkedIn audience?
Keep spend under roughly $15 per thousand people in the audience. At that intensity the median landing page click costs $15.18 to $15.84. Above $300 per thousand it costs $39.63, and CPM is three times higher.
Is job title targeting better than job function targeting on LinkedIn?
It costs 28% to 38% more per thousand impressions at the same audience size, with no measured improvement in click-through. Paired within advertiser the premium is 13.0% and statistically significant. Titles are used by 383 of 491 advertisers on the panel, which is why the inventory is priced the way it is.
Should I layer job titles on top of an uploaded account list?
Yes. Looking at 317 audience segments run both ways, adding a title, seniority or function filter to the same list raised CPM by 30.4% but raised click-through by 38.6%, making the landing page click 26.2% cheaper. All three results are statistically significant.
Is LinkedIn retargeting cheaper than cold targeting?
Not inside the same advertiser account. Across 156 advertisers running both, CPM, click-through, cost per click, cost per lead and engagement rate were all statistically indistinguishable. Retargeting looks cheaper across accounts because advertisers who run it tend to run better accounts overall.
Should I exclude companies with 1 to 10 employees?
Excluding them costs click-through. Campaigns that include micro companies show a 31.9% higher landing page click rate, paired within advertiser and significant across 27 advertisers. Whether those extra clicks convert worse cannot be answered from this panel, because only one advertiser ran both configurations with measurable lead volume.
Do exclusions improve LinkedIn ad performance?
Campaigns using exclusions show 19.2% lower CPM and 60.0% lower cost per lead than campaigns in the same account using none, both significant, alongside a 24.4% lower click-through rate.
What is the narrowest audience worth running on LinkedIn?
If the audience is cold, the data gives no reason to go below about 30,000 people. If it is a known account list or a retargeting pool, size stops predicting cost: retargeting click-through varies by less than three hundredths of a percentage point from under 2,000 people to over 50,000.
Keep reading
How tight is your targeting, and what is it costing you? Kiin runs LinkedIn Ads for sales-led B2B companies and benchmarks every account against the 1,000+ connected to Kiin Intelligence: audience sizes, spend per thousand people, cost per click and cost per lead against every table in this report.